On Black Friday, every ad platform has a good day. Meta reports a record ROAS, Google reports one, TikTok reports one, and the email tool claims its share too. Add them up and the platforms have often sold more than your shop received. After iOS 14, SugarGang saw four or five platforms each claim a purchase that appeared once in Shopify.
None of the platforms is lying. Each counts every conversion inside its own attribution window, with no knowledge of the others. The result is that channel ROAS, read one platform at a time, cannot tell you whether the week made money.
MER can. Marketing efficiency ratio divides all your revenue by all your marketing spend. It cannot tell you which channel worked, but it cannot be double counted either. It is the number that answers the question every founder asks on the Monday after Cyber Monday: did the extra spend pay for itself?
This guide covers what MER, ROAS, blended ROAS and POAS each measure, why the platform totals never reconcile, what MER cannot tell you, how to turn it into a break-even target on contribution margin, and how to use a daily MER scoreboard during Black Week.
Admetrics is a marketing measurement and budget platform for ecommerce and DTC brands. We measure what drove each order independently of the ad platforms, work out the profit left after costs and returns, and help brands move budget toward what earns. The guide draws on what we see across more than 100 brands on the platform.
Key takeaways
- MER is total revenue divided by total marketing spend. It cannot say which channel worked, but it cannot be double counted.
- Platform ROAS, added up, usually exceeds reality. In our worked month the platforms claim €355,000 of revenue against €300,000 in the shop: a combined ROAS of 4.7 against an MER of 4.0.
- Use MER for the whole, channel attribution for the parts. MER is the check on the total; deduplicated attribution and marketing mix modeling split it by channel.
- Set MER targets on contribution margin. Break-even MER is 1 divided by your CM2 ratio: 2.5 at full price in our example, 4.0 at 20% off, 7.0 at 30% off.
- In Black Week, the best revenue day can be the worst MER day. Track MER daily against break-even, not revenue against last year.
- Split out new-customer MER. Revenue from returning customers flatters MER; acquisition MER shows whether spend bought growth.
- MER improves when budget follows efficiency. Paul Valentine raised MER by 22% by steering ad sets on Admetrics' Efficiency Score.
MER, ROAS, blended ROAS, aMER and POAS
Five ratios with similar names answer five different questions.
MER = total revenue ÷ total marketing spend
Most teams calculate MER on net revenue (after discounts, excluding VAT) and include every paid channel, affiliate commissions and influencer fees in the spend. Whichever definition you choose, keep it fixed. MER is a trend number; it is only useful compared with itself.
POAS and contribution margin are covered in detail in our contribution margin guide, and new-customer metrics in our CAC and NC-CAC guide.
Why platform ROAS adds up to more than your revenue
Every ad platform counts a conversion if it falls inside its own attribution window after an ad interaction. Meta does not know that the same customer also clicked a Google ad, and Google does not know about the Meta view. When one order sits inside several windows, several platforms claim it in full.
A worked month
An illustrative shop takes €300,000 of revenue in a month and spends €75,000 on ads.

The platforms claim 18% more revenue than the shop took, before the email tool adds its own share. And the €300,000 in the shop also includes orders no ad touched at all. Reading platform ROAS one dashboard at a time, every channel looks profitable. Reading MER, the month earned €4 for every €1 of ad spend, and whether that is good depends on margin.
The gap is not a rounding issue. In our onboarding data the pattern repeats:
Our marketing attribution guide explains how to deduplicate those claims so that each order is credited once.
What MER cannot tell you
MER is honest because it is blunt. The same bluntness sets its limits.
Think of the three methods as a set. MER checks the total and cannot be inflated. Attribution splits the total by channel, campaign and creative. Marketing mix modeling estimates what each channel adds when spend changes, including channels people never click. When attribution says a channel is doing well and MER does not move when you scale it, you have found something worth testing.
Break-even and target MER, on contribution margin
An MER of 4.0 is excellent for one shop and a loss for another. What decides it is how much of each euro of revenue is left after product, fulfilment, shipping, payment and returns: the CM2 ratio.
Break-even MER = 1 ÷ CM2 ratio
Target MER = 1 ÷ (CM2 ratio − the CM3 ratio you want to keep)
If 40% of revenue is left as CM2, every euro of marketing needs €2.50 of revenue to break even. To keep 10% of revenue as profit after marketing, it needs €3.33.
Discounts raise the bar
The same illustrative product used in our other guides: €55 net price, 45% product cost (€24.75), €8.25 for fulfilment, shipping and payment per order.

An MER of 4.0 that would be a comfortable profit at full price is exactly break-even at 20% off. That is why last November's MER is not a target for this Black Week unless the discount and the product mix are the same.
In practice, not every order carries the discount. Calculate a weighted CM2 ratio from your planned mix of full-price and discounted orders, and set the Black Week MER floor from that.
A daily MER scoreboard for Black Week
During Black Week, revenue records arrive every day and every dashboard is green. One line on one screen keeps the team honest: today's MER against the break-even MER for the week's margin.
An illustrative Black Week
A shop whose orders mostly carry a 20% discount, so break-even MER is 4.0.

Black Friday is the best revenue day of the week and the worst MER day. At a 25% CM2 ratio, the week's €292,000 of revenue leaves about €73,000 of CM2 against €82,000 of ad spend: a loss of roughly €9,000 in a week every revenue report would celebrate. The spend increase on Friday bought revenue, but each extra euro bought less of it.
How to run the scoreboard
- Set the floor before the week: break-even MER from your planned discount mix, and a target MER for the profit you want to keep.
- Check it several times a day, and use a rolling three-day MER as well, so a single strong or weak day does not drive decisions.
- Track aMER beside MER. If MER holds up only because returning customers are buying, the week is not buying growth.
- When MER falls below break-even, do not cut blindly. Find the campaigns with the lowest POAS and move budget away from them first; the channel view tells you where, MER tells you when.
- Raise spend on the big days only where marginal returns hold. The last euros added on Black Friday usually return the least.
How to raise MER
MER rises when the same spend brings more revenue, or when spend that brings little is moved or removed. Five levers, roughly in order of impact:
Paul Valentine: MER +22%
Paul Valentine, an established German DTC brand, raised MER by 22% with Admetrics. The team steers its ad sets mainly on the Efficiency Score, which lets it respond quickly to performance changes in paid social and paid search.
"In optimizing our campaigns, we mostly rely on the 'Efficiency Score.' The Efficiency Score allows us to quickly respond to performance changes in ad sets. With this, we have been able to record visible successes in both Paid Social and Paid Search." Paul Keil, Performance Marketing, Paul Valentine

The performance overview shows MER and channel results side by side, with each figure drilling down to the orders behind it. See Budget Optimizer for moving budget along response curves.
MER before, during and after Black Week
Common mistakes
- Adding up platform ROAS and calling it performance. The total overlaps; MER does not.
- Comparing MER across periods with different discounts. Compare each week against its own break-even.
- Treating MER as a channel metric. It is a check on the total; use attribution to decide between channels.
- Ignoring returning-customer revenue. A strong MER from existing customers can hide that acquisition stalled.
- Celebrating MER without margin. An MER above last year's can still lose money if the discount is deeper.
MER calculator
Try it with your own numbers: the free MER calculator shows your marketing efficiency ratio from shop revenue and total spend. For break-even ROAS per campaign, use the ROAS calculator.
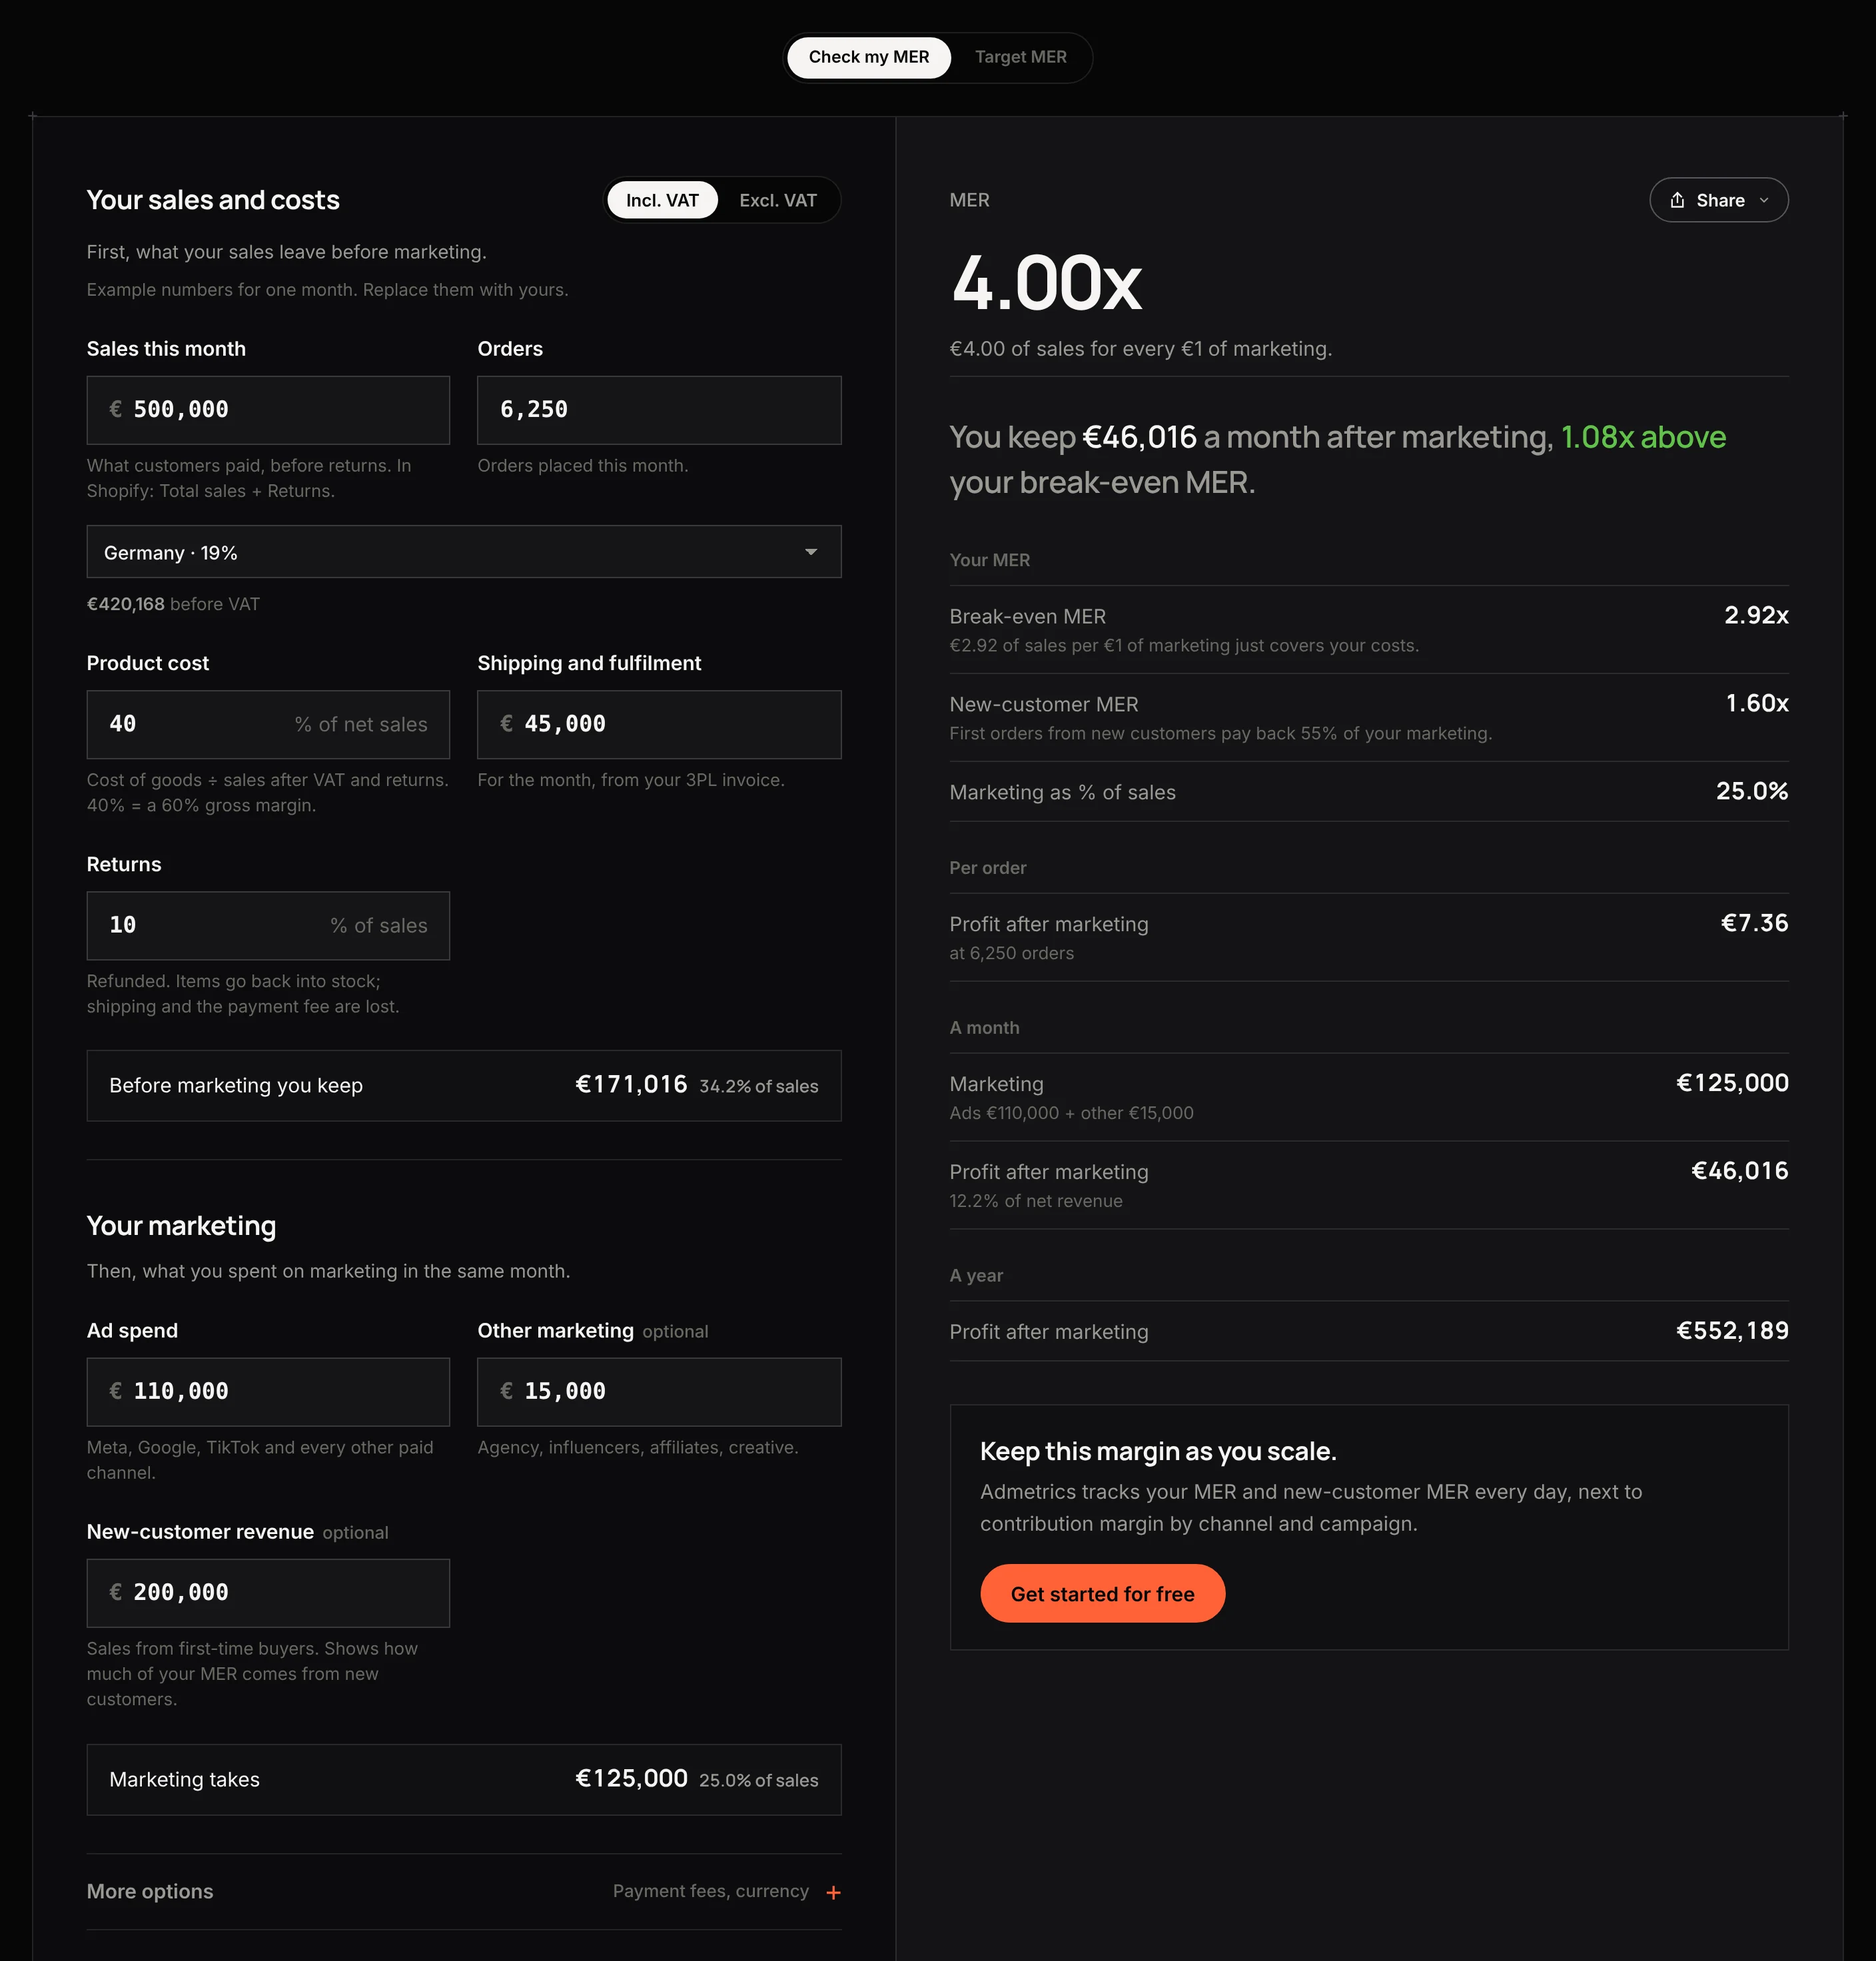
For the CM2 ratio behind your break-even MER, use the contribution margin calculator.
FAQ
What is the difference between MER and ROAS?
ROAS is the revenue one ad platform attributes to its own ads, divided by its spend. MER is all shop revenue divided by all marketing spend. ROAS can be added up to more than your revenue; MER cannot.
What is a good MER?
One above your break-even MER, which is 1 divided by your CM2 ratio. With 40% of revenue left as CM2, break-even is 2.5. A good MER for one shop can be a loss for another with thinner margins.
Is MER the same as blended ROAS?
Often the terms are used interchangeably. Strictly, blended ROAS divides revenue by ad spend only, while MER can include all marketing spend such as agency fees and influencer costs. Say which one you mean.
How do you calculate MER?
Divide total net revenue for a period by total marketing spend for the same period. €300,000 of revenue on €75,000 of spend is an MER of 4.0.
Why does my platform ROAS add up to more than my revenue?
Each platform counts every conversion inside its own attribution window without knowing what the others claimed, so one order can be counted several times.
Should I use MER or ROAS during Black Week?
Both, for different jobs. MER against a break-even floor tells you whether the week is paying for itself; deduplicated channel results tell you where to move budget.
What is aMER?
Acquisition MER: revenue from new customers divided by total marketing spend. It shows whether spend is buying growth or mostly reselling to existing customers.
See MER and channel results on one screen
Admetrics shows MER beside channel and campaign results measured independently of the platforms, with contribution margin, new-customer splits and returns included. In Black Week you see when MER drops below break-even and which campaigns to move budget away from, while you can still act.
Run your biggest week free: Admetrics is free until 1 December. No credit card, no commitment. Get started for free