Creative is a numbers game. Play it with real ones.
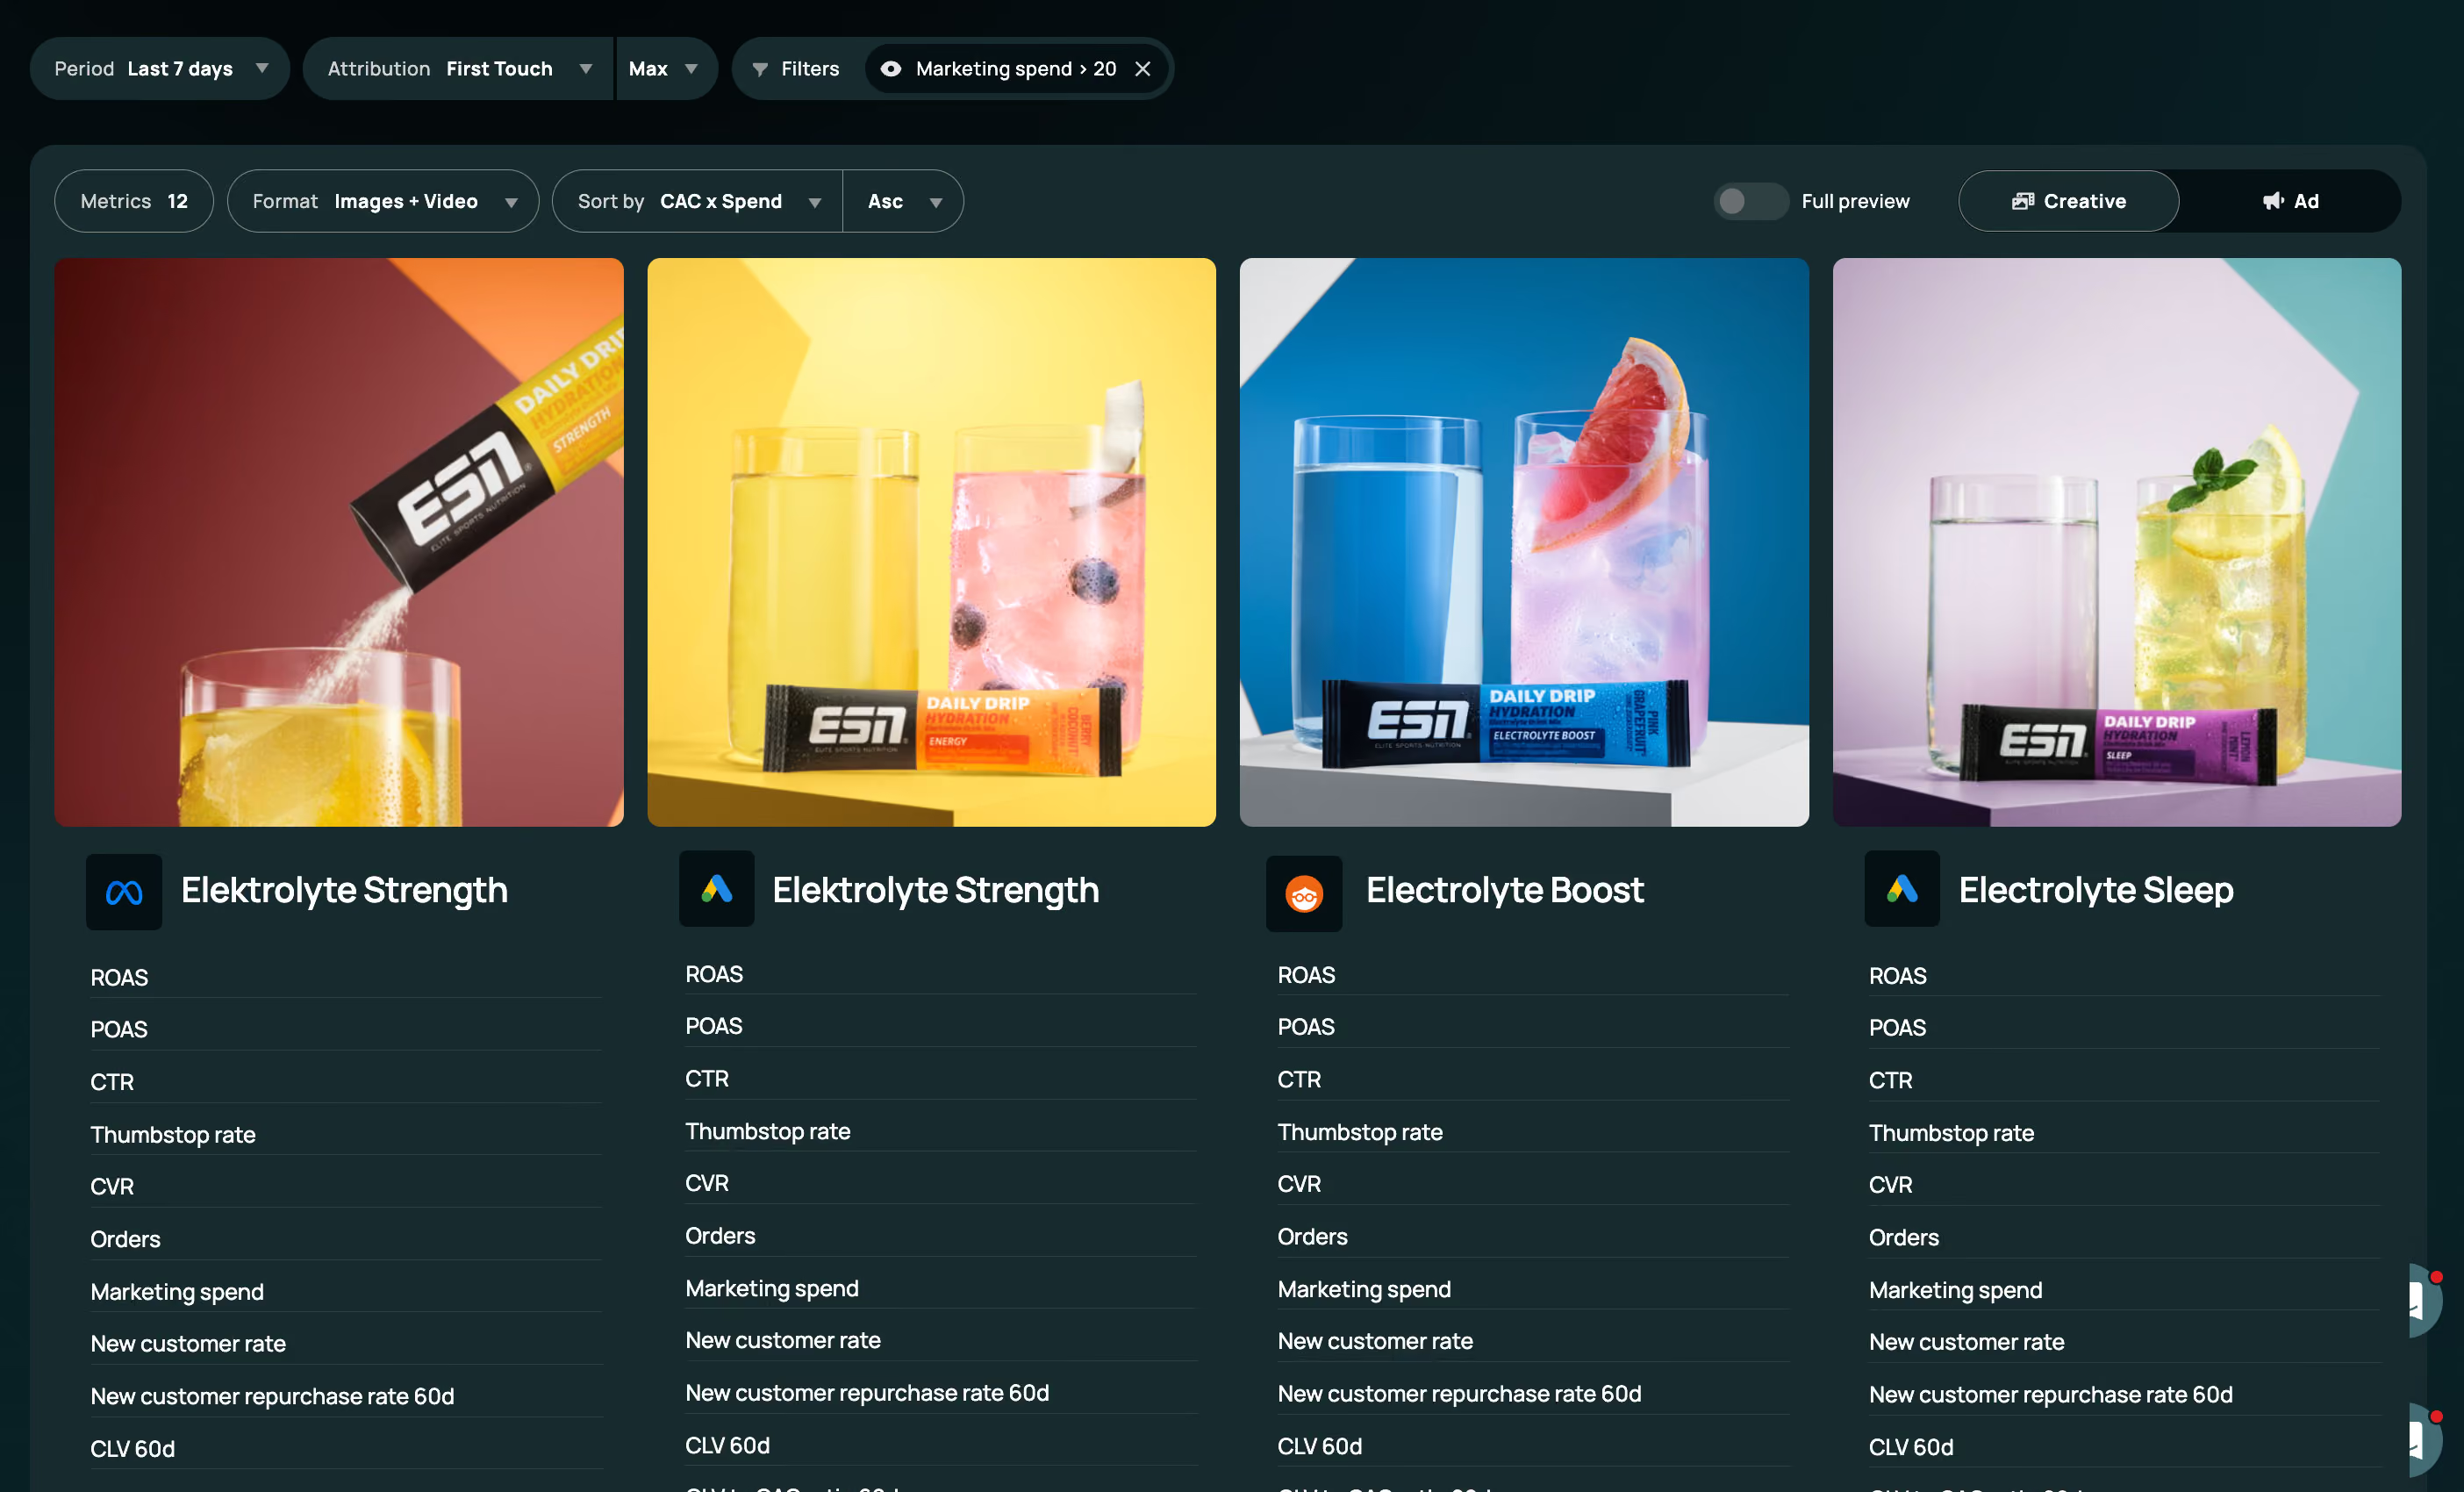
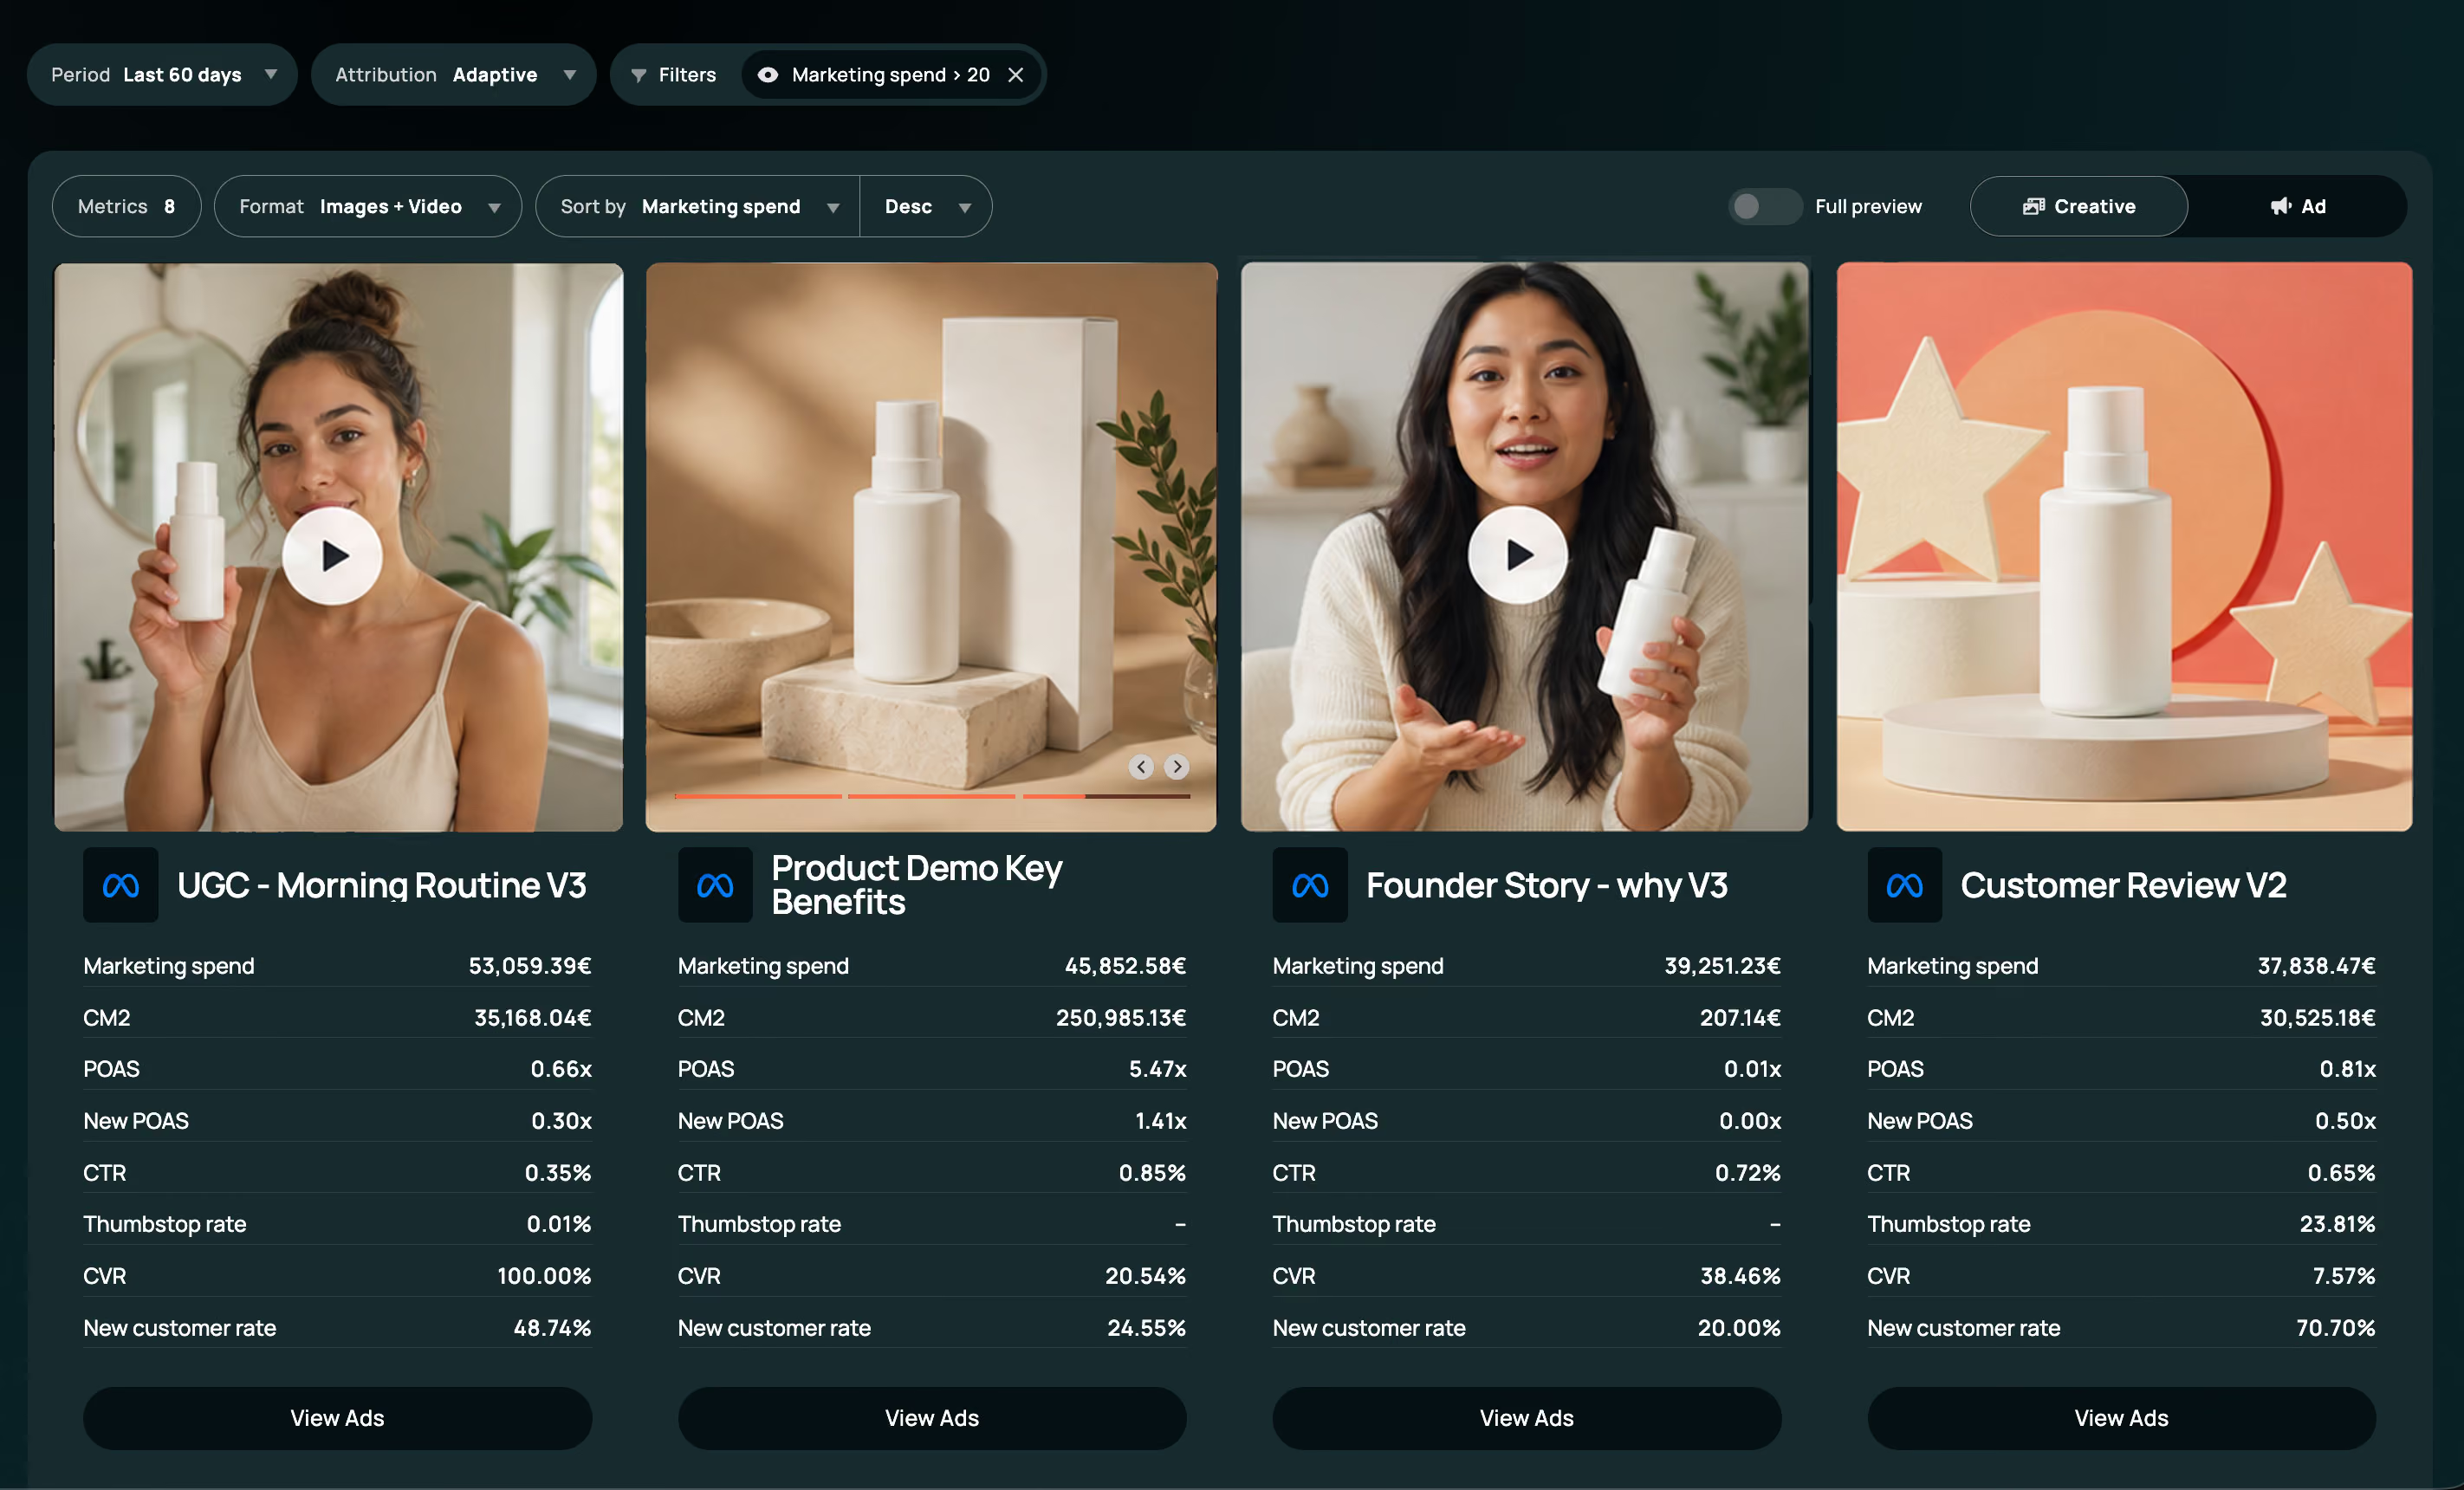
Watch the ad and see what it really earns, side by side. Every creative with its true cost per customer, its profit and its share of new customers, measured independently.
The real numbers.
Every creative ranked by real CAC, profit and new customers, measured by us - not by the platform selling you the placement.
Wear-out flagged before the CAC damage, not after.
Find the creatives that start journeys and stop cutting your best performer.
The ad and its truth, side by side.
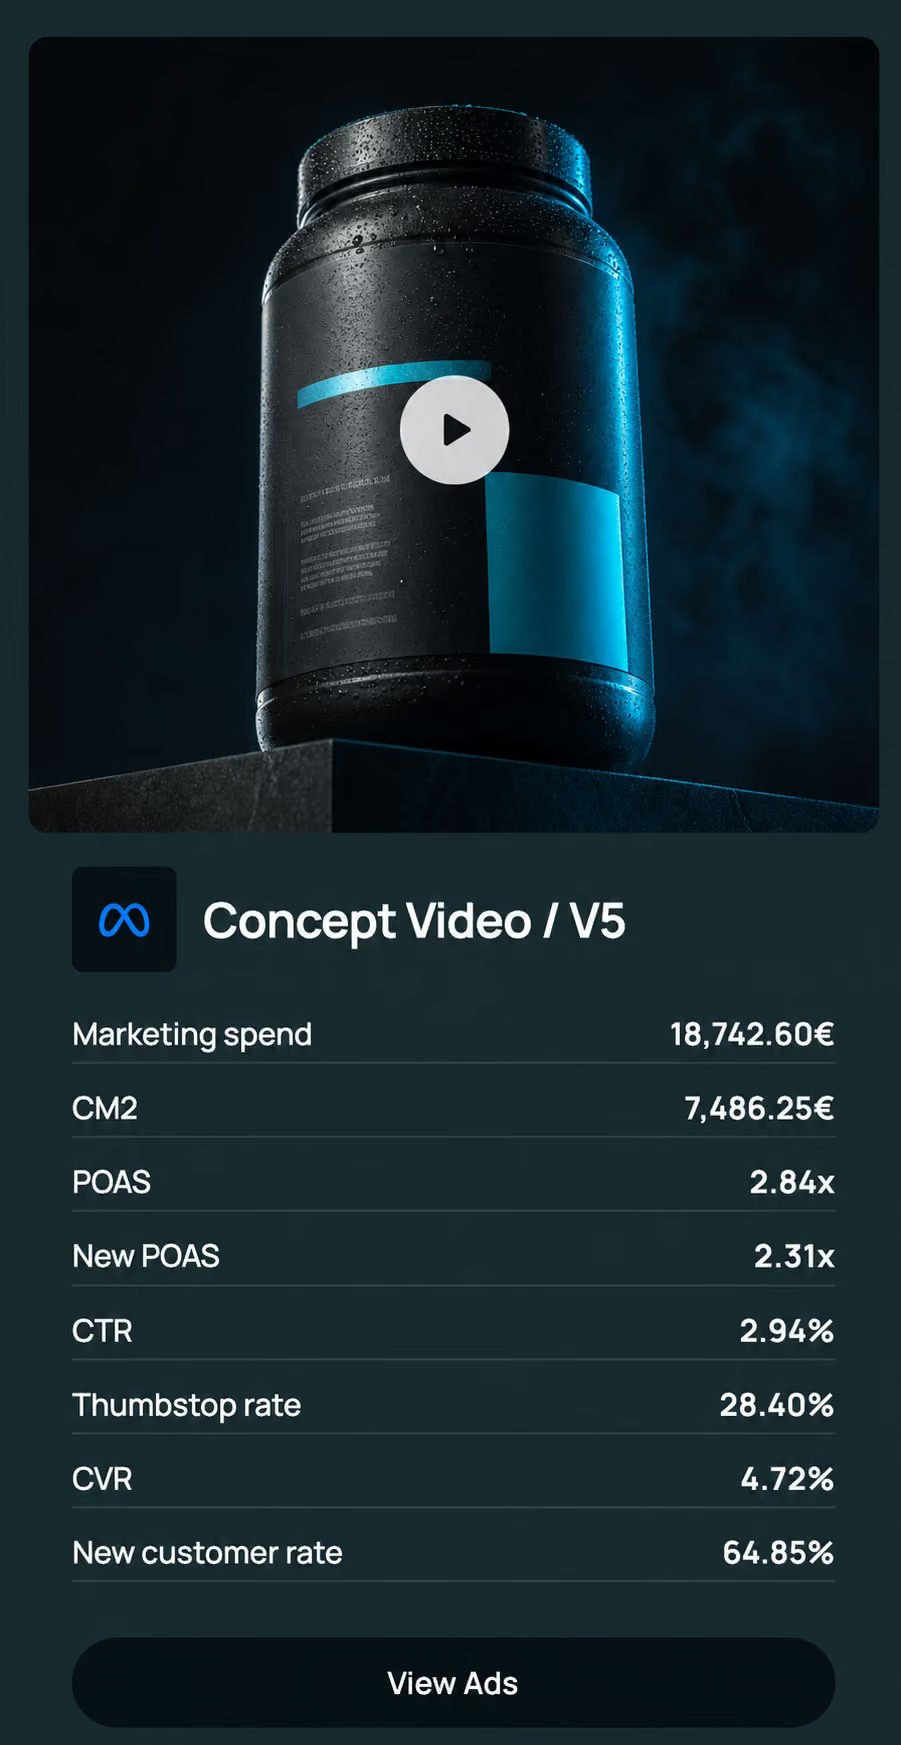
Video previews and thumbnails next to spend, CAC, POAS, hook rate and new-customer share. Watch what your audience watched, and see what it earned you.

Apples to apples, finally.
The same asset runs in five campaigns under five names. We group it into one performance picture, so the true winner cannot hide.
Five superpowers. Every view.
Fresh, profit-true, askable, portable. And they can move budgets.
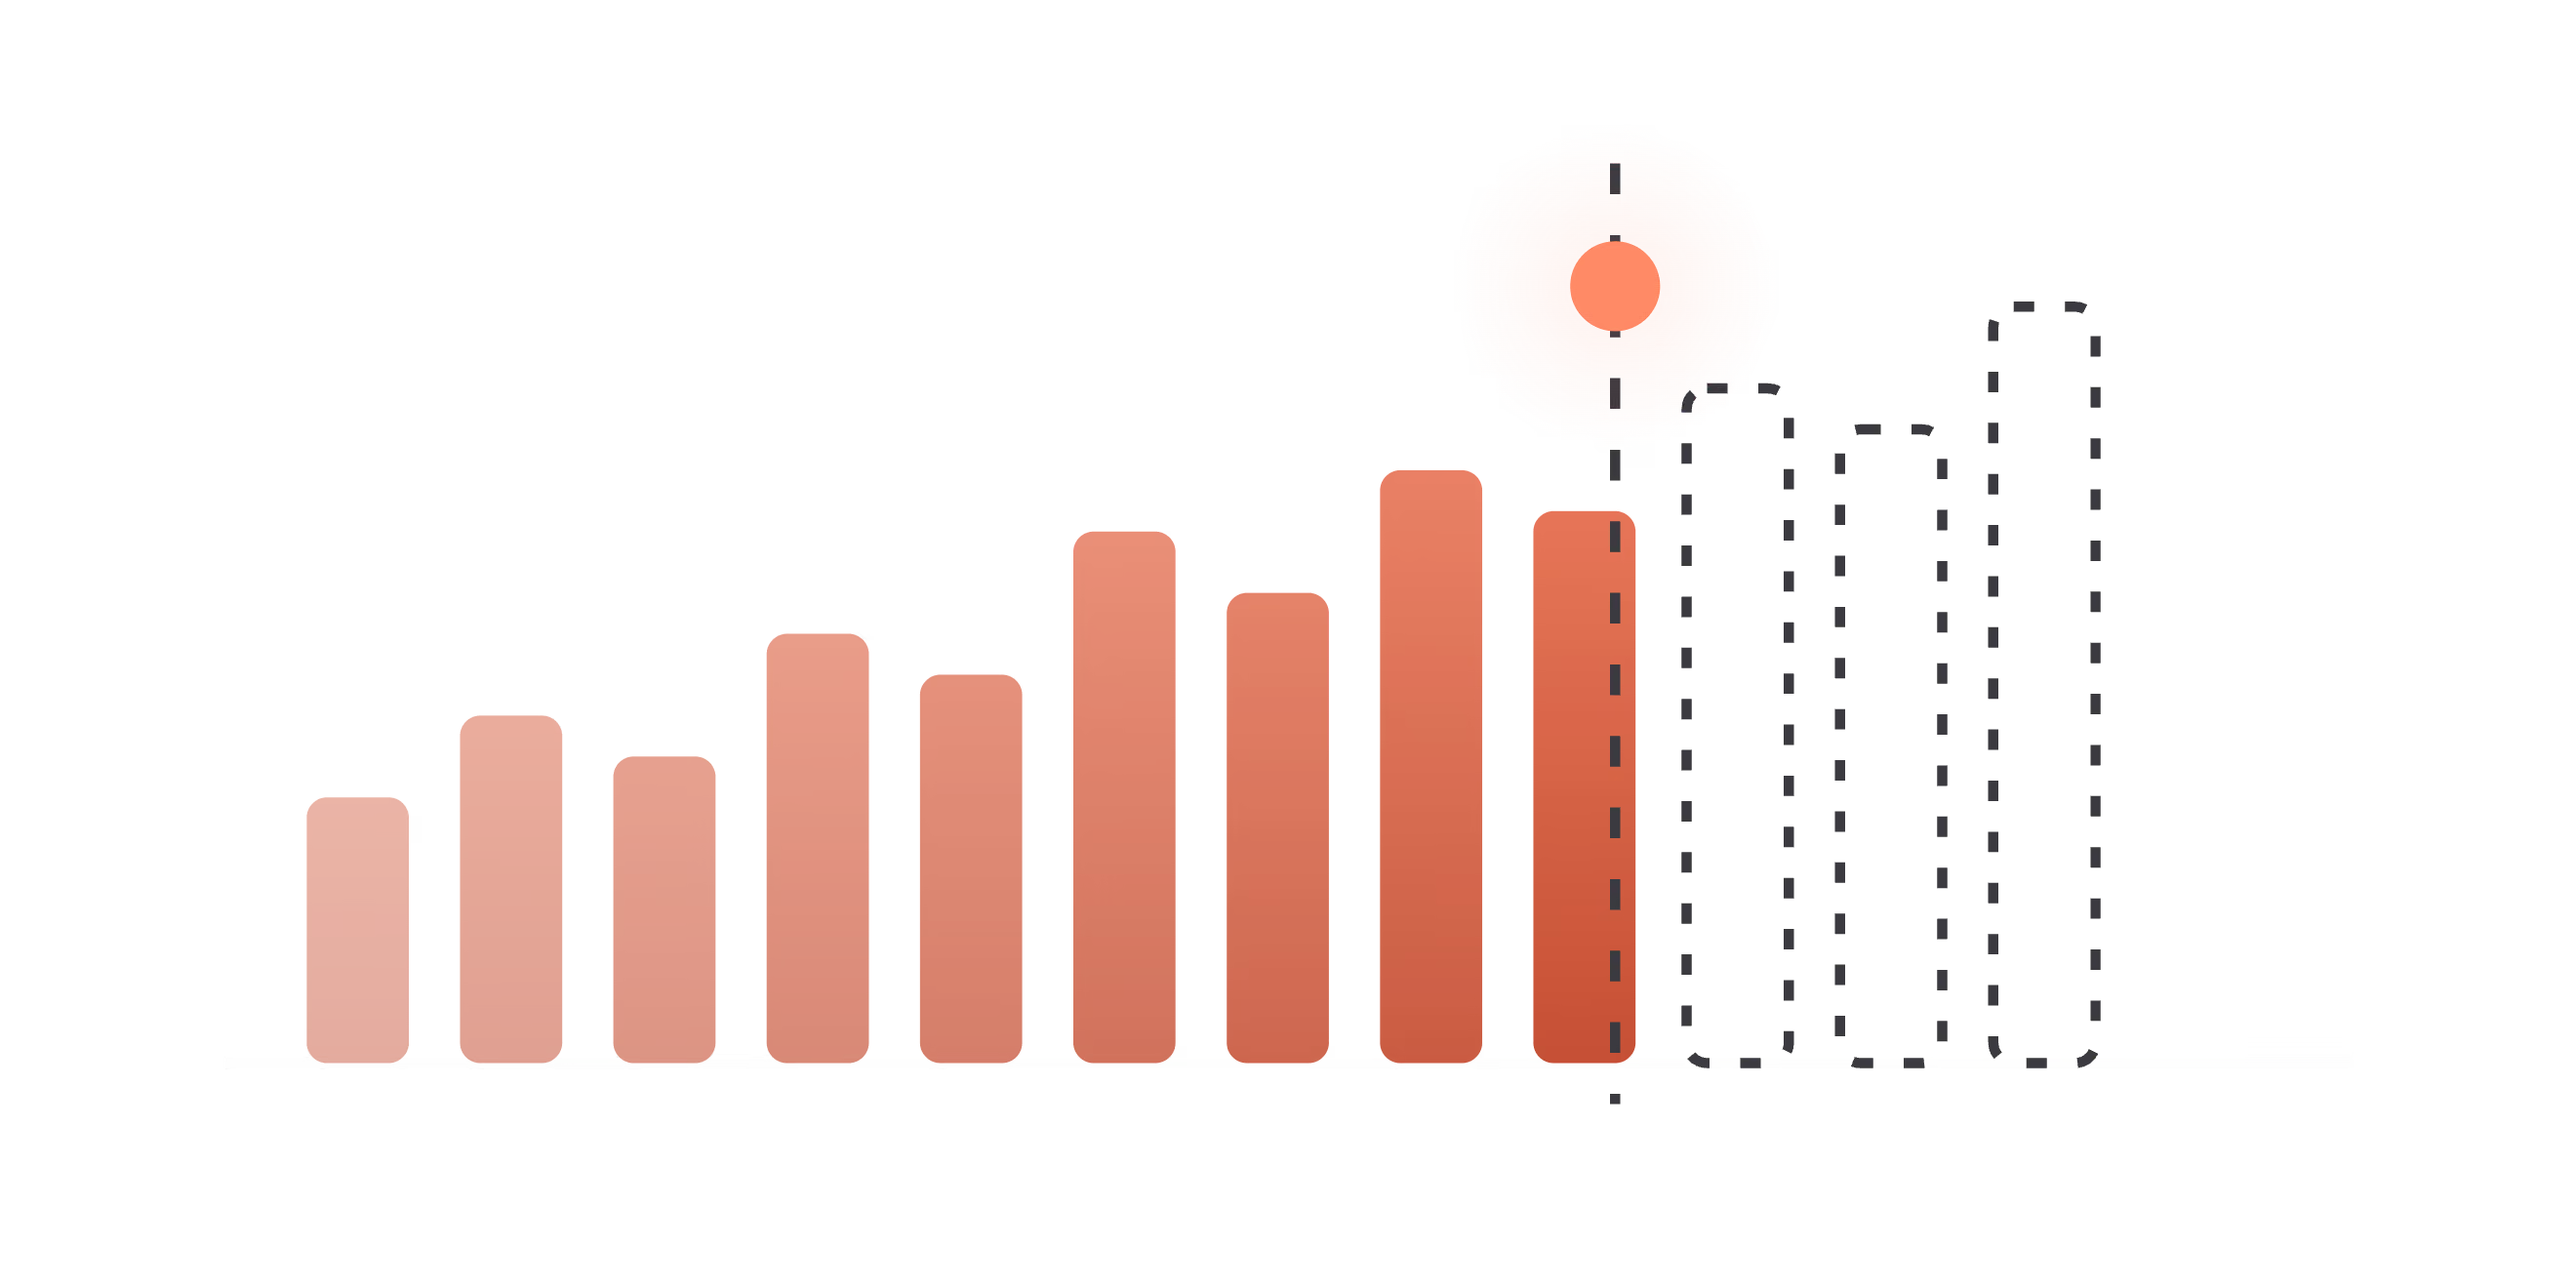
Live through the day. Every number shows its age. Nobody waits for month-end.
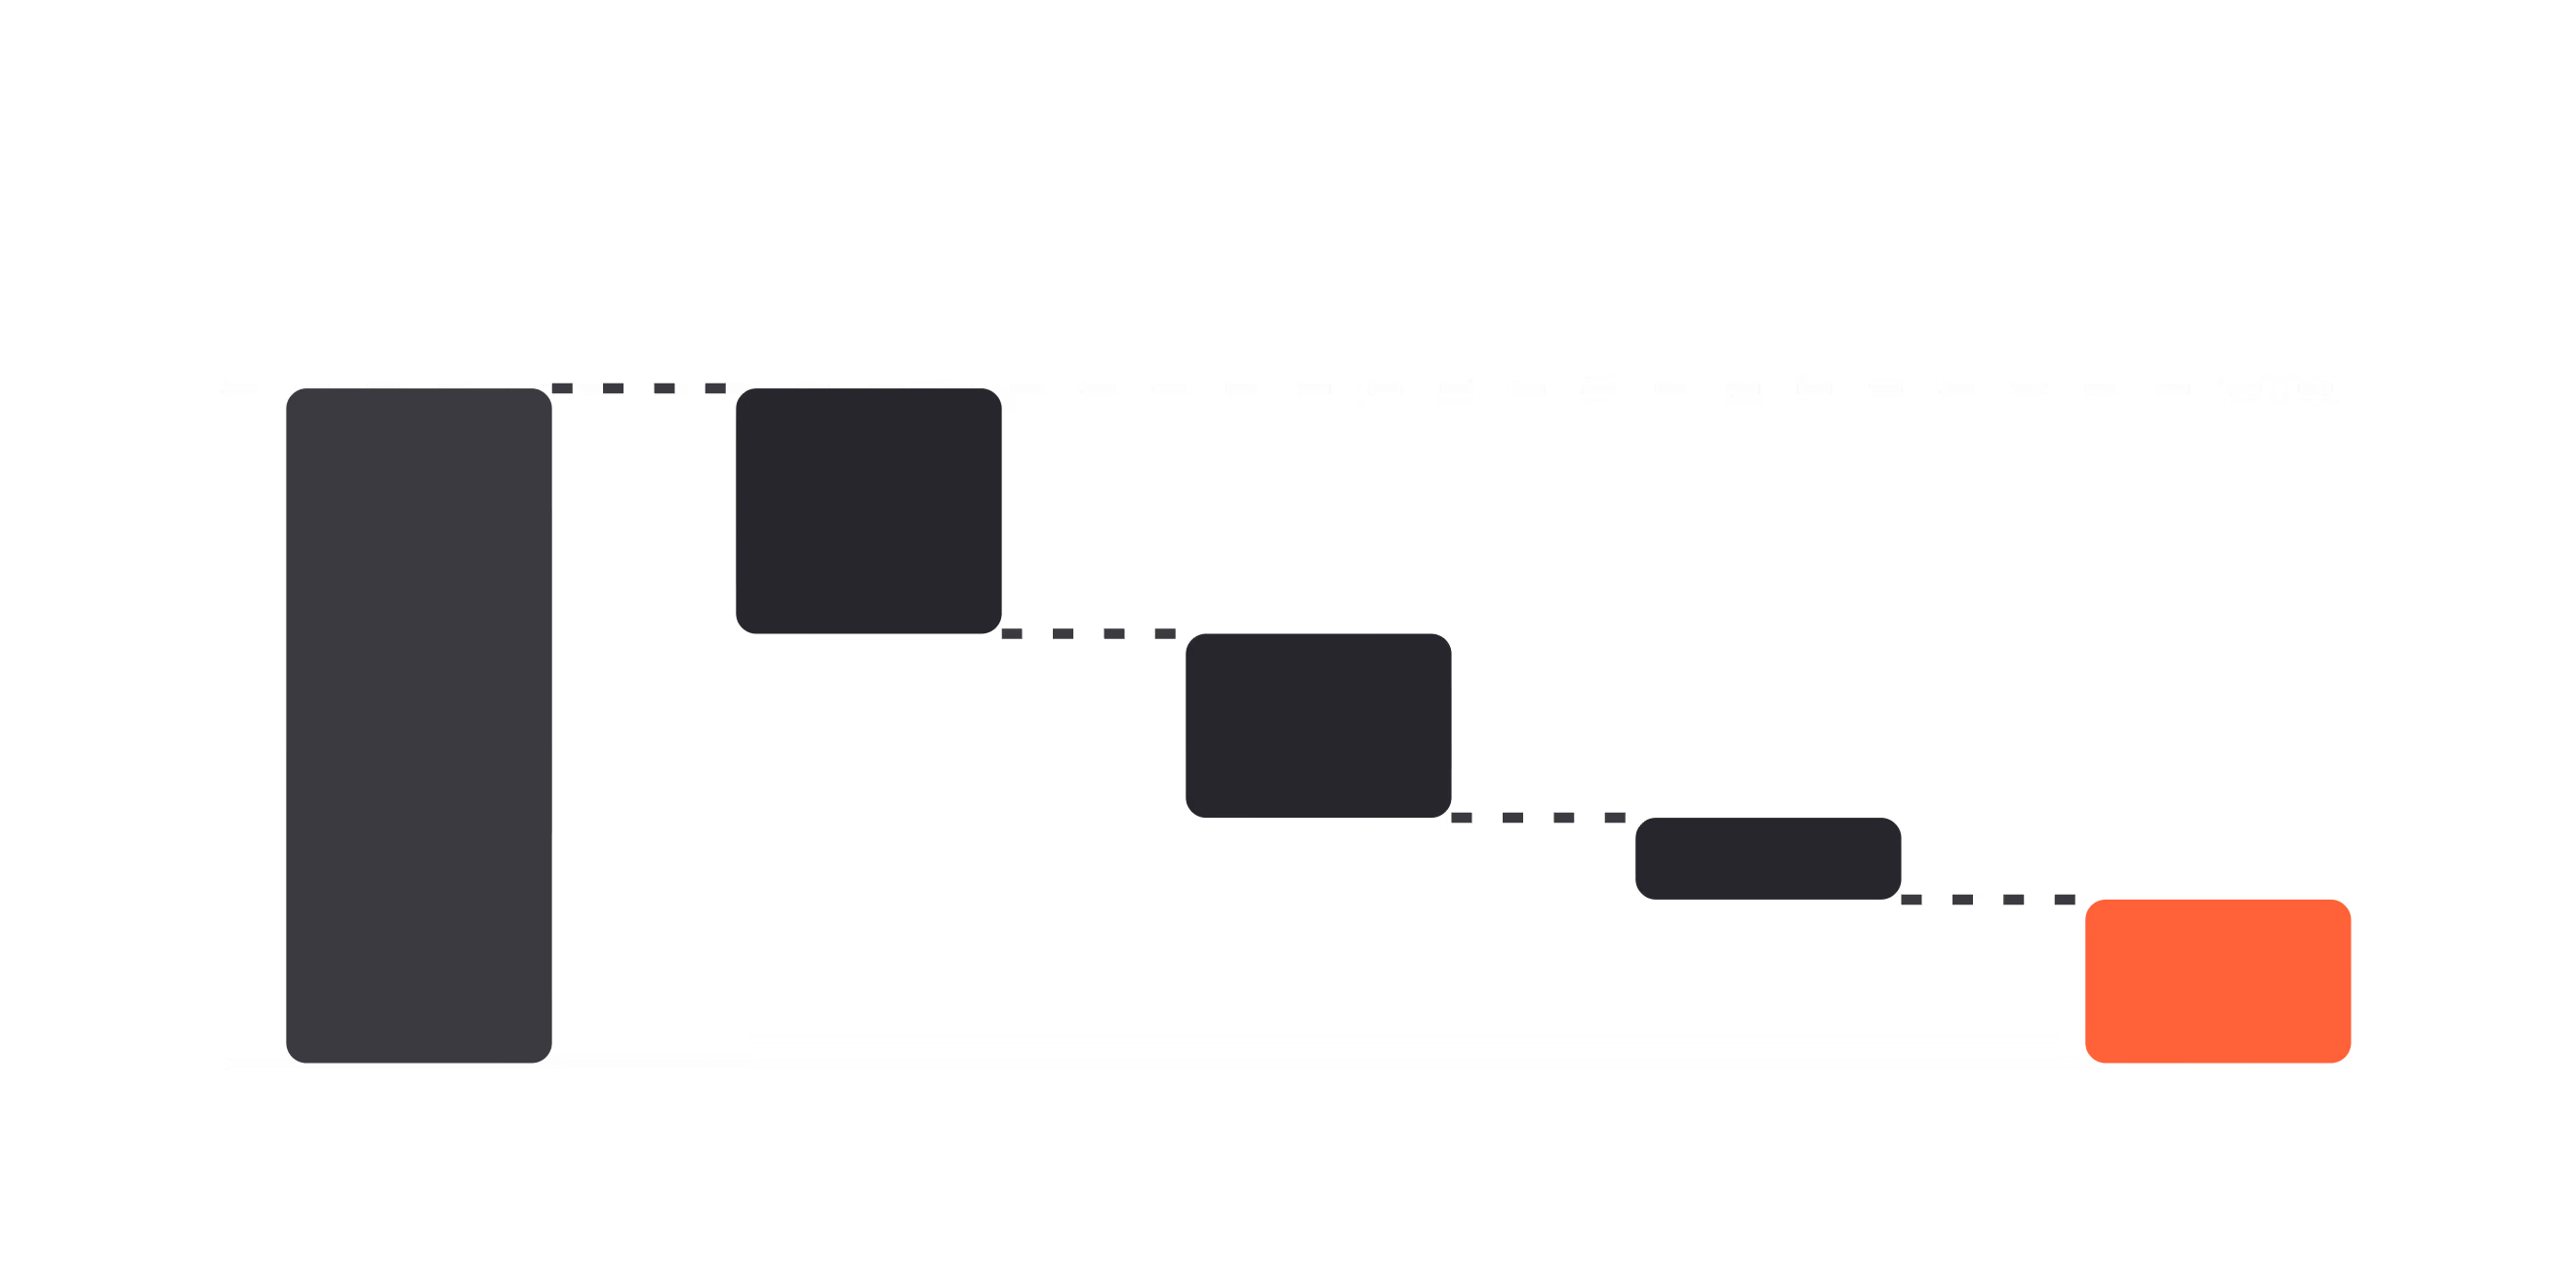
One switch, and every metric turns margin-true. Revenue is for platforms. You steer on profit.
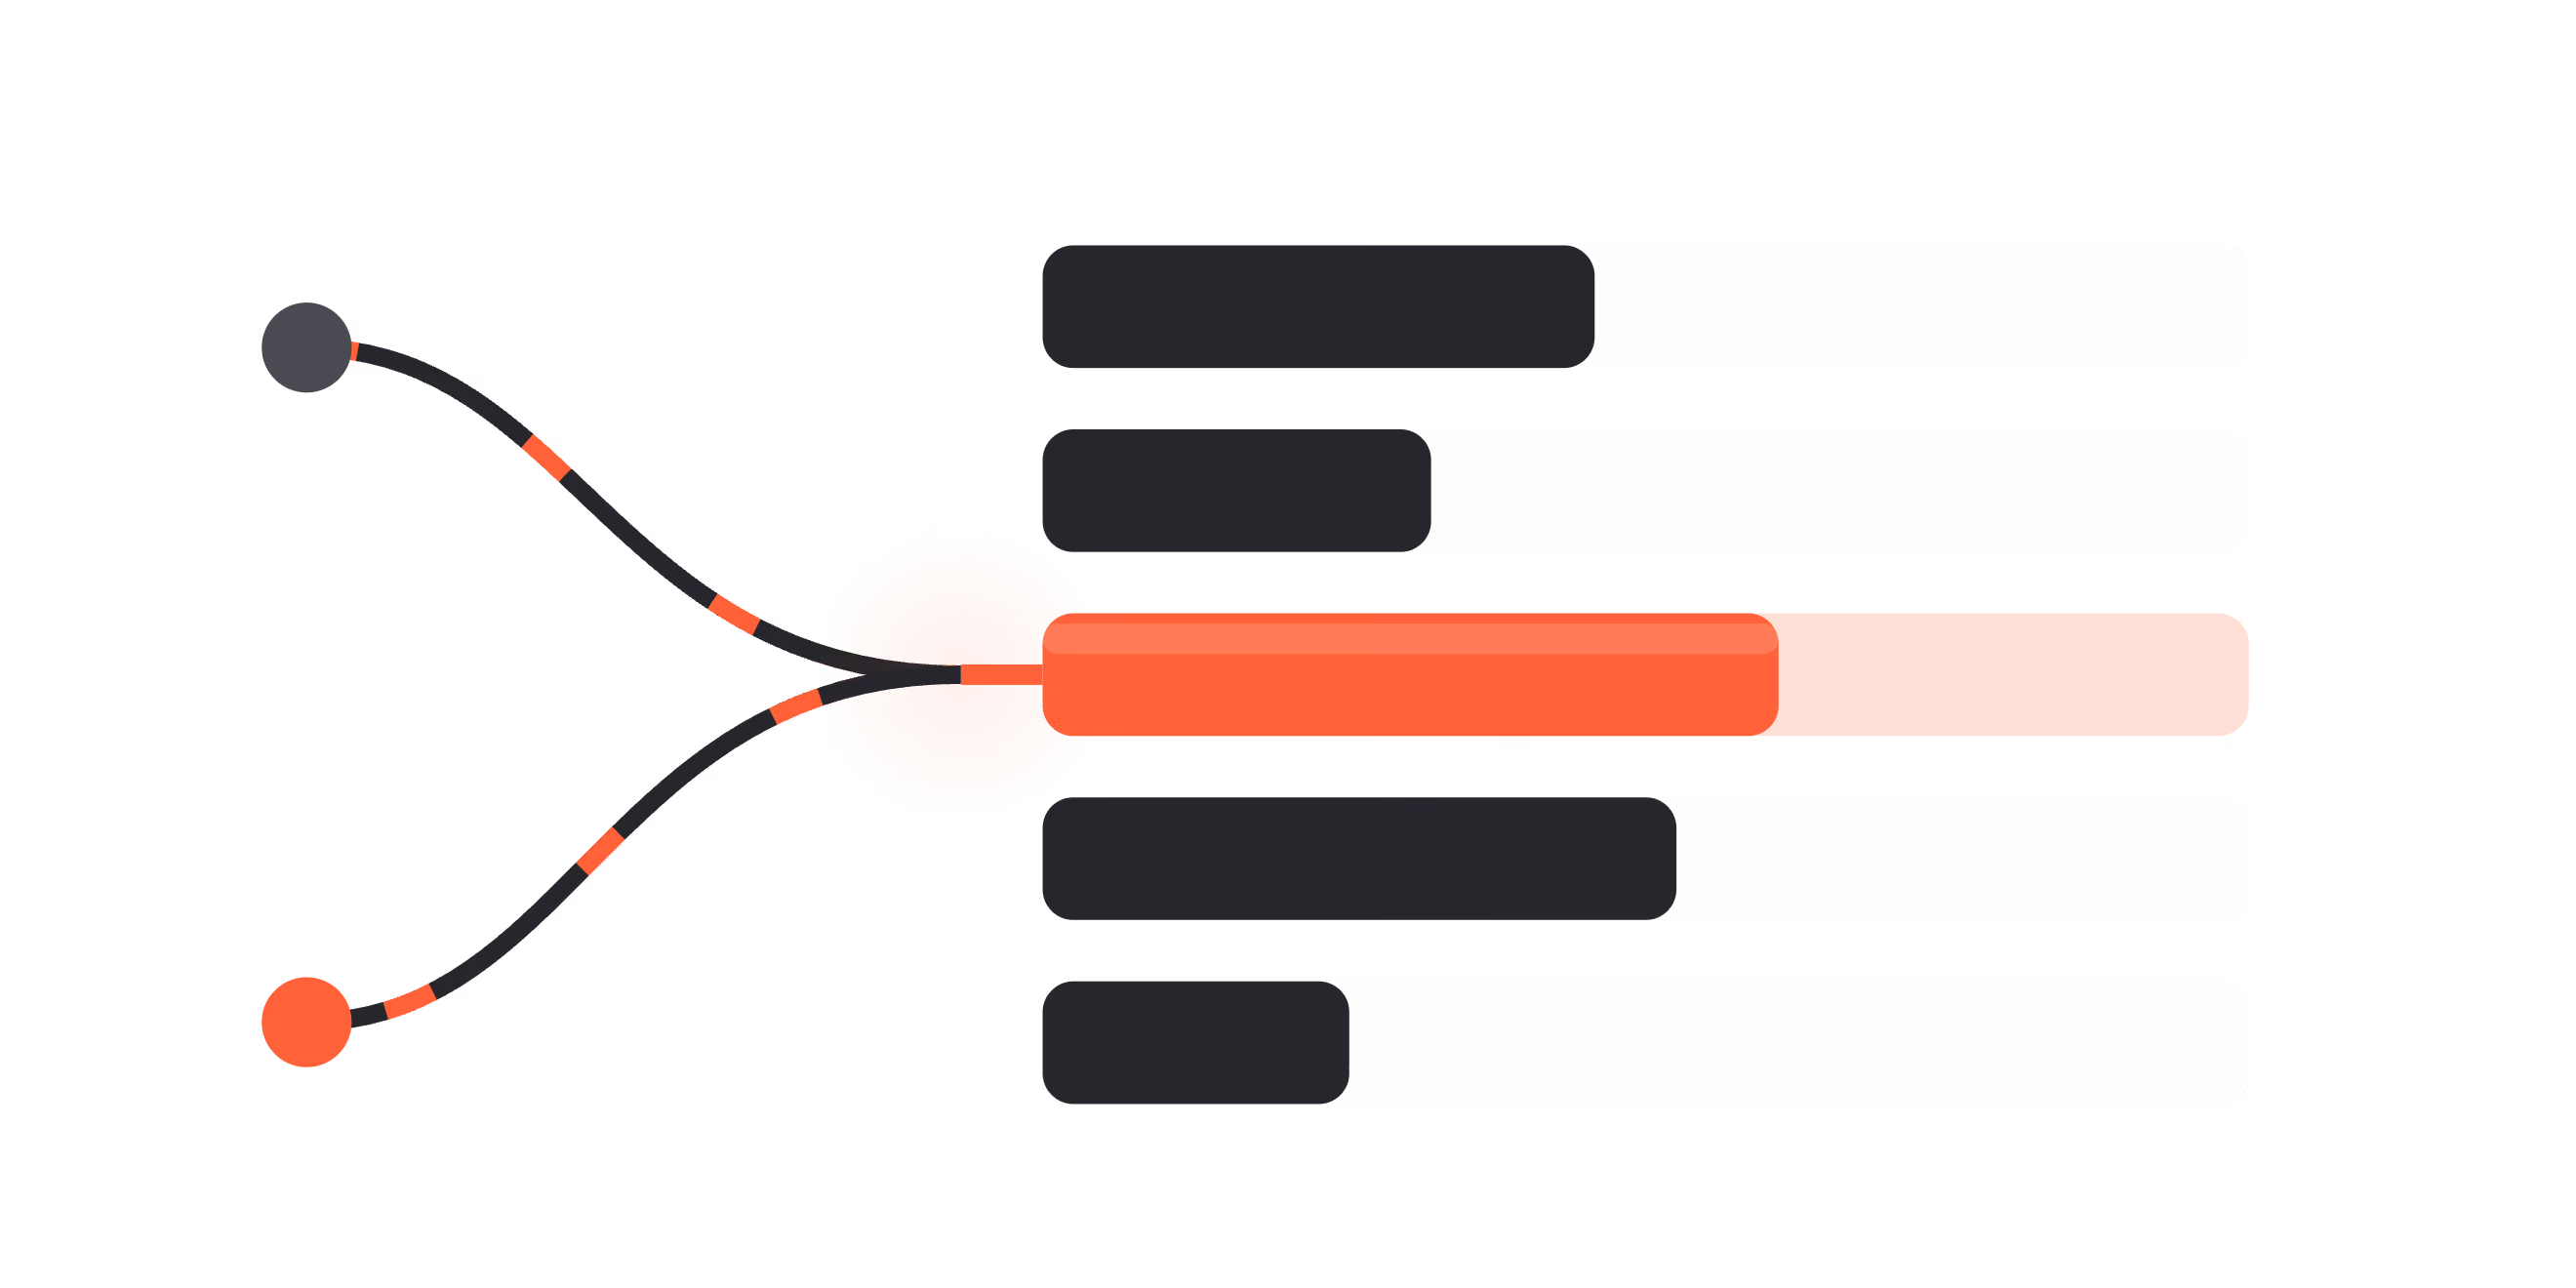
Every view answers questions in Claude, ChatGPT or your agent. The report talks back.
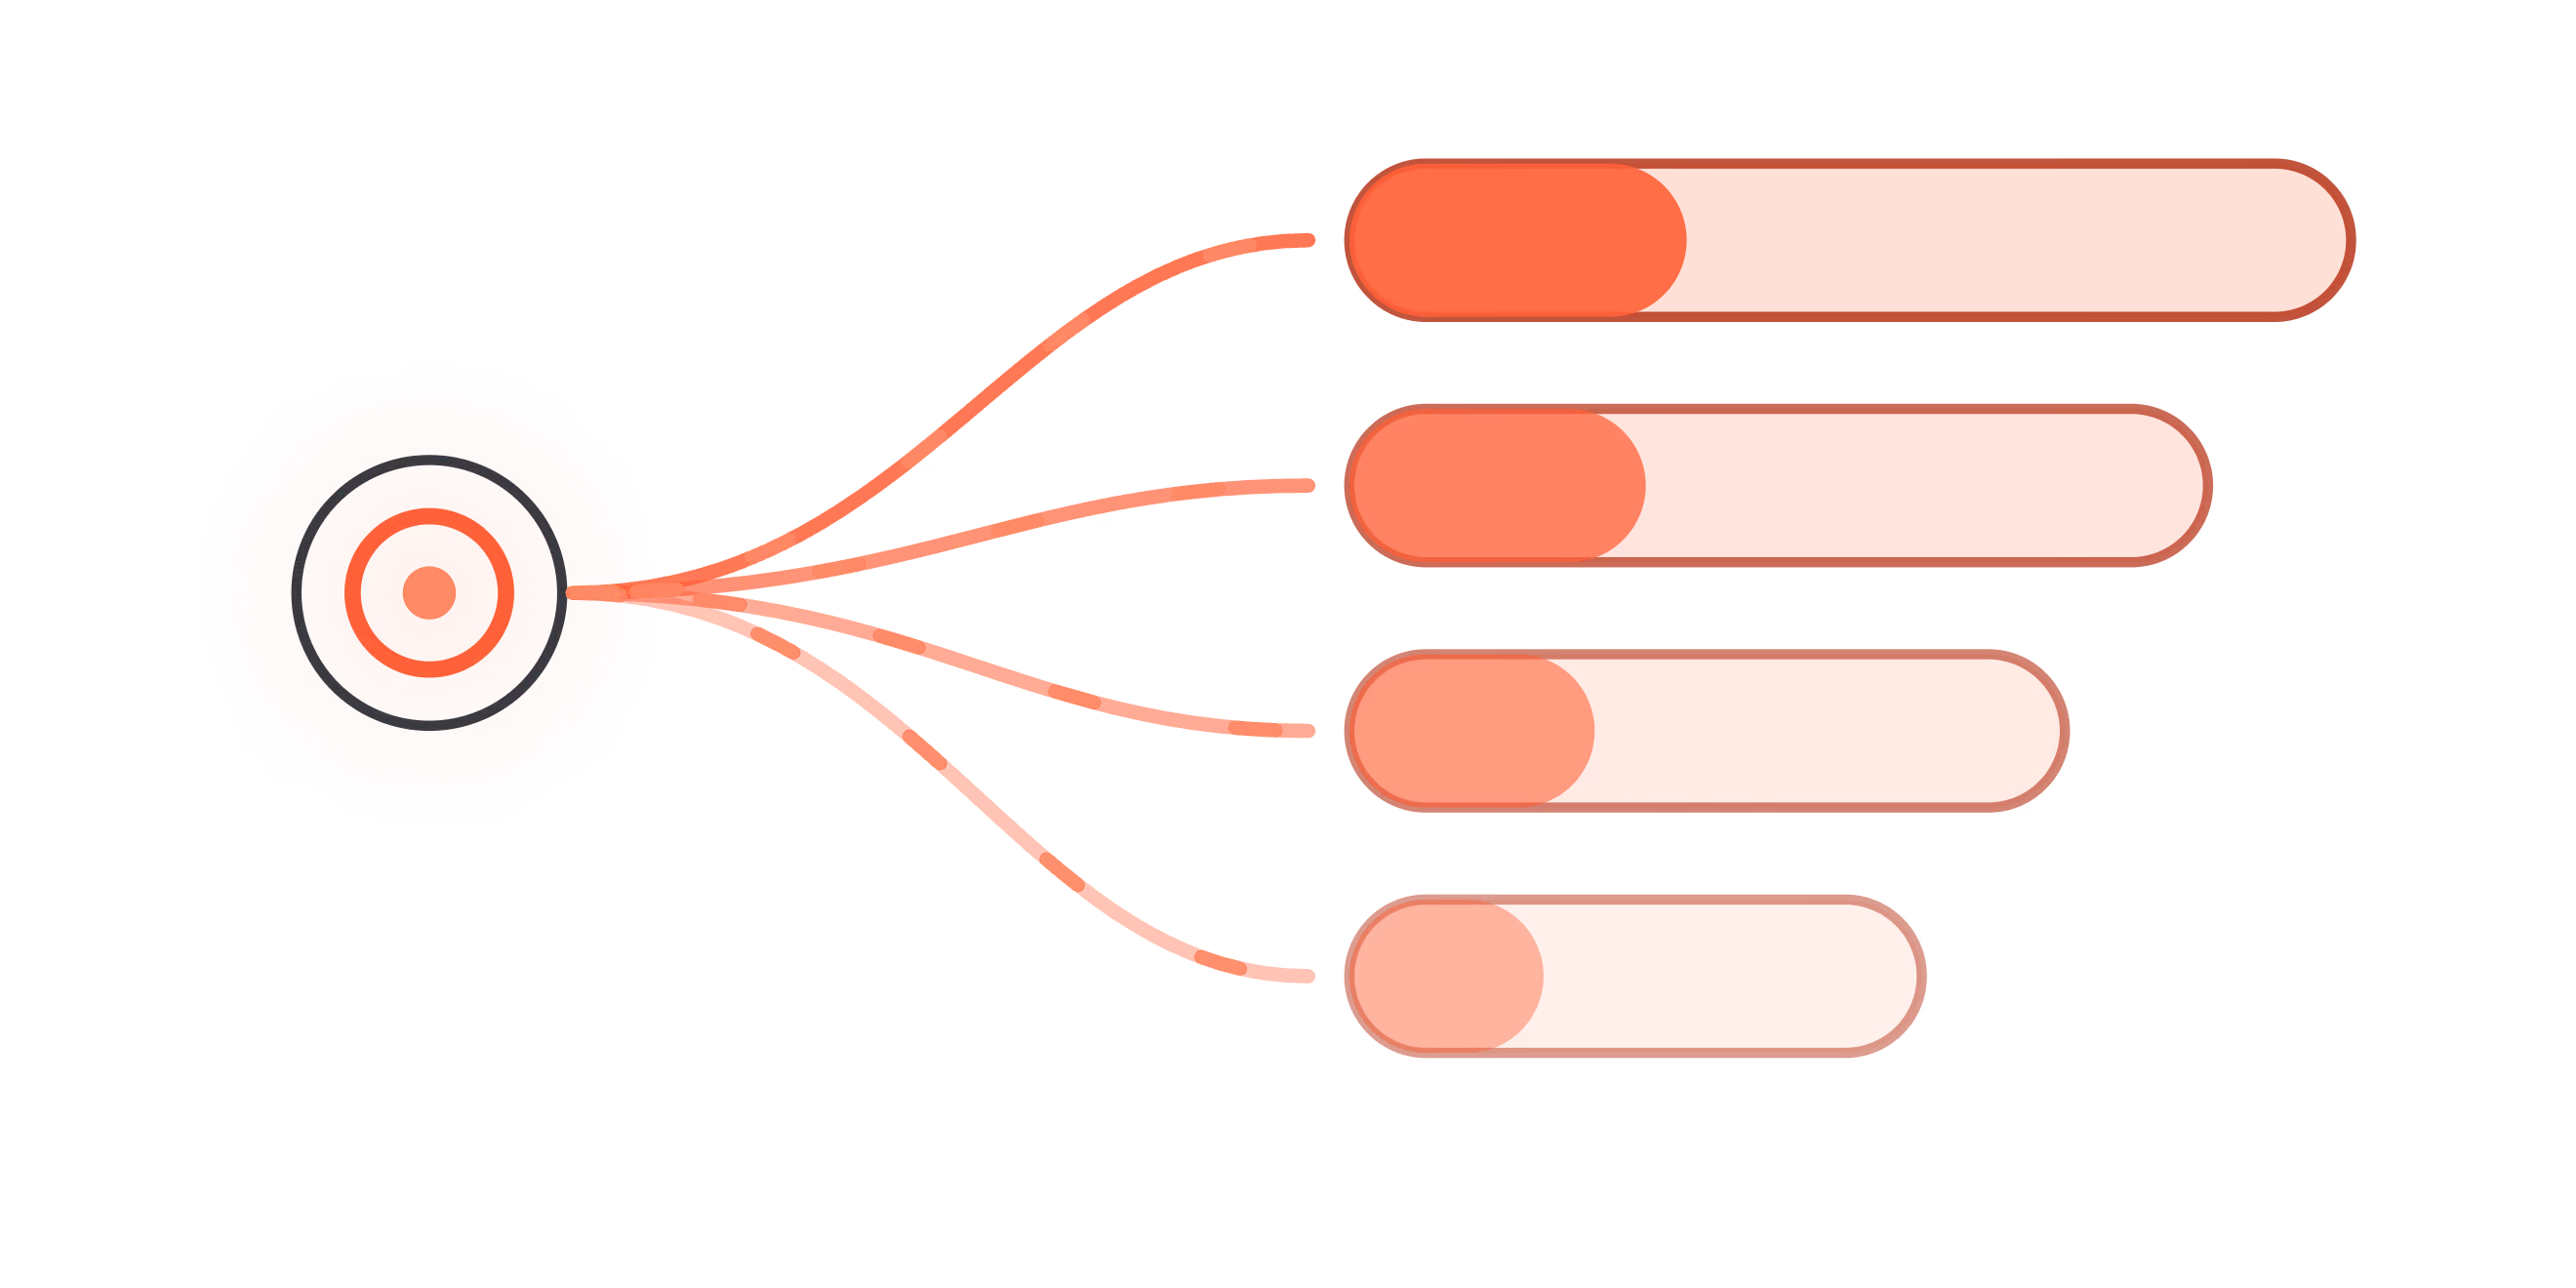
API, warehouse, Sheets, email, Slack. If your company works there, your numbers do too.
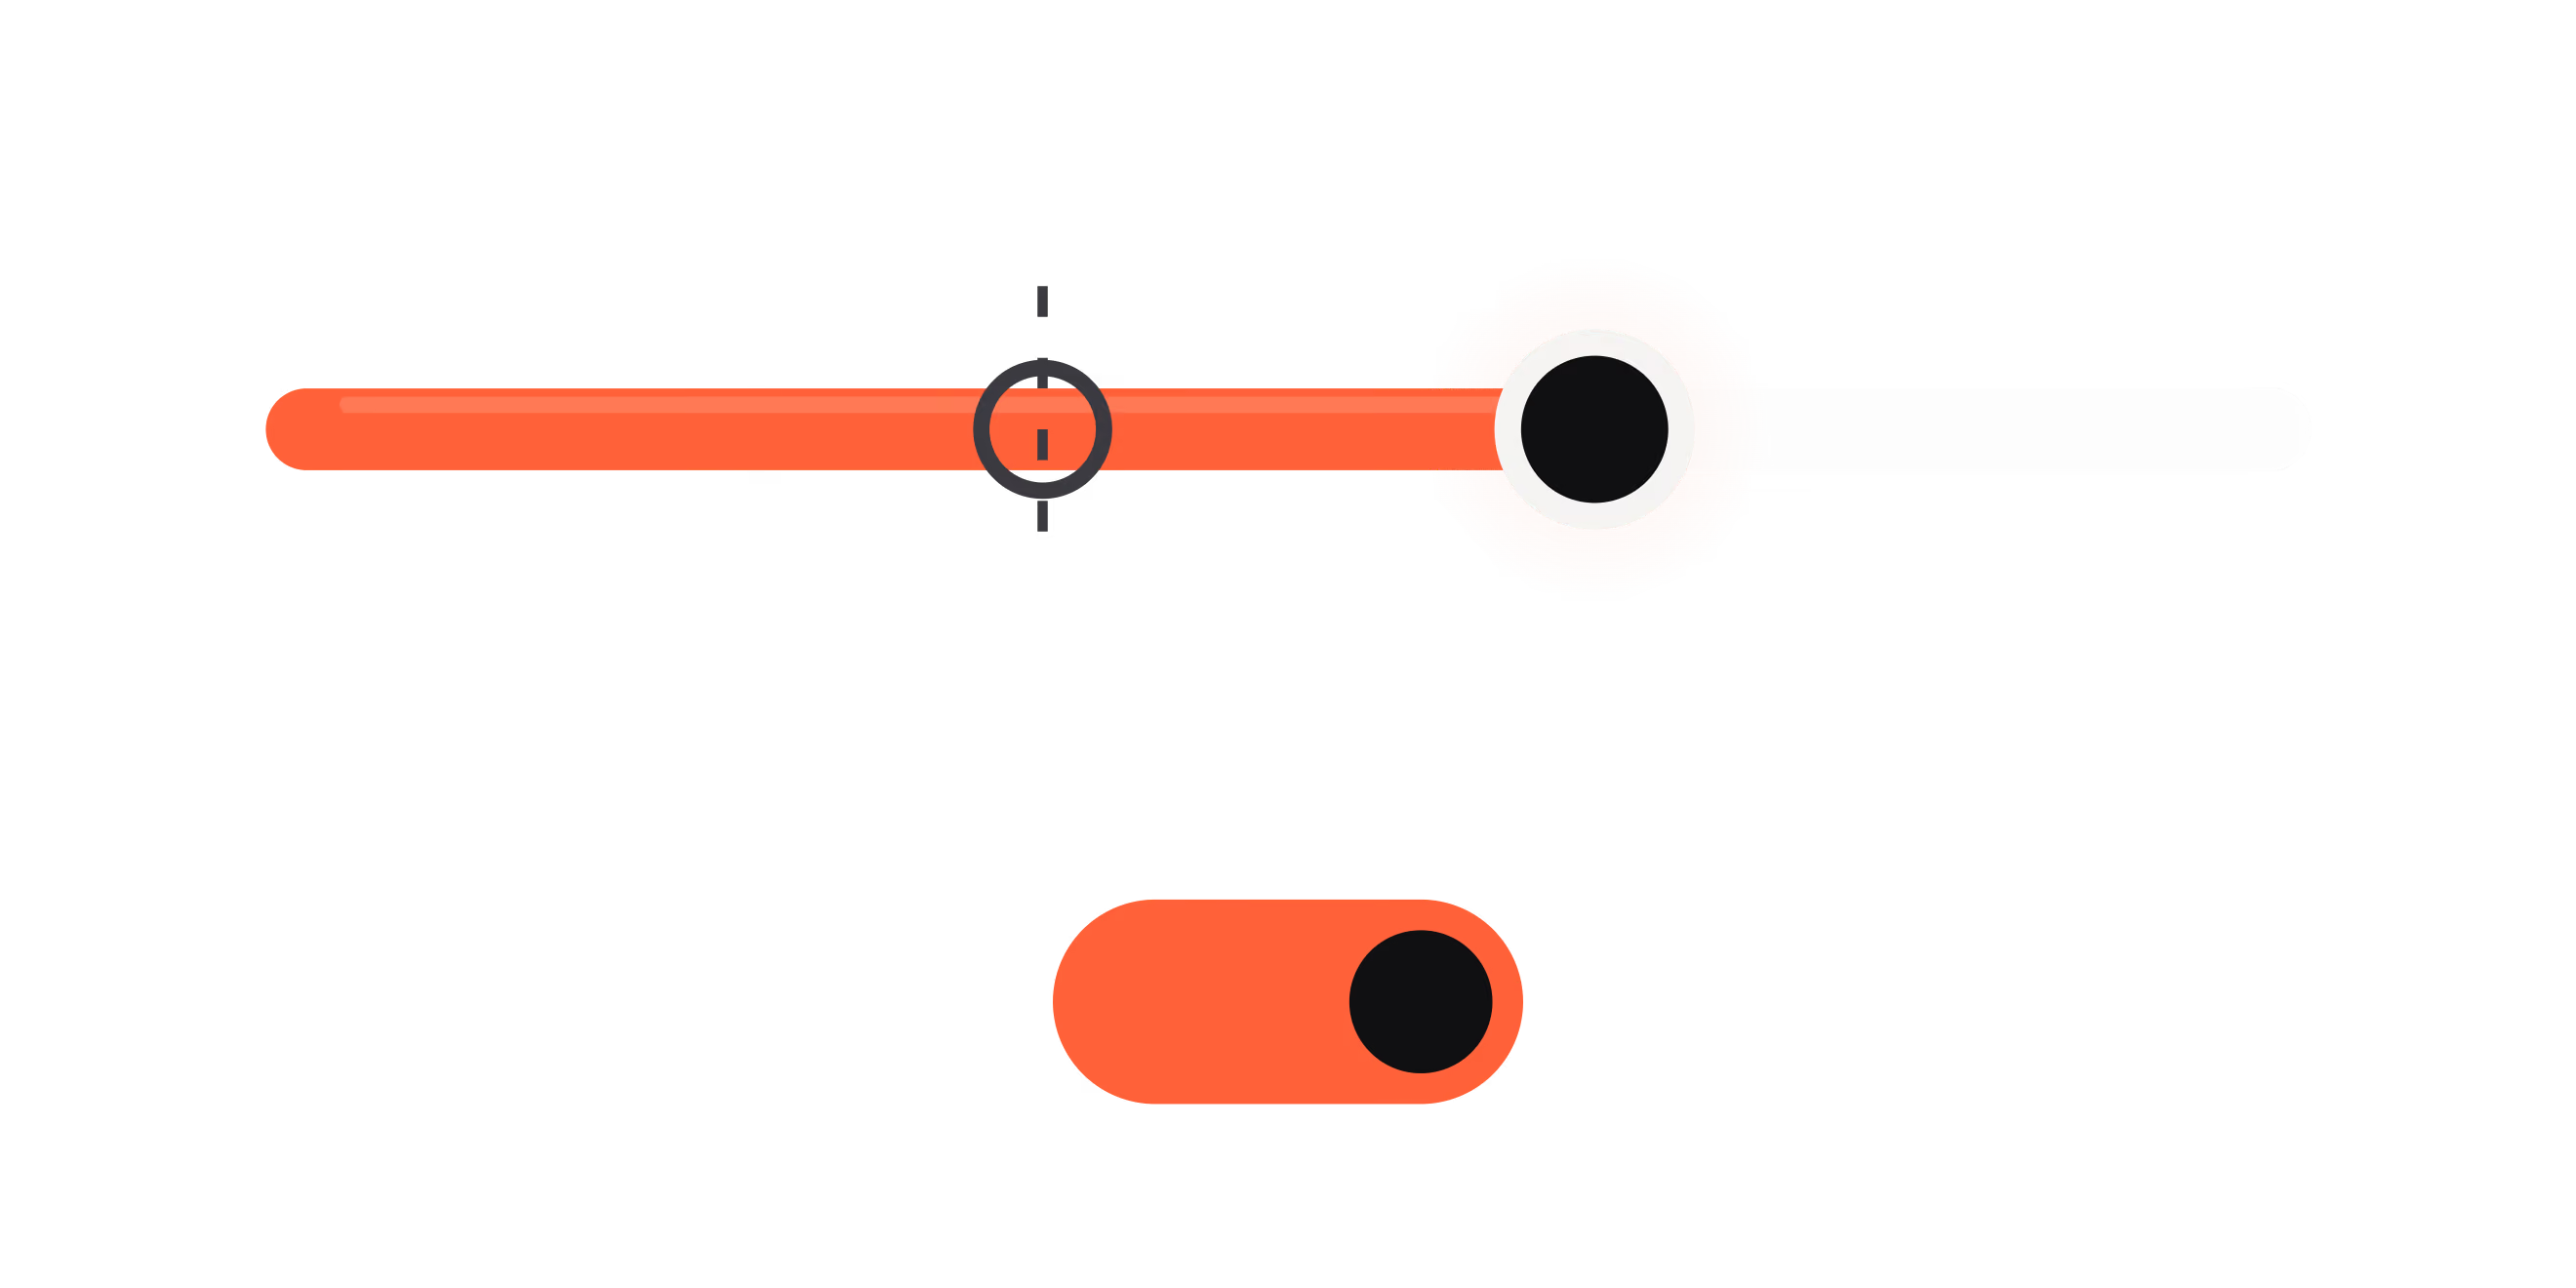
Budgets and switches live inside the view. See it, change it, done.
The prettiest ad is not always the richest.
Every creative ranked by real margin, not just revenue. A high-ROAS creative selling discounted returners loses to the quiet one selling full price.
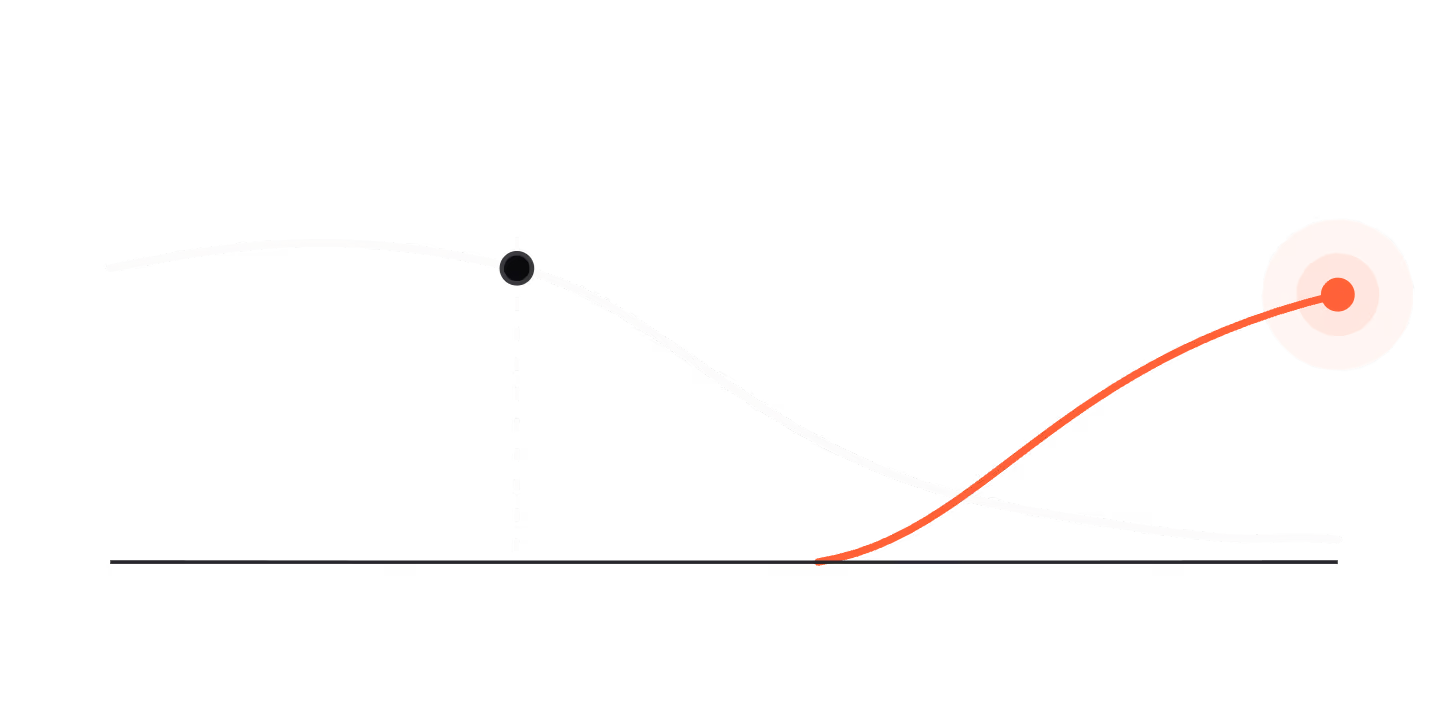
Spot fatigue before the damage.
CTR, CPC and frequency climbing while conversion sinks: the signature of a dying ad. You see it early.
The creative that starts it all.
Some creatives open journeys but never get last-click credit, so they look like losers and get cut. Here they finally get their share. Stop killing your best opener.

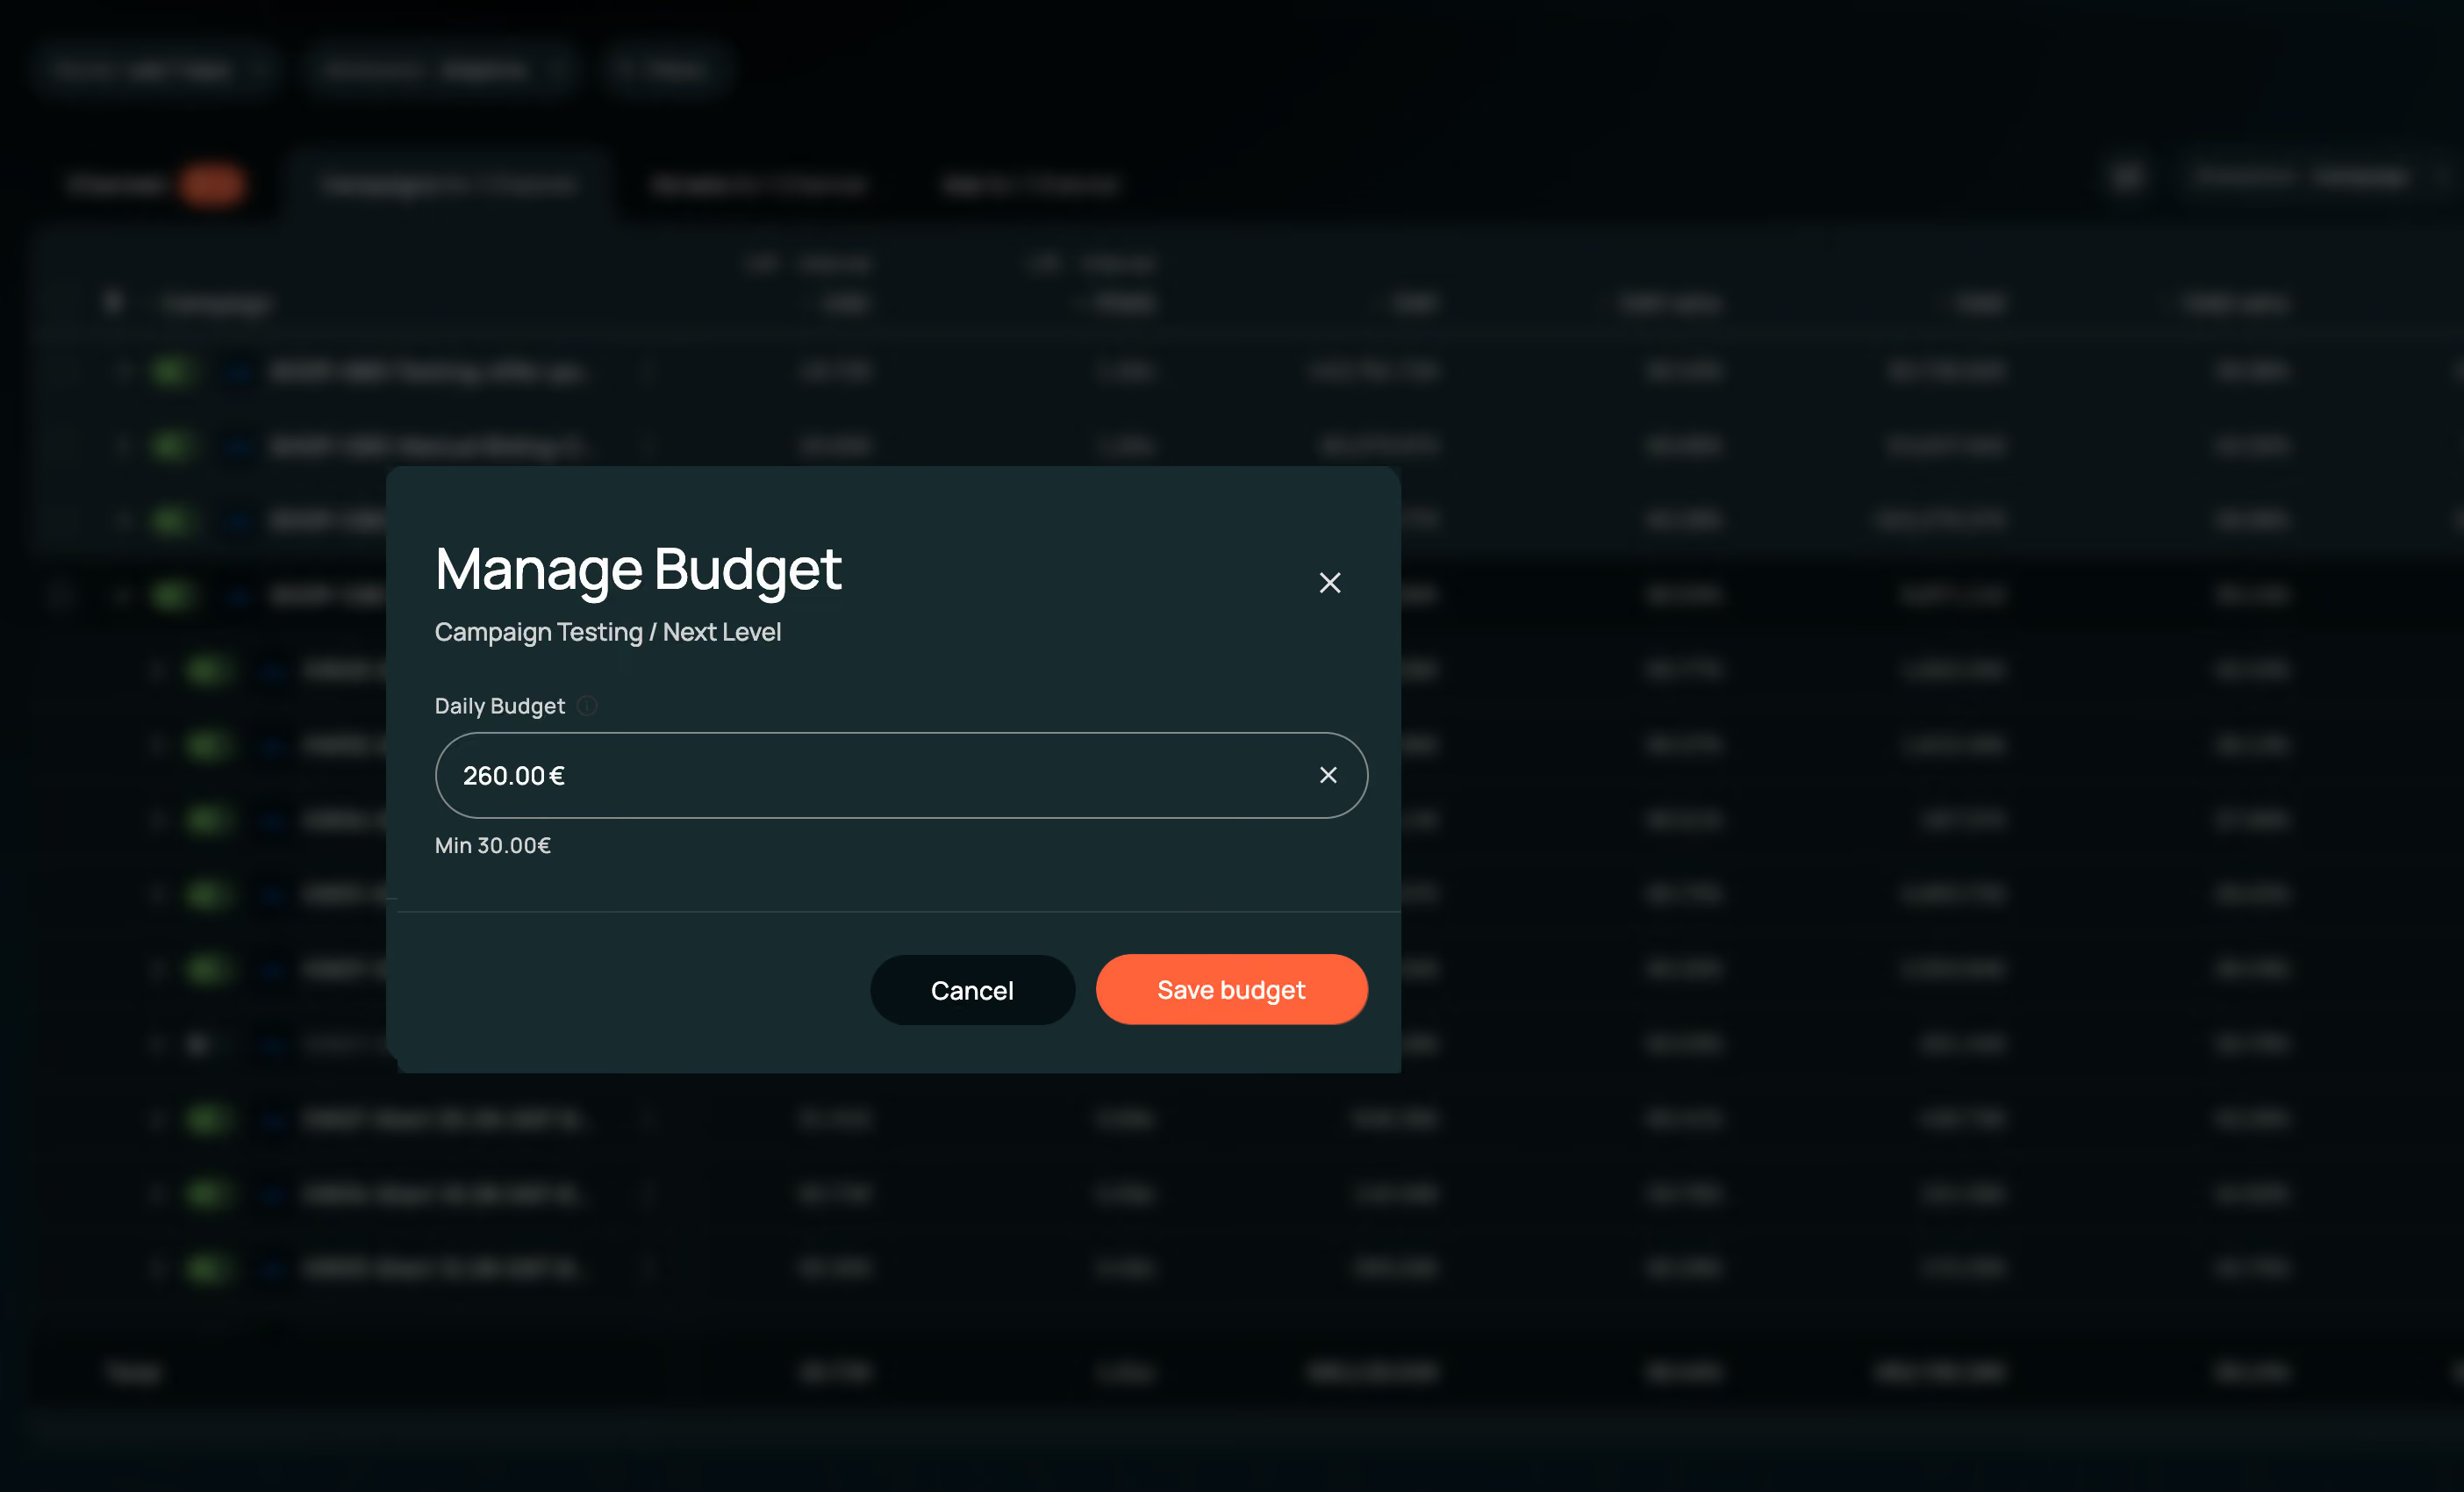
Pause it. Scale it. Right here.
Pause the worn-out, scale the starters, right from this view. And Pilot watches these signals every hour.
We could triple our ROAS and also on TikTok we could scale more efficiently. And most importantly, we can scale based on real, accurate data.



Evidence from 100+ brands.
Real quotes, real numbers. Measured by the brands themselves.
 WATCH
WATCH
 CASE STUDY →
 CASE STUDY →
 CASE STUDY →
 CASE STUDY →
 WATCHCASE STUDY →CASE STUDY →CASE STUDY →CASE STUDY →
 WATCH
WATCH
 CASE STUDY →
 WATCH
WATCH
 CASE STUDY →
 CASE STUDY →
 WATCHCASE STUDY →WATCHCASE STUDY →CASE STUDY →
Spend, CAC, POAS, hook rate and new customer share per creative, on independent attribution.
Yes. One asset, one aggregated verdict, no matter how often it is reused under different names.
Rising frequency against sinking conversion signals wear-out before your CAC feels it.
Yes. Pause the worn-out, scale the starters, right here. And Pilot watches these signals every hour.
One source. One truth.In every tool.
Everything Mission Control does.
One closed loop, open to your entire stack: connect, measure, analyze and allocate from the same governed model.
One open data layer - in and out
Every source in, every system out. The same governed model feeds your reports, your ad platforms, your warehouse and your agents.
Measurement as ground truth
Own tracking, attribution, MMM and experiments in one engine — each calibrating the others, so the number you steer on survives scrutiny.
An answer for every question
Profit, marketing, customer and creative intelligence on the same truth — down to product, cohort and creative level.
Keeping control of the next euro
Budget decisions proposed on measured profit, executed inside your guardrails, every action logged and reversible.