On a single Black Friday, The Quality Group, the company behind ESN and More Nutrition, processes more than 200,000 orders. At that volume, a pricing decision made in October decides whether the biggest week of the year makes money or only makes revenue. The same is true at 2,000 orders. It is just easier to miss.
Here is the problem in one product. It sells for €80 and costs €40 to make, so each sale leaves €40 of gross profit. At 30% off the price falls to €56, but the product still costs €40. Gross profit is now €16. A 30% discount has removed 60% of the gross profit, before shipping, payment fees, returns or a single euro of advertising.
Revenue reports hide that gap. ROAS hides it too, because it divides revenue by spend and never looks at what the revenue cost. The number that shows it is contribution margin: what each order, product or campaign leaves you after every cost that comes with it.
This guide is for founders, performance marketers and finance leads at ecommerce brands who plan budgets and discounts. It covers the definition, the three levels most teams use (CM1, CM2, CM3), how to calculate them, how they change channel rankings, and how to use them to set Black Friday offers that earn. It draws on what we see across more than 100 brands on the Admetrics platform.
Admetrics is a marketing measurement and budget platform for ecommerce and DTC brands. We measure what drove each order independently of the ad platforms, work out the profit left after COGS, shipping, fees and returns, and help brands move budget toward what earns.
Key takeaways
- A discount cuts profit far more than it cuts price. On a product with a 50% gross margin, 30% off removes 60% of the gross profit. At 40% off, the same product needs five times the sales to earn what it did at full price.
- Contribution margin comes in three levels. CM1 subtracts product cost, CM2 adds fulfilment, shipping, payment fees and returns, CM3 adds marketing. Black Friday decisions live at CM2 and CM3.
- Revenue rankings mislead; rank on contribution margin. A campaign at 4x ROAS on a 22% margin loses money, while one at 2.5x on a 48% margin makes it.
- Break-even ROAS is 1 divided by your CM2 margin. Every discount raises it, and in Black Week the cost of reaching customers often rises at the same time.
- Returns, shipping and payment fees decide CM2. They grow with every order, and returns arrive after the reports have been sent.
- Separate new from returning customers. At ESN and More Nutrition, splitting the two in every budget decision was the largest single lever, and cost per new customer fell 70%.
- Pick offers by how they hit margin, not by how loud they are. Thresholds, bundles and value adds protect CM2; straight price cuts give it away on every unit.
What is contribution margin?
Contribution margin is the money a sale contributes to your fixed costs and profit after you subtract every cost that rises with that sale.
Contribution margin = net revenue − variable costs
The distinction that matters is fixed versus variable. Rent, salaries and software subscriptions stay the same whether you ship 100 orders or 10,000. Product cost, packaging, shipping, payment fees, returns and the ad spend that won the order all grow with volume. Contribution margin keeps the second group and leaves out the first.
You can express it in euros ("this order contributed €23") or as a ratio of net revenue ("this order contributed 29%"). The ratio is called the contribution margin ratio, and it is the figure to compare across products, channels and discounts.
Contribution margin vs gross margin vs net profit
The three are often confused because each is "a margin". They answer different questions.
For pricing, promotion and budget decisions, contribution margin is the right level. Gross margin is too optimistic, and net profit arrives too late and too blended to tell you which campaign to cut.
CM1, CM2 and CM3: where each cost belongs
Most ecommerce teams split contribution margin into three levels. Each subtracts another layer of variable cost, so you can see where margin disappears: in the product, in getting it to the customer, or in winning the customer.
Some teams add a CM4 that subtracts fixed costs allocated to a product line or channel, such as a dedicated warehouse or a channel team. It is useful for reviewing a whole business unit, but too slow-moving to decide on a campaign.
Net revenue: start from what you actually keep
All three levels start from net revenue: the price paid, minus VAT, minus discounts and vouchers. If you calculate from list price or include VAT, every margin downstream is overstated. A €100 order in Germany is €84.03 of net revenue before any discount.
Common mistakes
- Using gross margin as CM2. Shipping, payment fees and returns can be a large share of the order on low-AOV products, so skipping them makes cheap products look profitable.
- Treating returns as an afterthought. A returned order still paid for shipping, often twice, plus handling. Book an expected return cost per order, by product or category, and correct it when actual returns arrive.
- Counting marketing twice or not at all. A discount code paid for by marketing belongs in CM3, or in net revenue, but not in both.
- Allocating fixed costs too early. Spreading salaries across orders makes every extra order look less valuable than it is. Keep fixed costs out until CM4.
- Averaging across the catalogue. A blended CM2 hides the products that lose money on every order. Calculate per product, or at least per category.
How to calculate contribution margin
Step by step, for one order
- Net revenue: price paid, minus VAT, minus discounts.
- CM1: net revenue minus the cost of the products in the order.
- CM2: CM1 minus pick and pack, packaging, shipping, payment fees and the expected cost of returns.
- CM3: CM2 minus the marketing cost of winning the order.
- Ratio: divide each level by net revenue to compare across orders and products.
An example order: €100 paid in Germany, product cost €32, fulfilment and packaging €4, shipping €5, payment fees 2% of the gross price, an expected return cost of €3, and €20 of ad spend per order.
The order looks like a 62% margin product. After it reaches the customer it keeps 45%, and after paying to win it, 21%.

Per product, per campaign, per channel
The same logic scales up. Per product, sum CM2 across all orders of that product, then divide by units. Per campaign, sum CM2 across the orders the campaign drove and subtract the campaign's spend. That figure, CM3 by campaign, is the one to rank campaigns on. It depends on attribution: which orders you assign to which campaign. Our marketing attribution guide covers how to do that without the double counting built into platform reports.
Break-even: how much can you pay for an order?
CM2 is the most you can spend to acquire an order and still break even. In the example, that is €38.03. Two numbers follow from it:
- Break-even CPA = CM2 per order. Pay more per order and every sale loses money.
- Break-even ROAS = net revenue ÷ CM2 = 1 ÷ CM2 ratio. Here 1 ÷ 0.45 = 2.2. Below a ROAS of 2.2 on net revenue, the campaign loses money on every order it drives.
Platform ROAS is usually reported on gross revenue including VAT. If you compare it with a break-even ROAS on net revenue, convert first, or the platform number will look better than it is.
Contribution margin vs ROAS: why revenue rankings mislead
ROAS divides revenue by ad spend. It says nothing about what the revenue cost to produce, ship and keep. Two campaigns can share the same ROAS while one sells a high-margin bestseller at full price and the other sells a discounted, bulky, frequently returned item. Only one of them is worth funding.
The ranking flip
Three campaigns, each with €10,000 of spend in a month. The figures are illustrative; the pattern is one we see in onboarding when brands first add product costs.
Ranked by ROAS, the order is A, C, B, and a team would scale A. Ranked by contribution margin, it is B, C, A, and A is the only campaign losing money. Nothing about the campaigns changed; only the number used to judge them.

POAS: profit on ad spend
POAS puts the same idea in one figure:
POAS = CM2 ÷ ad spend
Above 1.0, every euro of ad spend returns more than a euro of contribution margin, so the campaign makes money. Below 1.0, it loses money however good the ROAS looks. Some teams calculate POAS on gross profit (CM1) instead of CM2; that is simpler but flatters products with high shipping and return costs.

Admetrics shows contribution margin and POAS beside revenue for every channel, campaign and product, so a ROAS ranking and a profit ranking sit side by side. See Profit Intelligence.
What a Black Friday discount does to contribution margin
A discount lowers the price. It does not lower the product cost, the shipping label or the payment fee. That is why the margin falls much faster than the price.
Worked example: one order at 0, 20, 30 and 40% off
The product from the introduction: €80 net price, €40 product cost. Add €7 for fulfilment and shipping, payment fees of 2.5% of the price, and €15 of ad spend per order. Illustrative numbers; use your own in the calculator below.
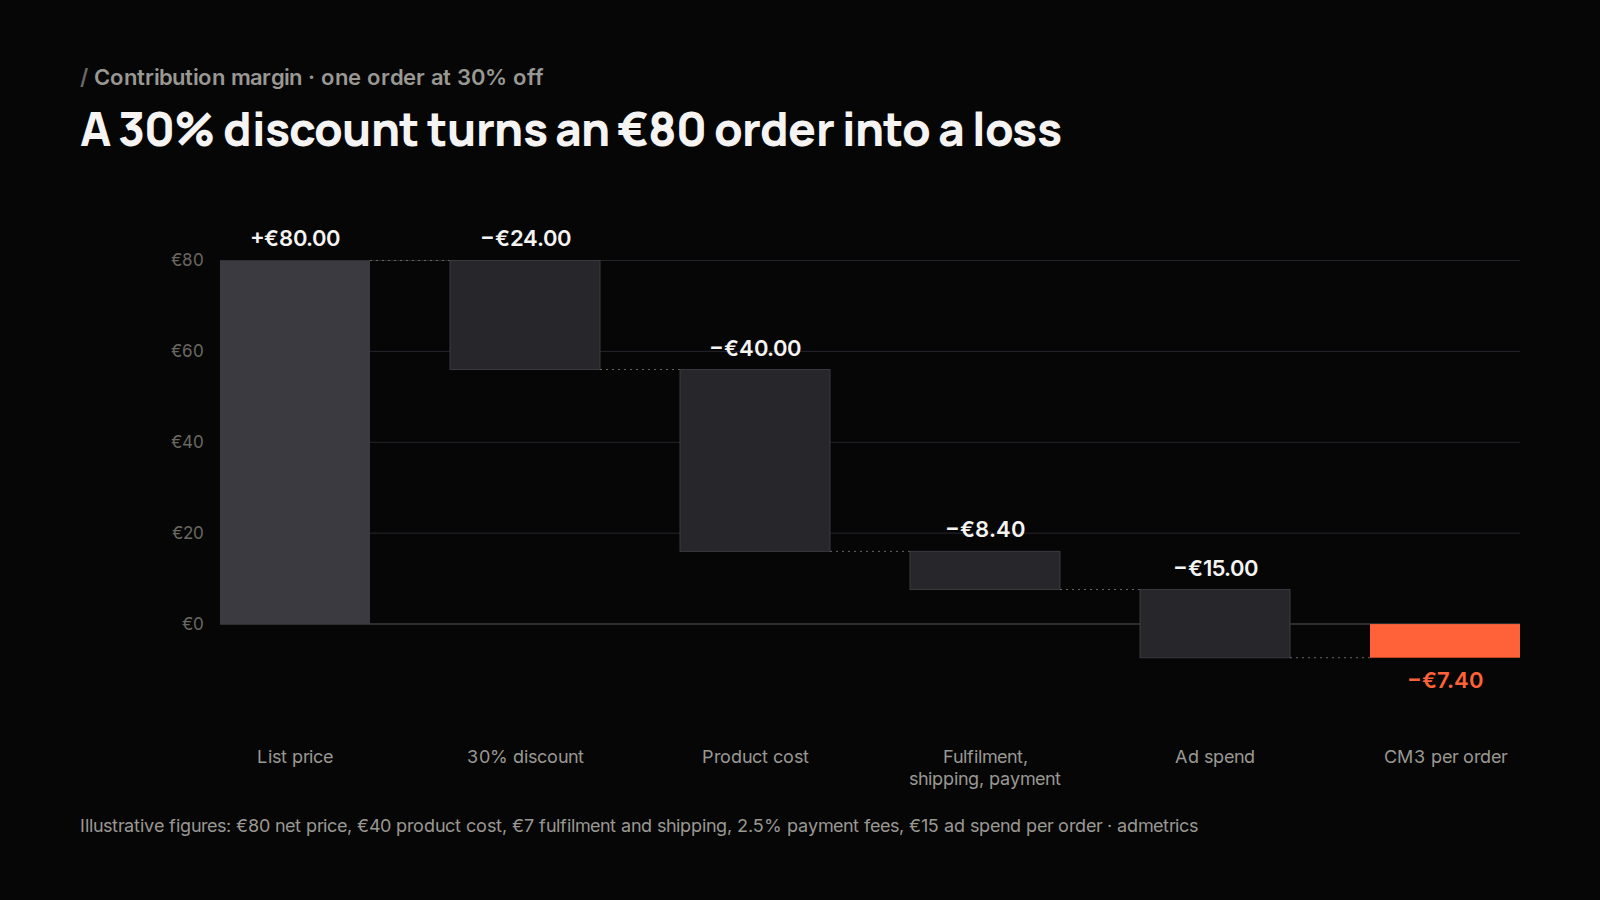
- At 20% off, each order earns 40 times less than at full price. You would need 40 discounted orders to match one full-price order.
- At 30% off, every order loses money unless ads get cheaper, and in Black Week ads often get more expensive.
- At 40% off, the order loses money before marketing. CM2 is negative, so no ROAS can fix it.
How many more orders does a discount need?
To earn the same CM1 at a discount as at full price, sales volume has to rise by:
Required increase = gross margin ÷ (gross margin − discount) − 1
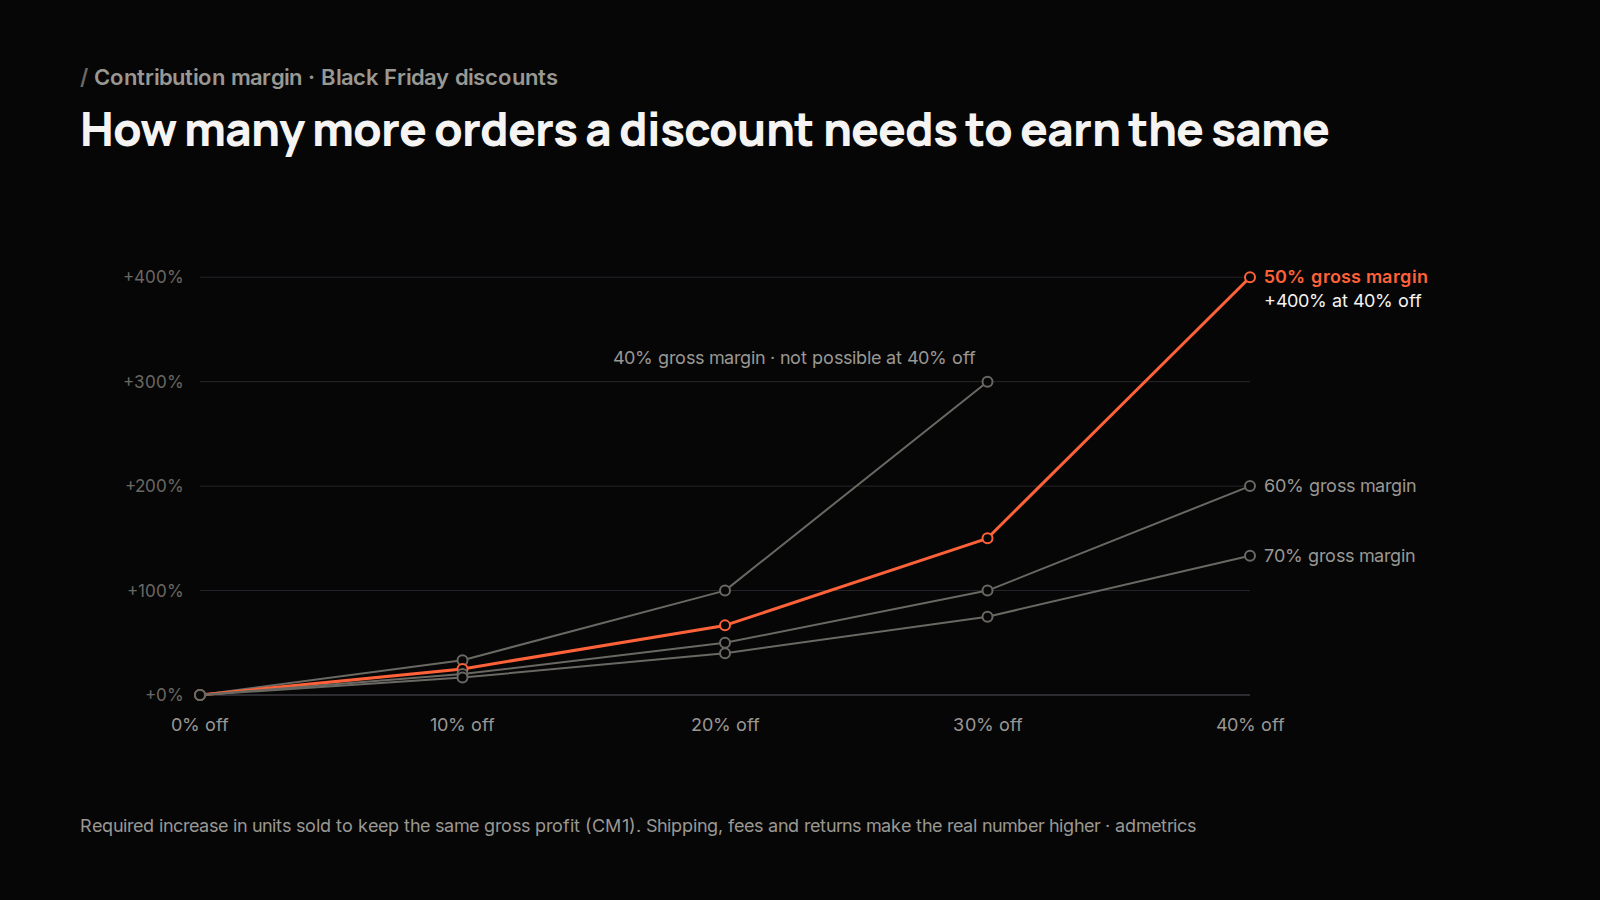
This table is the optimistic version: it only accounts for product cost. Shipping, payment fees and returns per order do not shrink with the discount, so the real required increase at CM2 is higher. A product with a 50% gross margin needs two and a half times its normal sales at 30% off just to stand still.
Three rules for setting Black Friday discounts
1. Set a floor per product. Calculate CM2 at the planned discount. If it is lower than what you expect to pay per order in ads during Black Week, the discount loses money on every sale. Lower the discount, or protect the order value with a threshold or a bundle.
2. Discount deep where the margin is deep. Casper, the US mattress brand, uses tiered Black Friday discounts: the biggest cuts on high-margin products, smaller ones elsewhere. The headline offer stays strong while the average margin holds. Sort your catalogue by CM2 before choosing what goes on sale.
3. Pay with value, not only with price. A gift, faster delivery or early access has a fixed cost you know in advance. A percentage discount grows with every euro the customer spends.
20 Black Friday offers, grouped by margin impact
The 20 offer types below come from our BFCM playbook, grouped from the most to the least margin-hungry.
Set any threshold just above your current average order value, so the discount pays for a bigger basket rather than for an order the customer would have placed anyway. Our AOV calculator helps find that point.
Returns, shipping and payment fees: the CM2 costs that grow in Black Week
CM1 is set when you choose the discount. CM2 is decided in the days and weeks after, by what it costs to deliver the order and whether it stays delivered. These are the lines to plan before Black Friday, not after.
Returns make Black Week profit a moving number
The first profit number you see for Black Week is the best it will ever be. Returns from discounted and gift orders arrive over the following weeks, and each one reverses revenue, adds shipping and handling, and sometimes writes off the product.
Two habits keep the picture honest. Report Black Week contribution margin twice: once in the first week of December with expected returns, and again in mid-January with actual returns. And break return rates down by channel and creative: some campaigns win customers who keep what they buy, others win customers who send it back.
New customers, lifetime value and marketplaces
Contribution margin per order is the start. Three ecommerce realities decide whether a Black Week order is worth winning at all.
New vs returning customers
A discount given to an existing customer often buys an order they would have placed anyway, at a lower margin. A discount that wins a new customer can be worth a negative CM3 on the first order, if that customer comes back.
That is why blended CAC misleads. It mixes the cheap reorders that retargeting and email collect with the expensive first orders that prospecting creates. NC-CAC, the cost to acquire a genuinely new customer, separates the two. At ESN and More Nutrition, splitting new from existing customers in every budget decision was the largest single lever, and cost per new customer fell 70%.
For Black Week, set two targets instead of one: a minimum CM3 for orders from existing customers, and a maximum NC-CAC for new ones.
Lifetime value: when a negative first order is fine
A campaign with a worse first-order margin can still be the better investment if its customers reorder. Tales & Tails, a subscription-led pet food brand, deliberately keeps some campaigns with weaker first-order ROAS live because they produce subscribers later.
The test is simple: does expected contribution margin over the customer's lifetime, minus NC-CAC, stay positive? If it does, a Black Friday first order at break-even or a small loss can be the right call. If your customers rarely return, every Black Friday order has to pay for itself.
Marketplaces
Many brands sell a large share through Amazon: Naturtreu runs roughly 50/50 between Amazon and its own shop. Marketplace fees change CM2, so the same product can earn on the shop and lose on Amazon at the same discount. Store reports also cannot see marketplace orders, so a campaign that drives Amazon sales looks weaker than it is, and a "new" shop customer may already buy from you on Amazon. Matching customers across both is how Naturtreu judges whether a new customer really is new.
Admetrics separates new and returning customers in every report, and Cross Matching links customers across your shop and marketplaces so one buyer is never counted as new twice. See Customer Intelligence.
Using contribution margin before, during and after Black Week
Contribution margin is most useful as a working number, checked at the moments when decisions are still open.
The brands that come out of Black Week with more profit, not just more revenue, are the ones that change budgets during the week rather than reading a report after it. NATURTREU more than doubled its BFCM budget (+122%) and still raised ROAS by 23%, using marketing mix modeling and cross-matching of Amazon and shop customers to decide where the extra budget went.
"If you want a clear overview of your numbers, and with it a clear basis for marketing budget decisions, there is no way around Admetrics. It pays for itself from the very first month." Sven Gündner, Founder, Olivenzauber
Contribution margin calculator
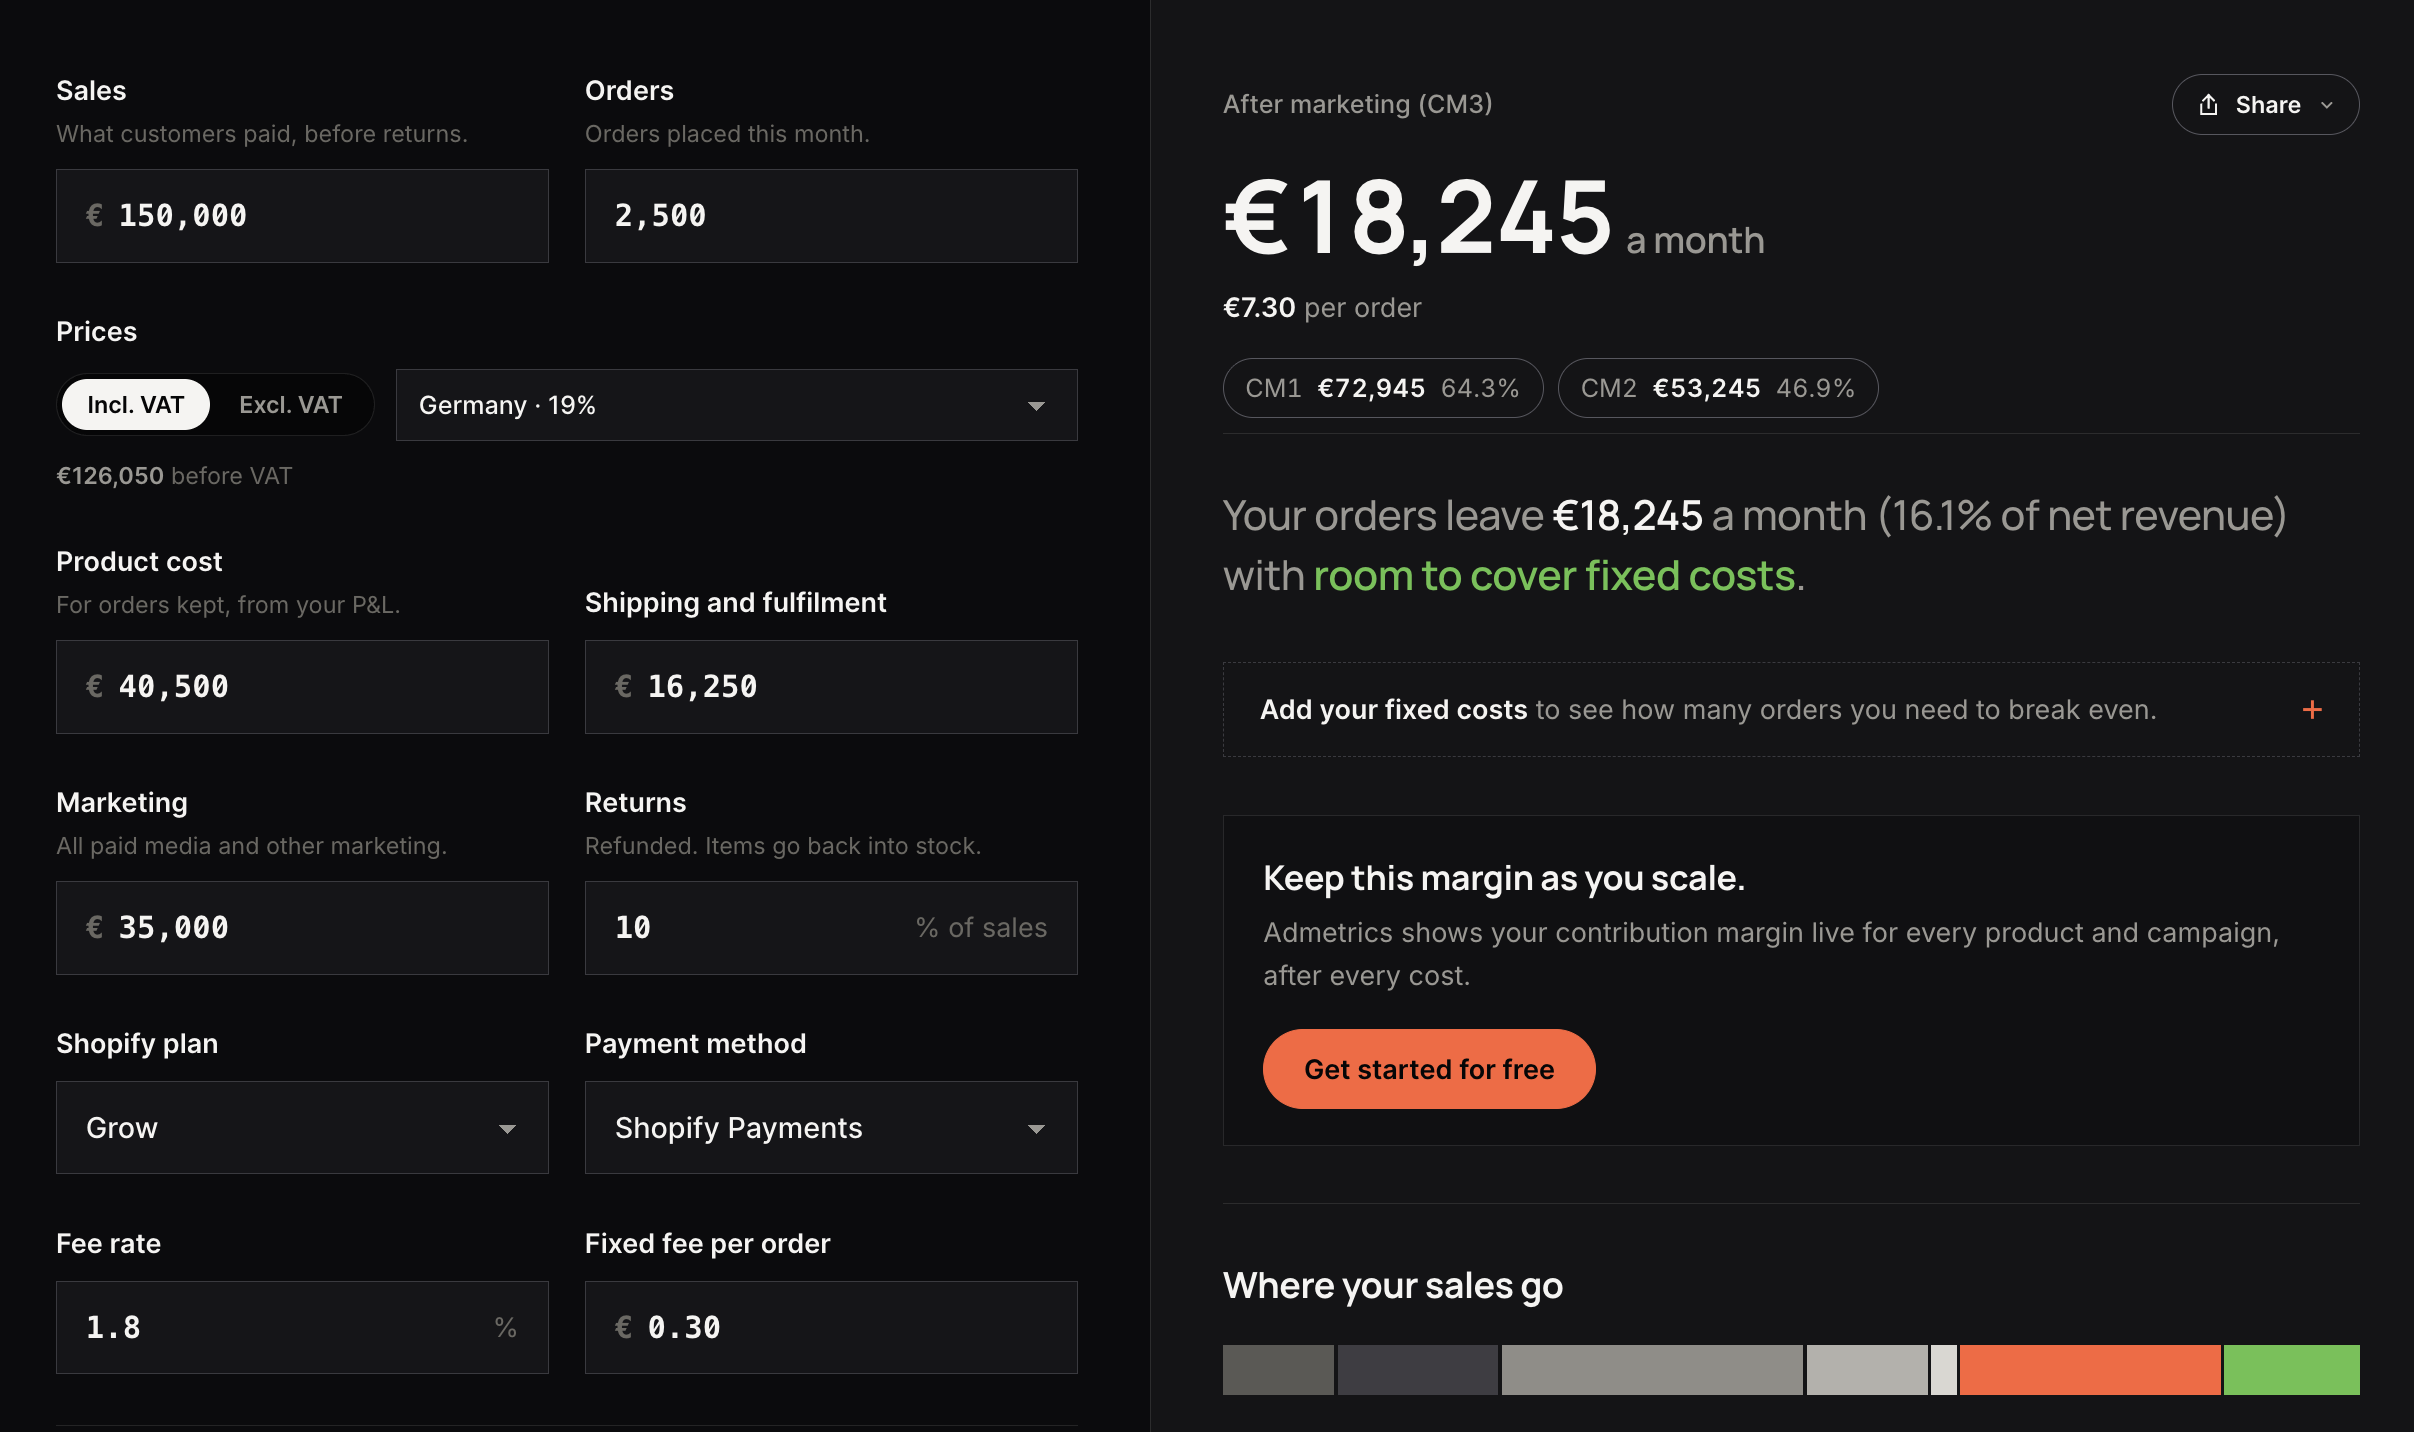
Try it with your own numbers: the free contribution margin calculator shows CM1, CM2 and CM3 per order, and the discount profit calculator shows what each order keeps at a discount and how many more orders the offer needs.
Use it for one product or an average order:
- Price and VAT. Enter the price customers pay and your VAT rate; the calculator works from net revenue.
- Product cost. Include inbound freight and duties if they apply.
- Order costs. Fulfilment and packaging, shipping, your payment fee mix and your expected return rate.
- Marketing. The ad spend you expect per order, or your target CPA, for Black Week.
- Discount. Move the slider to 20, 30 and 40% and watch CM2, CM3 and break-even ROAS change.
If CM2 goes below your expected cost per order, the discount loses money on every sale. Try a smaller discount, a bundle, or a free-shipping threshold instead.
How to set up contribution margin reporting
The data you need
A 30-day plan before Black Week
Days 1–10: costs. Import product costs for every SKU. Set fulfilment and shipping as a cost per order, by country if it differs. Add your payment fee by method and an expected return rate by product category, from last year.
Days 11–20: definitions. Agree which costs belong in CM1, CM2 and CM3, how discounts are booked, and what counts as a new customer. Write them down; a margin nobody can explain will not survive a budget meeting.
Days 21–30: targets. Calculate CM2 per product at each planned discount, the break-even CPA per campaign, and the NC-CAC ceiling for new customers. These become the rules you steer by during the week.
Spreadsheet, platform report or profit analytics tool?
- A spreadsheet is fine for planning discounts on a few products. It breaks during Black Week, when you need CM3 by campaign several times a day.
- Shopify and other store reports show revenue and gross profit, but not ad spend per order, returns per channel or marketplace orders together.
- A profit analytics tool joins orders, costs, returns and attributed marketing spend, so CM3 by campaign, product and customer type is ready when you need to decide. Look for order-level evidence, new-versus-returning splits, marketplace coverage and data you can export.
FAQ
What is contribution margin in ecommerce?
The money an order, product or campaign leaves after every cost that grows with it: product cost, fulfilment, shipping, payment fees, returns and, at CM3, marketing. It shows whether a sale makes money before fixed costs.
What is the contribution margin formula?
Contribution margin = net revenue − variable costs. The contribution margin ratio is contribution margin divided by net revenue.
What is the difference between CM1, CM2 and CM3?
CM1 subtracts product cost from net revenue. CM2 also subtracts order costs: fulfilment, shipping, payment fees and returns. CM3 also subtracts the marketing cost of winning the order.
What is the difference between gross margin and contribution margin?
Gross margin subtracts only product cost. Contribution margin subtracts every variable cost, so it shows whether an order or campaign actually makes money.
What is a good contribution margin for an ecommerce brand?
It depends on category, price point and acquisition costs, so a single benchmark is rarely useful. A better test: is CM2 per order higher than what you pay to acquire an order? If not, more volume makes the loss bigger.
How does a discount affect contribution margin?
A discount lowers the price but not the product, shipping or payment costs, so margin falls much faster than price. On a 50% gross margin product, 30% off removes 60% of the gross profit.
Should I discount my best-sellers on Black Friday?
Only if their margin can carry it. Best-sellers sell anyway, so a deep discount on them often gives away margin on orders you would have won at full price. A smaller discount, a bundle or a gift with purchase can earn more.
What is POAS, and how is it different from ROAS?
ROAS is revenue divided by ad spend. POAS is contribution margin (usually CM2) divided by ad spend. A POAS above 1.0 means the campaign makes money; ROAS cannot tell you that.
See contribution margin live, on your real data
The calculator shows one order. Admetrics shows CM1, CM2 and CM3 for every order, product, campaign and channel, with new and returning customers separated and returns included, updated through Black Week. You see which discounts earn and which only sell, while you can still move the budget.
Run your biggest week free: Admetrics is free until 1 December. No credit card, no commitment. Get started for free