In the calculator's example month, a store sells €200,000 after discounts across 2,500 orders, and Shopify Analytics reports an average order value of €80.00. Lift that to €90 and the month brings in €25,000 more in sales. Profit goes up by €13,500, and profit margin goes from 22.2% to 26.4% while gross margin stays at 60%.
Both numbers come from one split. Part of every extra euro is refunded on the orders that come back and part of it is product cost, while the costs an order carries just for existing (the parcel, the ad that brought it in) stay where they were. Work through it in the order below: calculate AOV the way Shopify does, see what an order keeps, then see how a bigger basket moves profit margin and what it can cost you in orders.
The AOV tab of the calculator above works out your average order value and what each order keeps. The Target AOV tab shows what a higher average order is worth in profit a month and a year.
How to calculate average order value
The AOV formula divides sales by the number of orders for the same period. Shopify's help center defines it as (gross sales − discounts) ÷ orders, "excluding any post-order adjustments." Since January 2023 that definition applies everywhere in the admin, historical data included. Before then, Shopify based AOV on each order's total sales, which means a spreadsheet or an agency deck can disagree with Shopify Analytics about the same month while both are arithmetically correct.
Same example month, four averages:
| Number | € | What it includes |
|---|---|---|
| Shopify AOV: (gross sales − discounts) ÷ orders | 80.00 | After discounts; before returns, shipping and tax |
| AOV after returns (10%) | 72.00 | What orders keep after refunds (calculator's "After returns") |
| Same orders incl. 19% VAT | 95.20 | €238,000 incl. VAT ÷ 2,500 |
| Total sales ÷ orders | varies; above 80.00 here | Adds shipping charged to customers and taxes, and nets returns |
Each number differs from Shopify's by what its formula adds or removes, and Shopify stops at discounts. Total sales ÷ orders adds back the shipping and tax customers paid and takes out returns; where it lands against €80 depends on the store's returns, shipping and tax, and in our US-dollar test further down it was 3.2% higher.
Use Shopify's AOV to follow trends and AOV after returns when the question is money. Shopify's figure is stable month to month and matches what the whole team sees in the admin, which makes it the right line for a chart. It can't tell you how much of an order stays.
Take VAT out before you compare numbers
EU prices include VAT, and any average built from what customers paid carries it. At Germany's 19% the same 2,500 orders average €95.20 (€238,000 ÷ 2,500), €15.20 above Shopify's figure without a single extra item sold.
The calculator works backward from there: enter €238,000 with Incl. VAT and Germany selected and it shows €80.00.
The rate matters again across markets. Austria charges 20% and the Netherlands 21%, and the same basket's incl.-VAT average reads higher in Amsterdam than in Berlin.
Switch to AOV after returns when returns are high
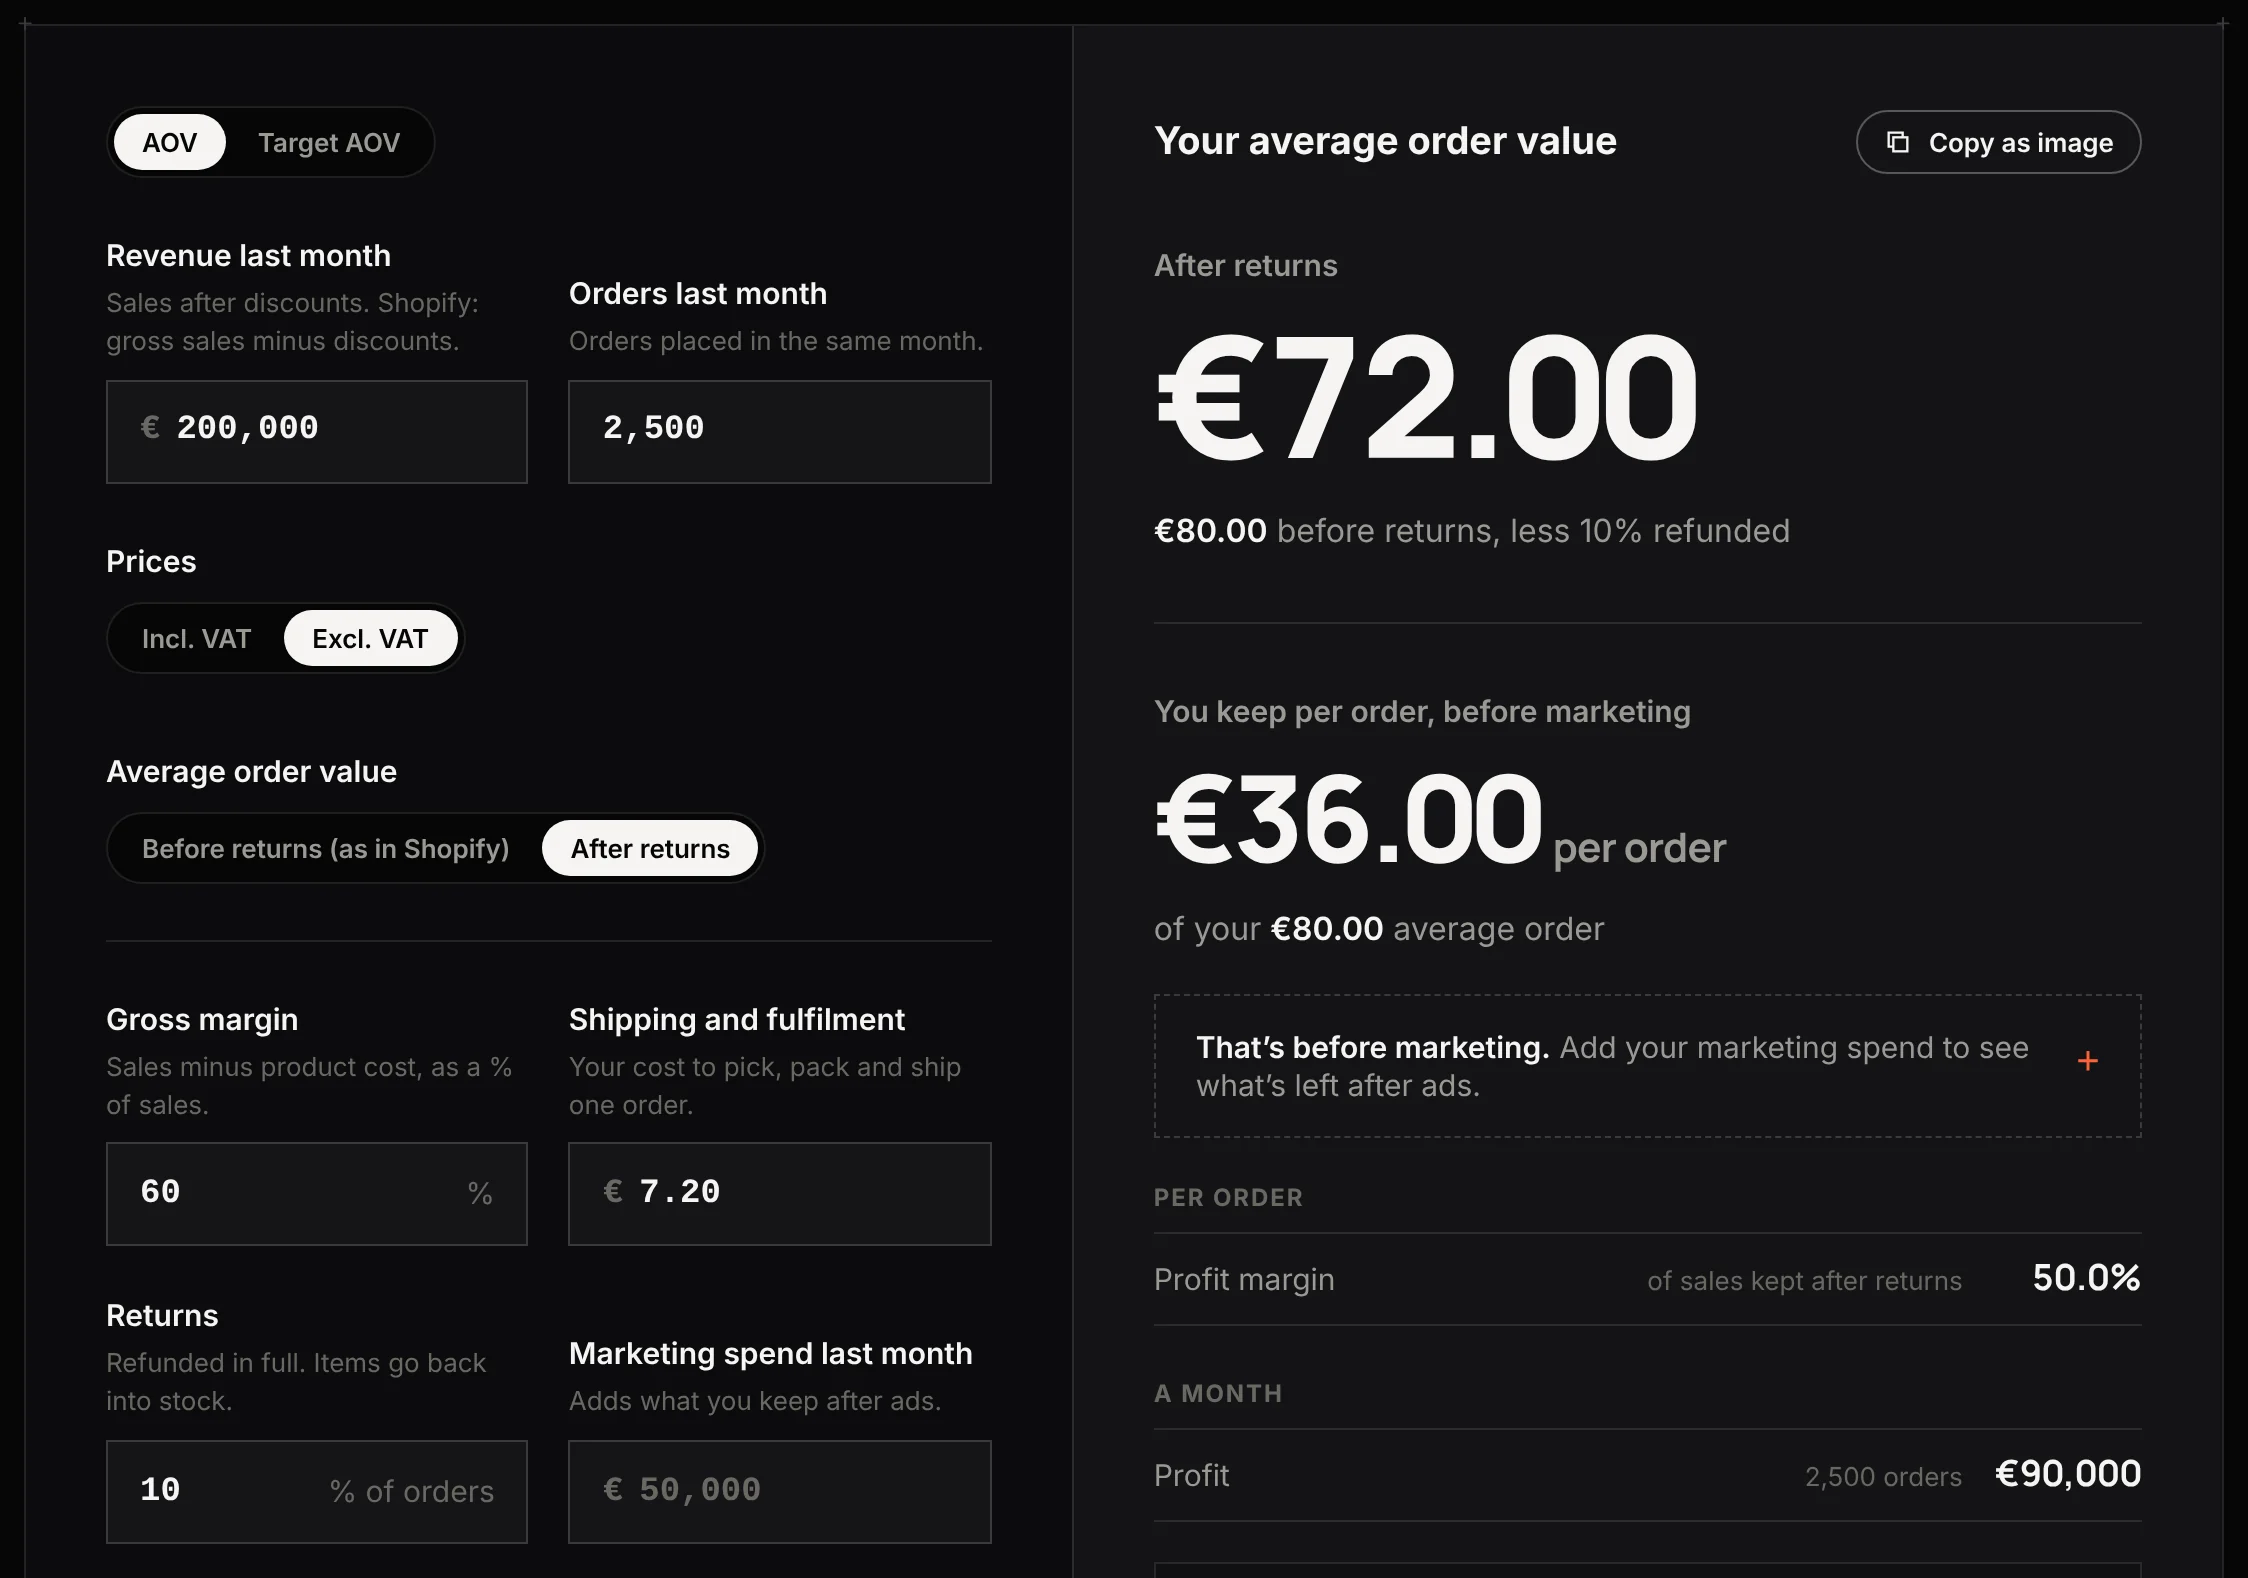
Shopify's formula ignores anything that happens after the order is placed, refunds included. Push returns from 10% to 25% and Shopify's AOV stays at €80.00, while AOV after returns falls from €72.00 to €60.00.
Set the Average order value toggle to "After returns" when your return rate is high or rising, or when you compare categories that come back at different rates. AOV after returns is AOV × (1 − return rate). Every cost below is measured against it, because product cost only applies to orders the customer keeps.
How to use the AOV calculator
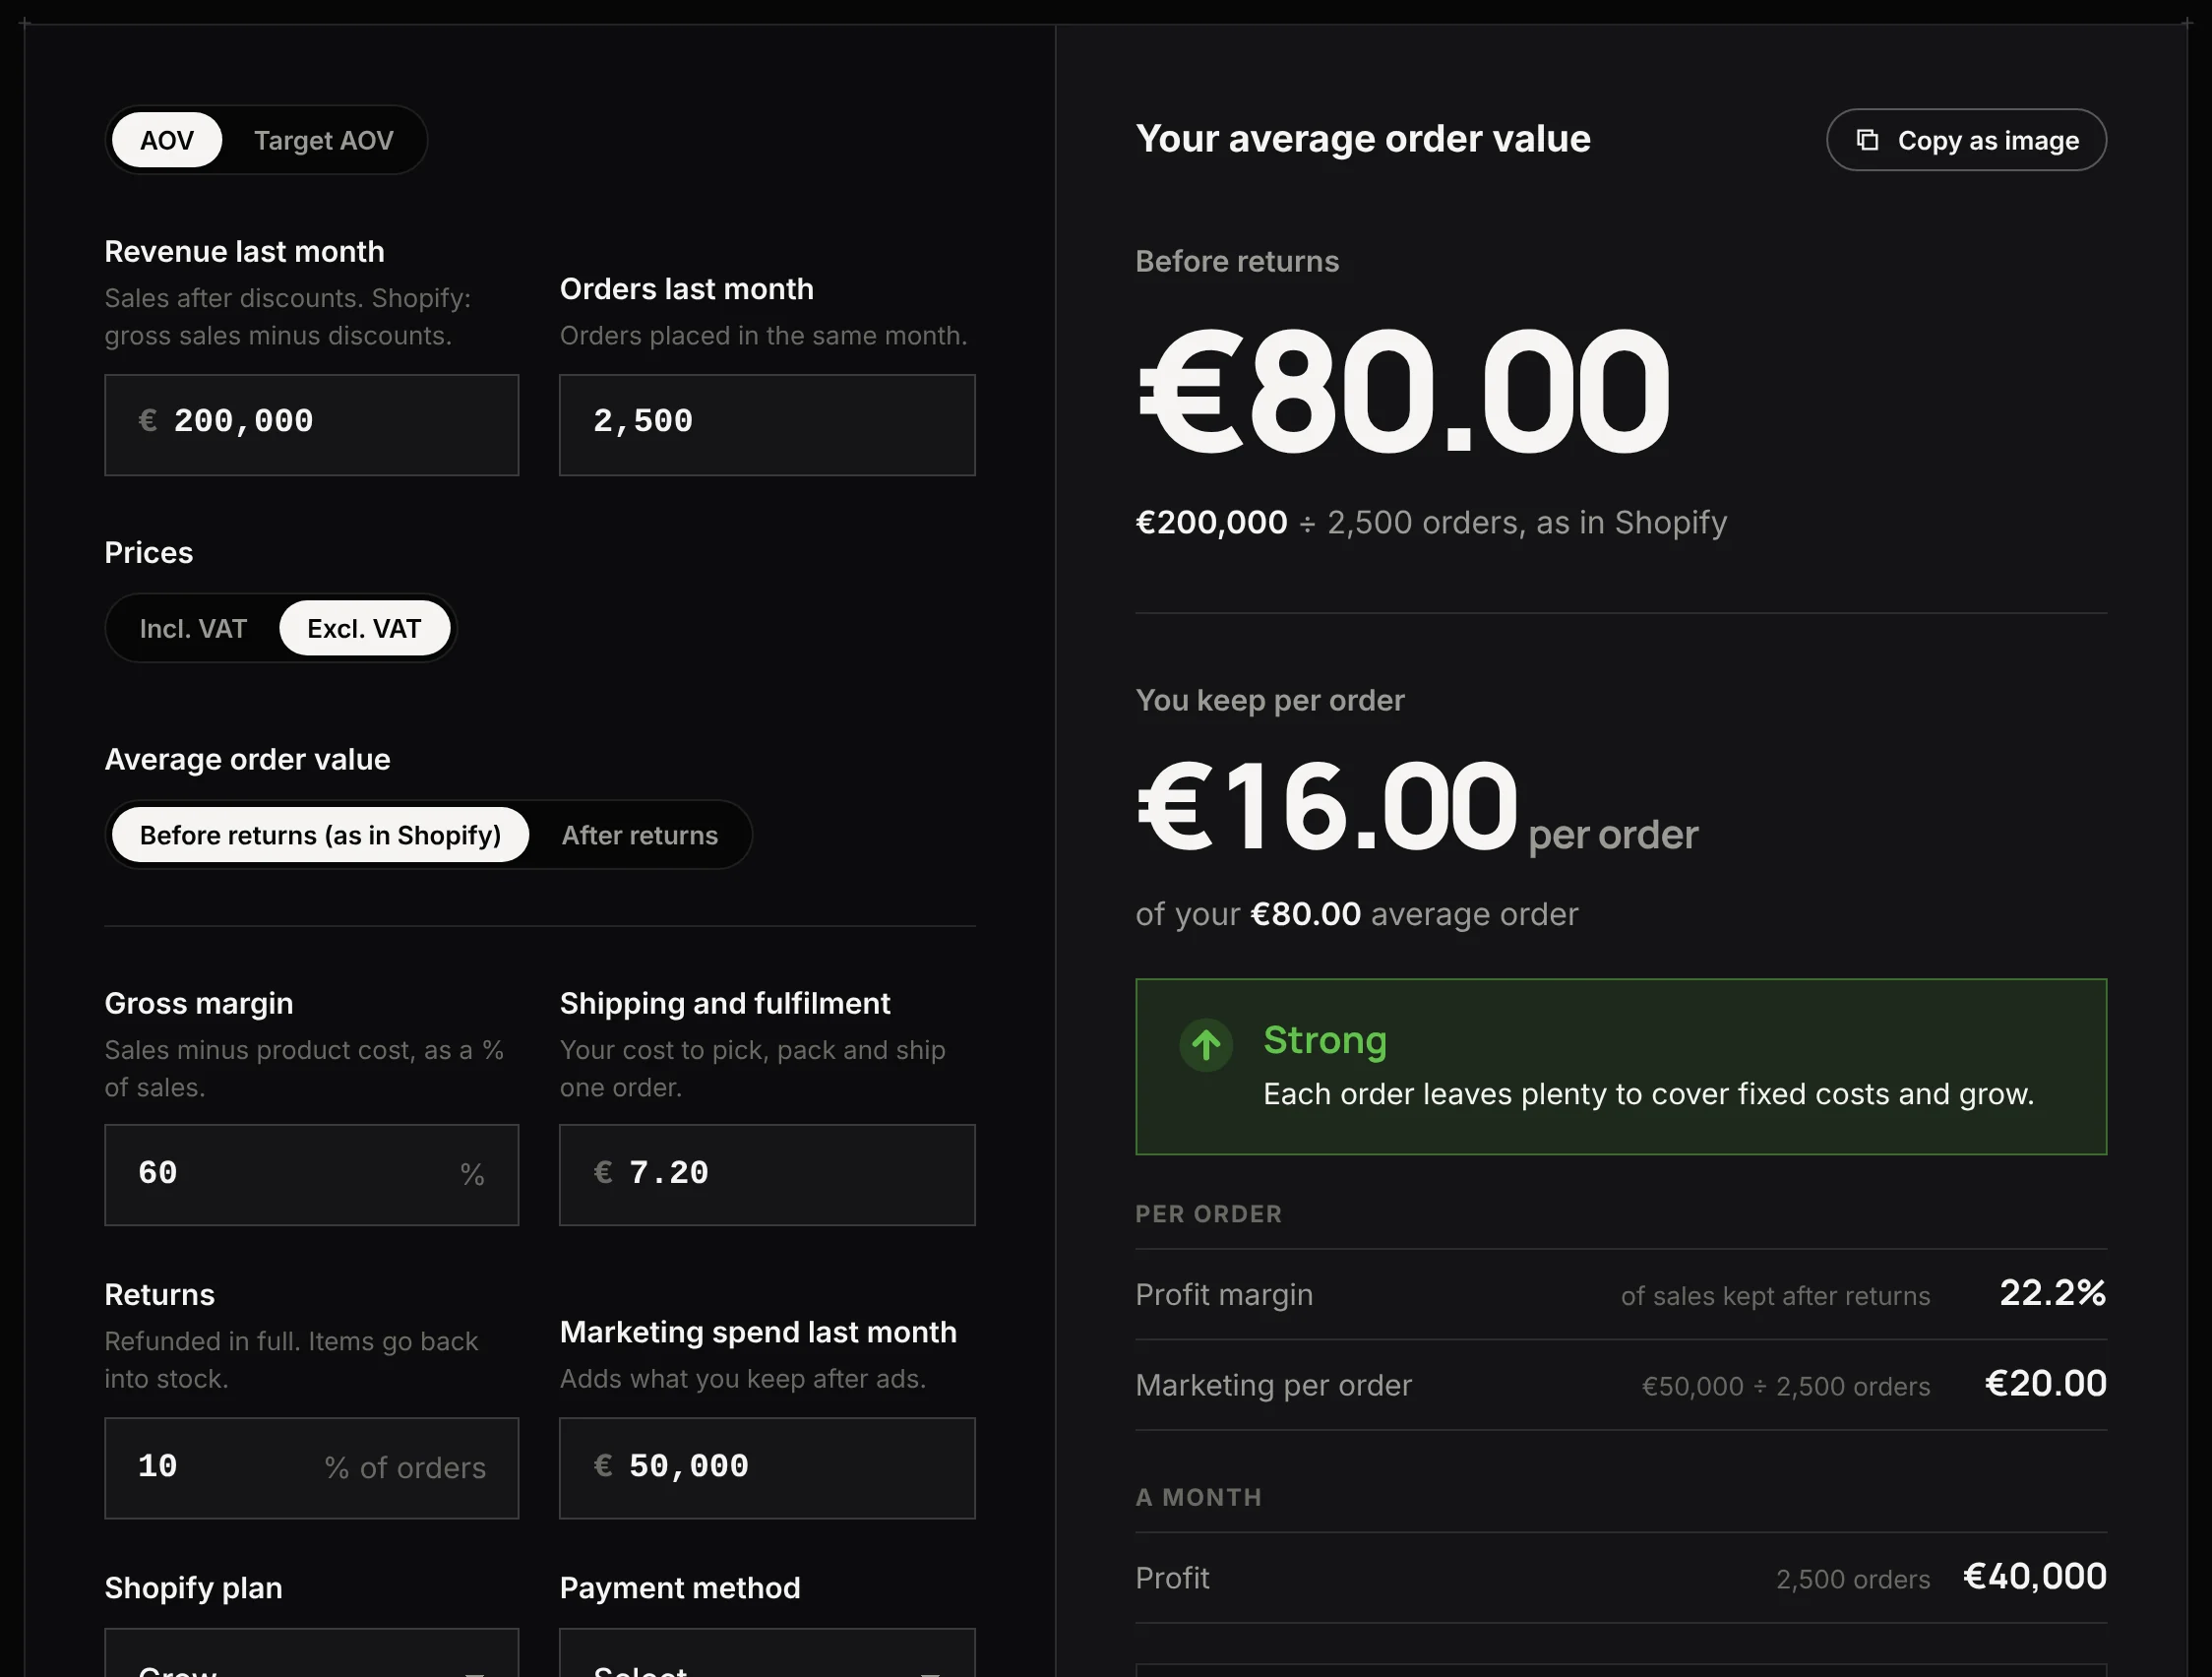
Start on the AOV tab with last month's numbers. Revenue last month is sales after discounts (gross sales minus discounts in Shopify), and Orders last month is the order count for the same dates. Leave Prices on Excl. VAT if both come from Shopify; switch to Incl. VAT and pick the country if your revenue figure includes tax.
The next inputs decide what an order keeps. Gross margin is sales minus product cost as a percentage of sales. Shipping and fulfillment is the cost per order, usually the 3PL invoice divided by orders shipped. Returns is the share of orders refunded in full. Marketing spend last month is optional; add it from Meta Ads Manager and Google Ads and the result turns from "before marketing" into what the order actually keeps, with a verdict from Losing money to Strong. Shopify plan and Payment method fill in editable fee presets.
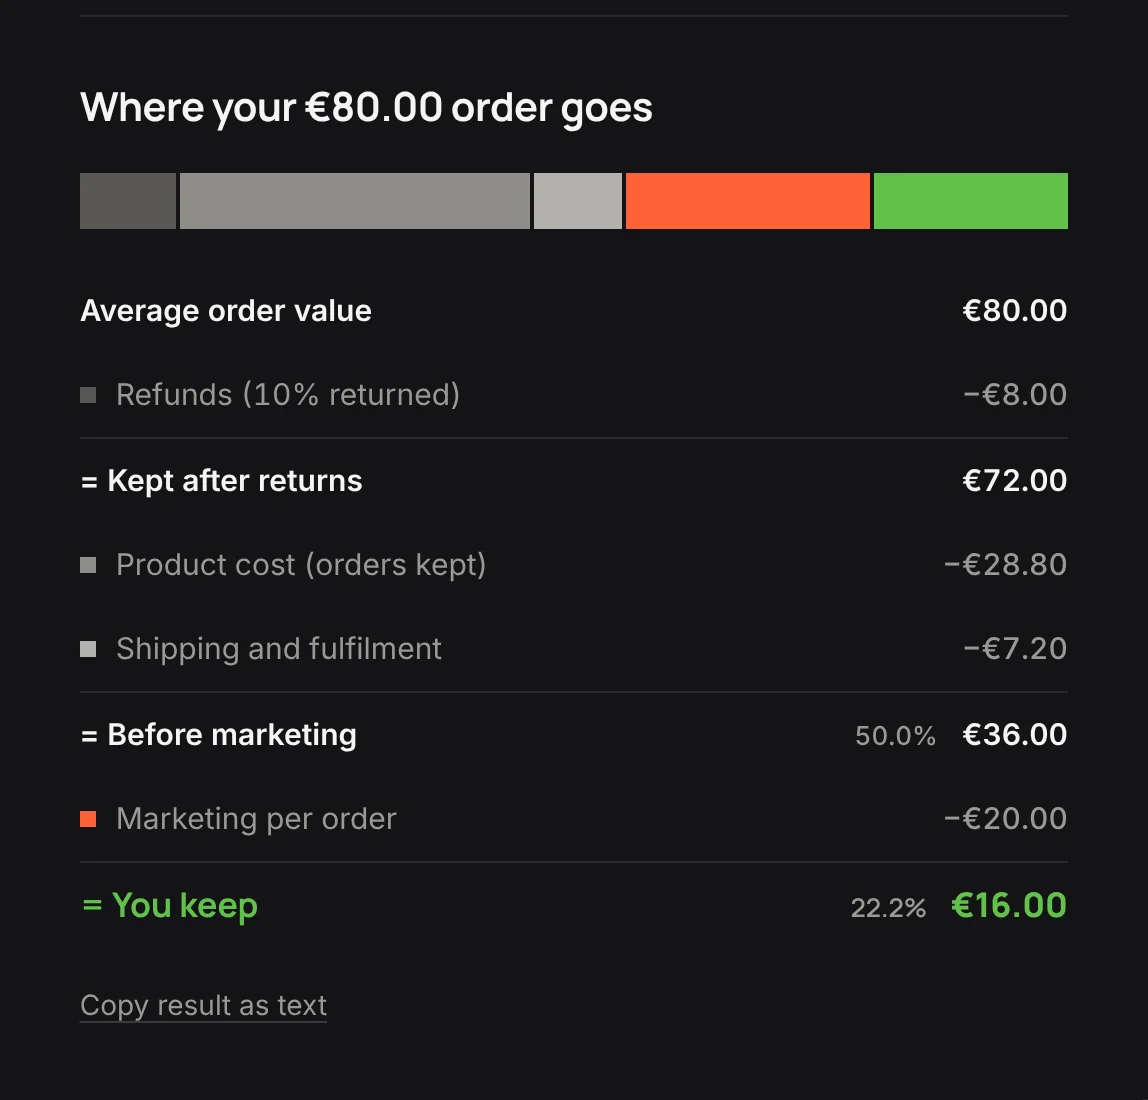
The result leads with your average order value, then You keep per order and the monthly profit, and "Where your €80.00 order goes" breaks the order into one bar.
The Target AOV tab reuses those inputs. Type a target or click a quick pick and it returns the extra sales and extra profit per order, per month and per year.
How AOV affects profit per order
Sort an order's costs by whether they grow with the basket. Refunds and product cost do: a bigger order sends more money back when it's returned and more product out the door when it isn't. Shipping and fulfillment and marketing per order don't (a heavier parcel can move to a higher shipping rate, which the calculator doesn't model).
Example month: 60% gross margin, 10% returns, €7.20 shipping and fulfillment per order, €50,000 marketing over 2,500 orders.
| Line | € | Grows with the basket? |
|---|---|---|
| Average order value | 80.00 | |
| Refunds (10% of orders returned) | −8.00 | Yes |
| = Kept after returns | 72.00 | |
| Product cost (40% of €72, orders kept) | −28.80 | Yes |
| Shipping and fulfillment | −7.20 | No |
| = Before marketing (50.0% of €72) | 36.00 | |
| Marketing per order (€50,000 ÷ 2,500) | −20.00 | No |
| = You keep (22.2% of €72) | 16.00 |
Over the month the store keeps €90,000 before marketing and €40,000 after. With Shopify Payments on the Grow plan (1.8% + €0.30), the fee takes €1.74 an order and the order keeps €14.26.
The usual shortcut is AOV × gross margin, which gives €48.00. It assumes nothing comes back and nothing ships, and it ignores fees. Take €20 of marketing off and it reads €28.00, against €16.00 the order actually keeps. At 25% returns, that same order keeps €8.80.
On 9 October 2026 we ran one month of a Shopify store through 16 free AOV calculators found on Google, in US dollars because most only take dollars. We typed in the revenue each tool asked for, which was total sales ($206,400) every time, and all 16 showed $82.56 (one rounded it to 83). Shopify's AOV for the same month is $80.00. Two calculated anything about profit, and both overstated it: one showed $29.54 net profit per order against $16.00 actually kept, the other put a $90 AOV at +$15,000 a month where returns make it +$13,500.
For the full per-order cost walk-through, use the profit margin calculator; for margin after marketing per order and per month, the contribution margin calculator.
How AOV affects profit margin
Gross margin doesn't move when AOV rises, as long as the extra basket carries the same margin as the rest. Profit margin does, because the €27.20 of shipping and marketing every order carries gets spread over a bigger order.
Same store, same 2,500 orders and €50,000 marketing, at different AOVs:
| AOV | After returns | Gross margin | Shipping + marketing, share of sales after returns | You keep per order | Profit margin | Profit a month |
|---|---|---|---|---|---|---|
| €60 | €54.00 | 60% | 50.4% | €5.20 | 9.6% | €13,000 |
| €70 | €63.00 | 60% | 43.2% | €10.60 | 16.8% | €26,500 |
| €80 | €72.00 | 60% | 37.8% | €16.00 | 22.2% | €40,000 |
| €90 | €81.00 | 60% | 33.6% | €21.40 | 26.4% | €53,500 |
| €100 | €90.00 | 60% | 30.2% | €26.80 | 29.8% | €67,000 |
| €110 | €99.00 | 60% | 27.5% | €32.20 | 32.5% | €80,500 |
Profit margin here is what the order keeps as a share of sales after returns, the basis the calculator's verdict uses.
Profit margin = gross margin − per-order costs ÷ AOV after returns. At €80: 60% − €27.20 ÷ €72 = 60% − 37.8% = 22.2%. Gross margin sets the ceiling, and AOV decides how close to it you get.
Each step up adds less margin than the one before. From €60 to €70 the margin gains 7.2 points; from €100 to €110, 2.7 points. Per-order costs are already a small share of a large order, which is why the same €10 lift moves a €60 store's margin more than twice as far as a €100 store's.
Two things the table holds fixed can break it. If the extra basket carries a lower gross margin (a discounted add-on, say), the ceiling drops. If a higher AOV costs orders while marketing spend stays the same, marketing per order rises. Both come up below.
What a higher AOV is worth a month
Example month, Target AOV tab, no payment fee entered:
| Target AOV | Extra sales per order | Extra profit per order | Extra profit a month | Extra profit a year | Extra sales a month |
|---|---|---|---|---|---|
| €85 | +€5 | +€2.70 | +€6,750 | +€81,000 | +€12,500 |
| €90 | +€10 | +€5.40 | +€13,500 | +€162,000 | +€25,000 |
| €95 | +€15 | +€8.10 | +€20,250 | +€243,000 | +€37,500 |
| €100 | +€20 | +€10.80 | +€27,000 | +€324,000 | +€50,000 |
| €105 | +€25 | +€13.50 | +€33,750 | +€405,000 | +€62,500 |
| €110 | +€30 | +€16.20 | +€40,500 | +€486,000 | +€75,000 |
In this example, every extra euro of AOV keeps 54 cents. Of the extra €10, 10% is refunded on the orders that come back, which leaves €9.00. Product cost takes 40% of that (€3.60), which leaves €5.40. Shipping and marketing per order stay where they were.
The rule is extra AOV × (1 − return rate) × gross margin, and you can run it in your head with your own two percentages.
Profit per order moves much further than revenue.
At €90 the order keeps €21.40, up 34%, while revenue per order is up 12.5%. The first €80 already paid for the €27.20 of shipping and marketing; the extra €10 doesn't have to.
Payment fees do grow with the basket. With Shopify Payments on Grow, 1.8% of the extra €10 is €0.18 an order, and the monthly gain becomes +€13,050 instead of +€13,500.
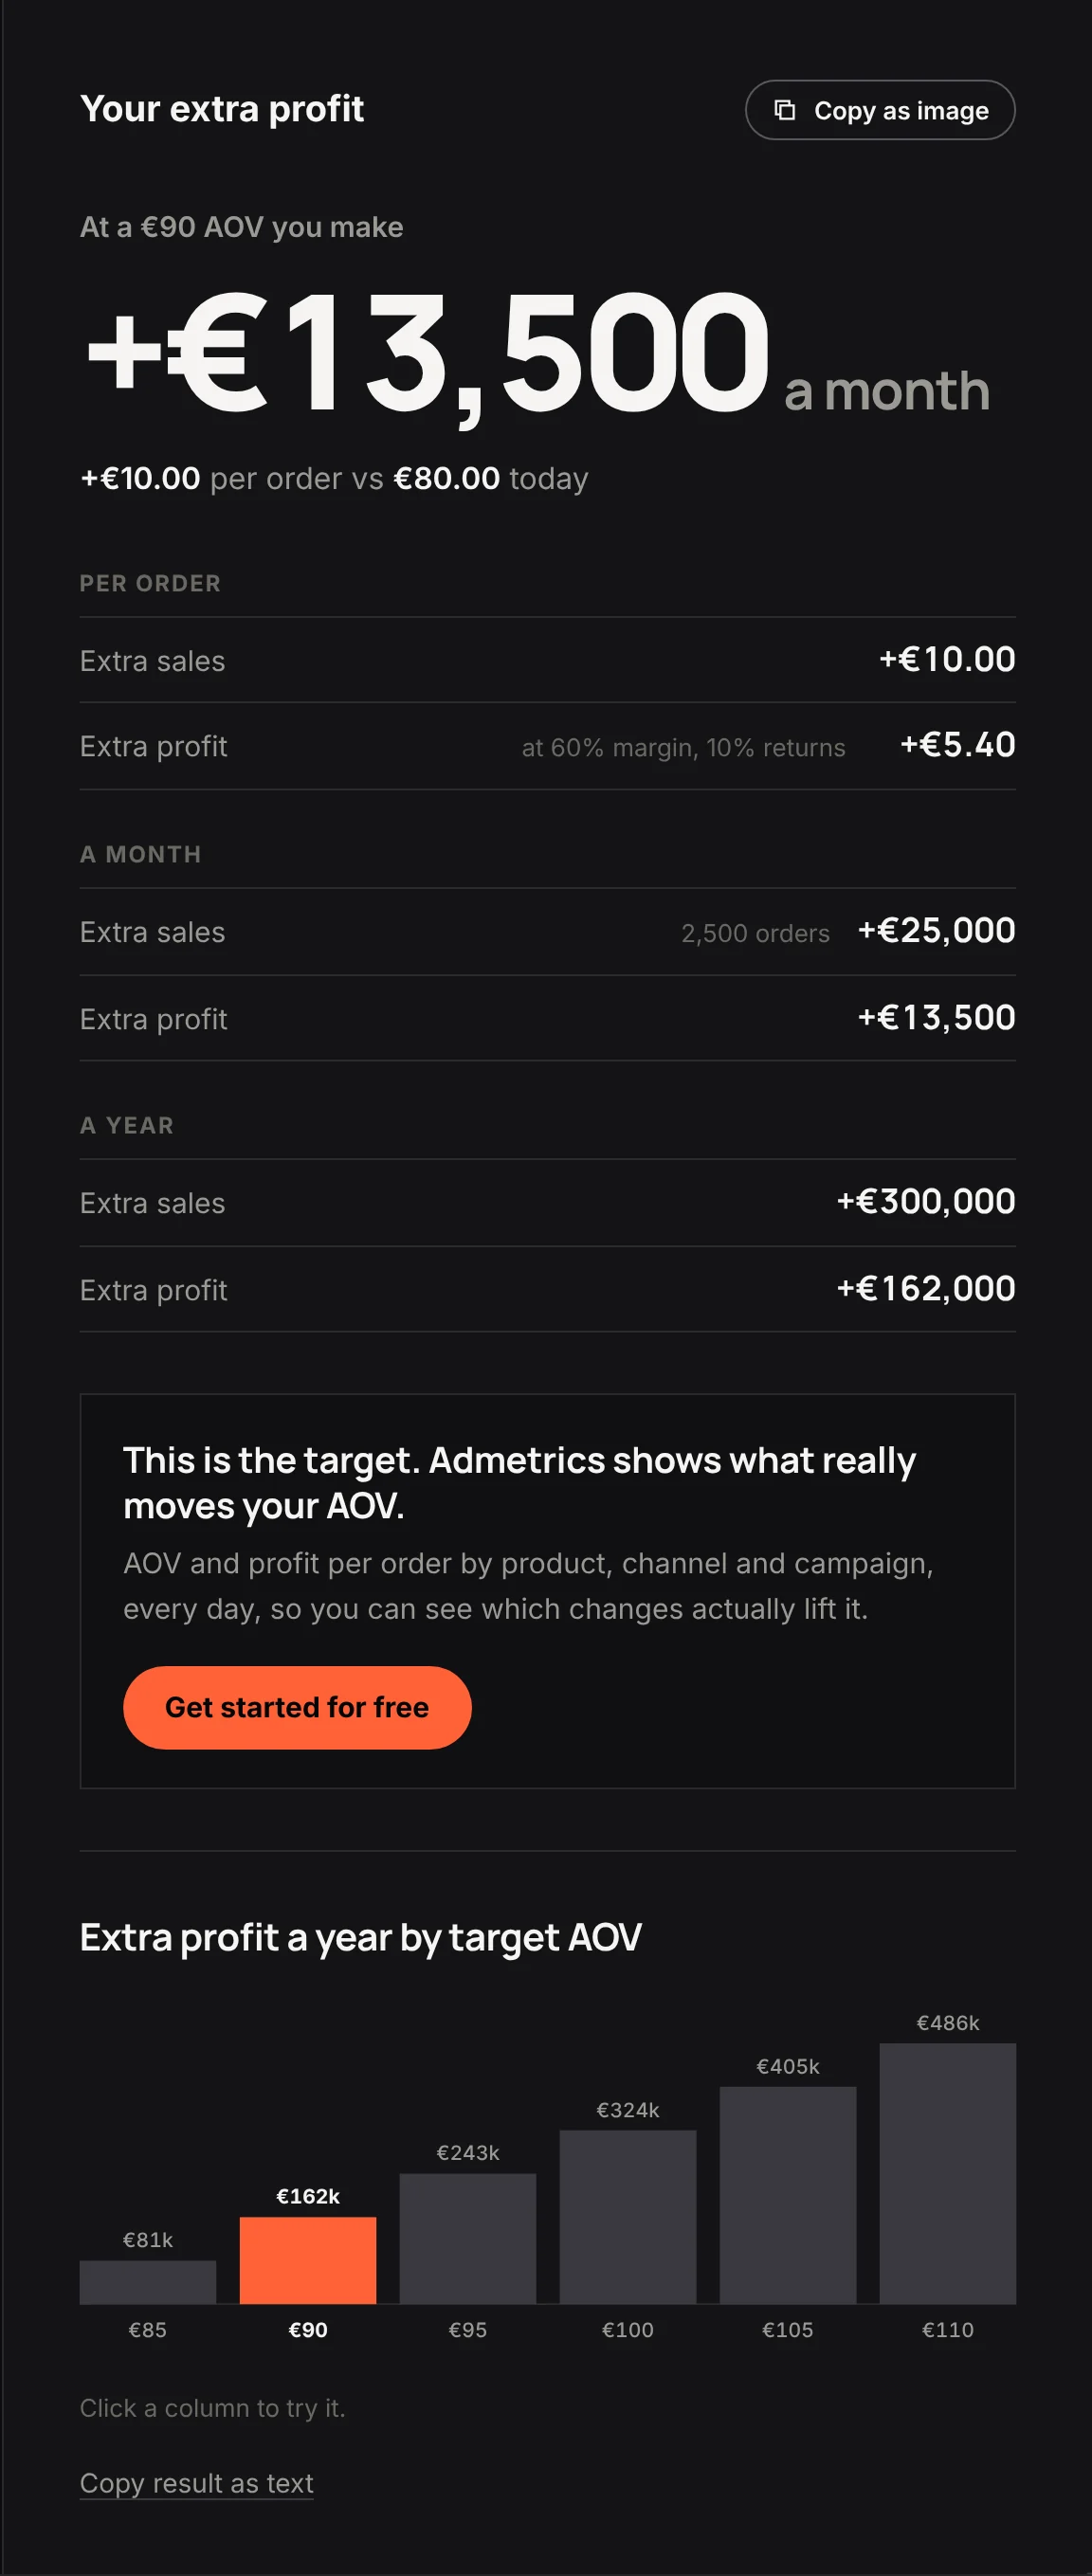
Judge an AOV change in profit per month, never in revenue per order. Revenue says +€25,000 and profit per order says +34%, and neither notices if the change also costs orders.
How to increase AOV without giving the profit away
The usual levers are bundles, free-shipping thresholds, volume pricing, upsells and price changes. Each one adds items to the basket or raises what they cost, and most carry a price of their own: orders lost, a discount, or shipping income given up. Check all three before you launch.
Check how many orders a higher AOV can cost
Revenue = sessions × conversion rate × AOV. Most ways of raising the last term press on the middle one: a threshold, a bundle-only offer or a price rise can lift the average order and lose some orders that would have happened at the old price.
The trade is lopsided. Each order the store keeps at €90 adds €5.40. Each order it loses takes away everything that order would have kept before marketing, €41.40 (€36.00 + €5.40), while the €50,000 of marketing still gets spent. One lost order cancels the gain on more than seven kept ones.
Profit a month at a €90 AOV, marketing held at €50,000 (illustrative):
| Orders | Change | Profit a month (€41.40 × orders − €50,000) | vs today (€40,000) |
|---|---|---|---|
| 2,500 | 0% | €53,500 | +€13,500 |
| 2,375 | −5% | €48,325 | +€8,325 |
| 2,250 | −10% | €43,150 | +€3,150 |
| 2,175 | −13% | €40,045 | ≈ break-even |
| 2,125 | −15% | €37,975 | −€2,025 |
Break-even sits at 2,174 orders, 13.0% fewer than today. For any target, the share of orders you can lose before a higher AOV pays less is the extra profit per order divided by profit before marketing per order at the new AOV: €5.40 ÷ €41.40 = 13.0%.
The calculator doesn't guess how many orders a change will lose. To test a scenario, enter the lower order count and matching revenue (orders × €90) on the AOV tab and compare the monthly profit with today's €40,000.
Count the discount and free shipping in the lift
The €5.40 assumes the extra €10 carries the same 60% margin as the rest of the order, and a discount breaks that. If the extra €10 comes from an add-on sold at 15% off its €11.76 list price, its product cost is still €4.71. After returns, the order keeps €9.00 of the extra sales and pays €4.24 in product cost on the kept orders, which leaves €4.76 and +€11,912 a month instead of +€13,500.
A free-shipping threshold costs in two places the Target AOV tab can't see. You give up the shipping you charged on orders that already cleared the threshold, and you stop charging shipping on the orders that top up to reach it. As an example only: if 750 orders a month already sit above the threshold and pay €4.90 for shipping today, the store gives up €3,675 a month before the threshold adds a cent of AOV.
Bundles have a quieter version: customers who would have bought both items anyway don't raise AOV, they just pay less.
Price the offer in the discount calculator first, which covers bundles and free-shipping thresholds, then bring the result back to the Target AOV tab.
What is a good AOV?
One that clears the point where an order pays for itself, by as much as you can manage without losing orders. Divide the per-order costs that don't grow with the basket by the share of each euro that survives returns and product cost.
| € | |
|---|---|
| Shipping and fulfillment per order | 7.20 |
| + Marketing per order | 20.00 |
| = Costs that don't grow with the basket | 27.20 |
| ÷ Share of each euro kept (0.9 × 0.6) | 0.54 |
| = Break-even AOV | 50.37 |
Before marketing, break-even is €13.33. At €80 the example store's AOV sits €29.63 above it.
No category range can give you this number, because it depends on your shipping contract, your return rate and what you pay in ads per order. The formula also shows the two ways to widen the gap: shrink the costs on top, or keep more of each euro.
What this calculator can't tell you
AOV is a mean. A handful of very large orders can pull it up while the order most customers place doesn't change, and only an order-level export (median, or orders grouped by value) shows which happened.
It also blends new and returning customers, and products, channels and campaigns. A first order has to pay back the cost of acquiring the customer, and a campaign that brings big baskets averages out with one that brings small ones into a number that describes neither.
It can't show which orders sit just under a threshold you're considering, the group a threshold actually works on. And it can't tell you whether a change caused a lift: AOV moves with the season, the promo calendar and the product mix, and a before-and-after comparison doesn't separate those from the bundle you launched.
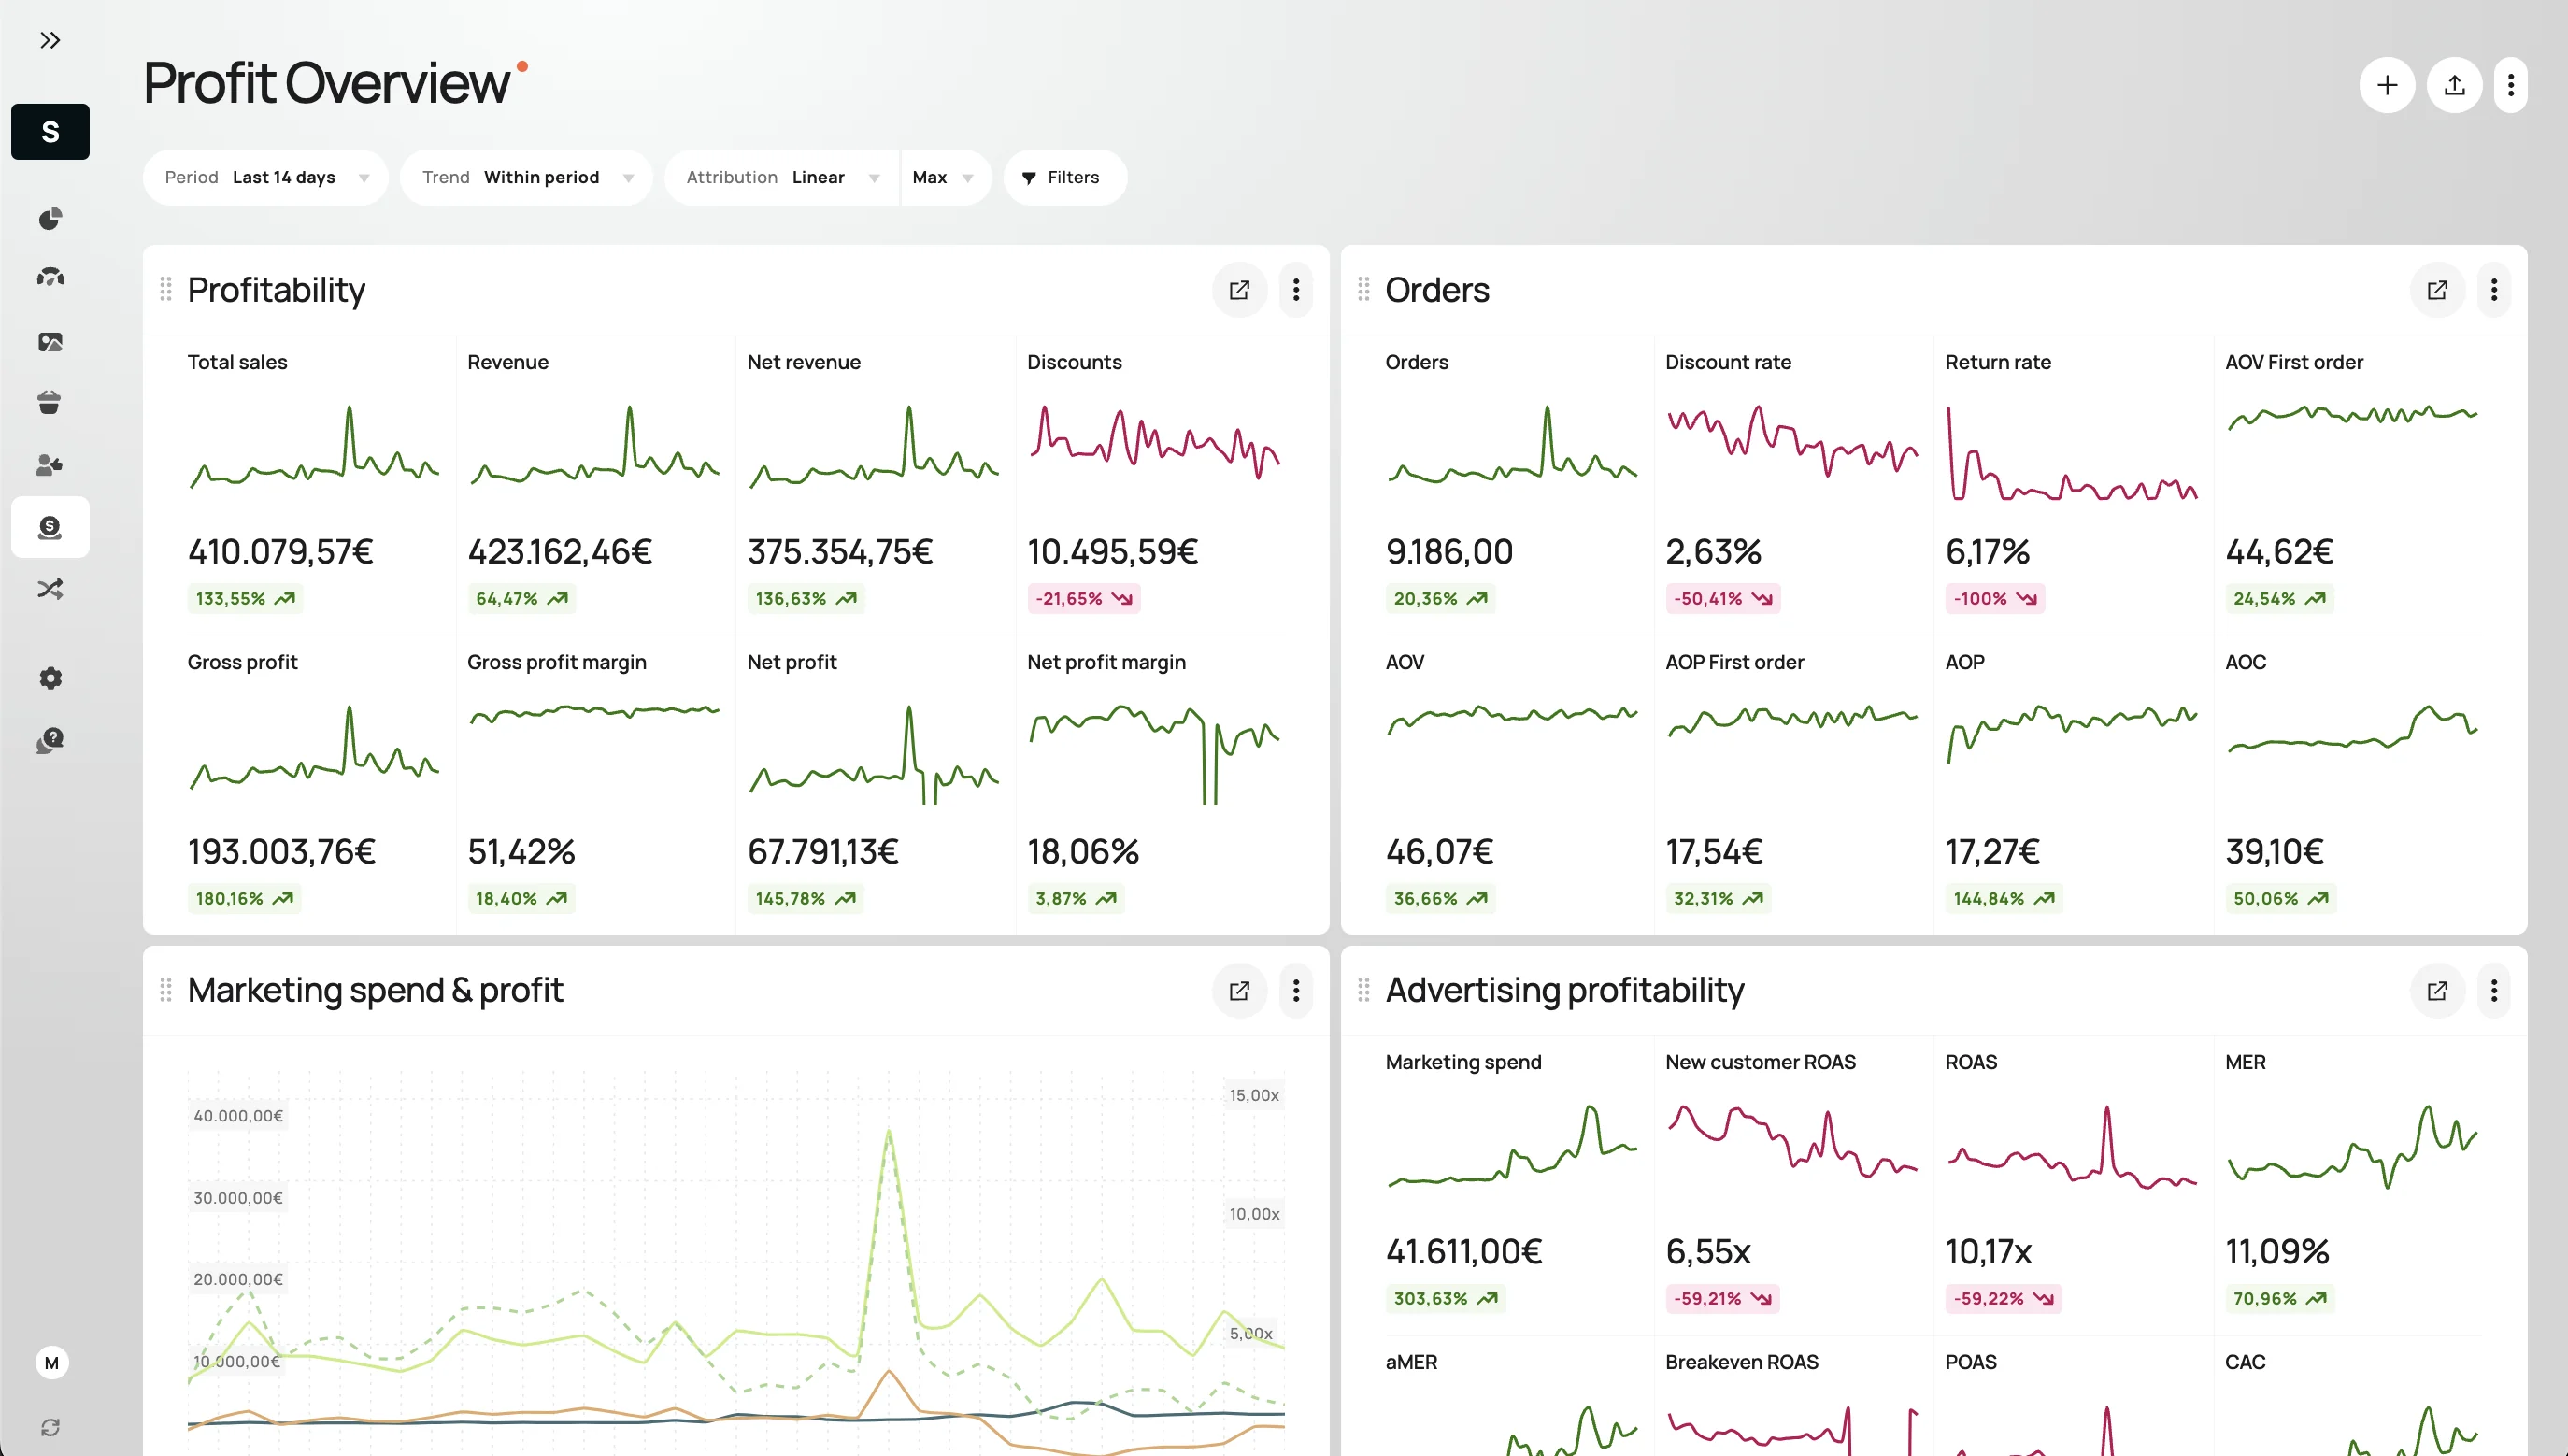
Admetrics shows AOV and average order profit (AOP) by channel, campaign and product, and for new and returning customers, which covers the blended averages above.
FAQ
What is average order value?
Average order value (AOV) is the average amount a customer spends per order over a period: sales divided by the number of orders. Shopify uses sales after discounts and before returns, shipping and tax. In the example month, €200,000 across 2,500 orders gives €80.00. It says nothing about profit until you take out returns, product cost and the costs every order carries.
How do you calculate AOV?
Divide sales by the number of orders for the same period. Shopify's version uses sales after discounts: (gross sales − discounts) ÷ orders. In the example month, €200,000 ÷ 2,500 gives €80.00. Decide once whether your number includes VAT, shipping and returns, because each one changes the result, and keep the same definition every month.
How does Shopify calculate average order value?
Shopify divides gross sales minus discounts by the number of orders and excludes any adjustment made after an order was placed. Returns, shipping charges and taxes aren't in it. Since January 2023 this definition applies across the admin, historical data included. Before that, Shopify used each order's total sales, which is why older exports can show a different AOV for the same month.
Should AOV include shipping and taxes?
For tracking and comparing, leave them out, as Shopify does. VAT goes to the tax office, and shipping charges offset what you pay to deliver the order. Total sales ÷ orders adds both back and nets returns, and in the example it lands above Shopify's €80.00. In EU stores, take VAT out before comparing averages across countries with different rates.
Does AOV include returns?
Shopify's AOV doesn't. It excludes post-order adjustments, and a refund is one: at 10% or 25% returns, the example store's AOV stays €80.00. AOV after returns does count them, at €72.00 with 10% returns and €60.00 with 25%. Use the after-returns figure whenever you work out what an order keeps or what a higher AOV is worth.
Does a higher AOV increase profit margin?
Usually, because shipping and marketing per order stay the same while the order gets bigger. In the example, profit margin goes from 22.2% at €80 to 26.4% at €90, with gross margin at 60% throughout. It stops working when the extra basket comes at a lower margin, through a discount for instance, or when the change costs orders and marketing per order rises.
How do you calculate AOV in Excel?
Put sales after discounts in A2 and orders in B2, then divide: =A2/B2. For AOV after returns, add the return rate (as a share of orders) in C2 and use =A2/B2*(1-C2). If your sales figure includes VAT, divide it by 1.19 first, or by one plus your country's rate. Pull every number for the same date range.
Is a higher AOV always better?
No. A higher AOV is worth less than it looks if it comes with fewer orders, discounted add-ons or free shipping handed to customers who already qualified. In the example, €90 instead of €80 adds €13,500 a month, and losing about 13% of orders cancels it. Judge each AOV change by profit per month.
What's the difference between AOV and average transaction value?
Average transaction value divides revenue by transactions instead of orders. Payment and retail reports tend to use it, and a transaction can be a payment rather than an order, which means a split payment or a second charge after an order edit can count twice. For an online store where each checkout is one order and one payment, the two numbers usually match.
How does AOV relate to CAC and LTV?
AOV sets how much of the acquisition cost one order can pay back. In the example, an order keeps €36.00 before marketing, against €20 of marketing per order. That €20 is spend divided by all orders, new and returning, so it isn't CAC. CAC is spent once per new customer: hold it against what a first order keeps, then add what repeat orders keep. Summed over every order a customer places, that kept amount is a profit-based lifetime value.
Silvana Chirita writes about ecommerce measurement for Admetrics. Last updated 9 October 2026.