Most profit reports lead with gross margin, and on this €60 order it comes to a comfortable 64.3%.
The order leaves €7.30.
The other €52.70 goes to VAT, refunds, the product, the carrier, the payment provider and the ads that found the customer. Gross margin only counts the product. This calculator takes the rest off one level at a time, and each level belongs to someone who can win part of it back: whoever buys stock, whoever negotiates with the 3PL, whoever runs the ads.
No signup, no email, no "book a call to see your result." It all runs in your browser.
Fill it in with your average order
Start with your average order. Enter your average order value after discounts, whether that includes VAT, the average product cost per order, shipping, your payment setup, your return rate and marketing cost per order.
Marketing per order is where most people get stuck.
Last month's ad spend divided by last month's orders is fine for a first pass, as long as you remember it's an average and averages hide a lot (more on that further down).
A few costs have no field of their own. 3PL pick-and-pack and packaging go into shipping, because you pay them per order like the label. Return labels and handling aren't in this version at all; we left them out of v1. If they're a real line on your 3PL invoice, add the monthly total divided by orders to shipping and you'll be close.
Switch to Per month for planning. Same inputs, multiplied by your order count, with room for fixed costs.
How to calculate contribution margin
Every textbook says revenue minus variable costs. Correct, and not much help to a store, where two things come off before you reach a single cost: VAT, which belongs to the tax office, and refunds, which went back to the customer.
The €60 order, step by step:
| Step | Per order | % of net revenue |
|---|---|---|
| Order value (incl. 19% VAT) | €60.00 | |
| Refunds (10% returns) | −€6.00 | |
| Sales kept | €54.00 | |
| VAT on kept sales | −€8.62 | |
| Net revenue | €45.38 | 100% |
| Product cost on kept orders (90% × €18) | −€16.20 | |
| CM1 | €29.18 | 64.3% |
| Shipping | −€6.50 | |
| Payment fee (Shopify Payments, Grow: 1.8% + €0.30) | −€1.38 | |
| CM2 | €21.30 | 46.9% |
| Marketing | −€14.00 | |
| CM3 | €7.30 | 16.1% |
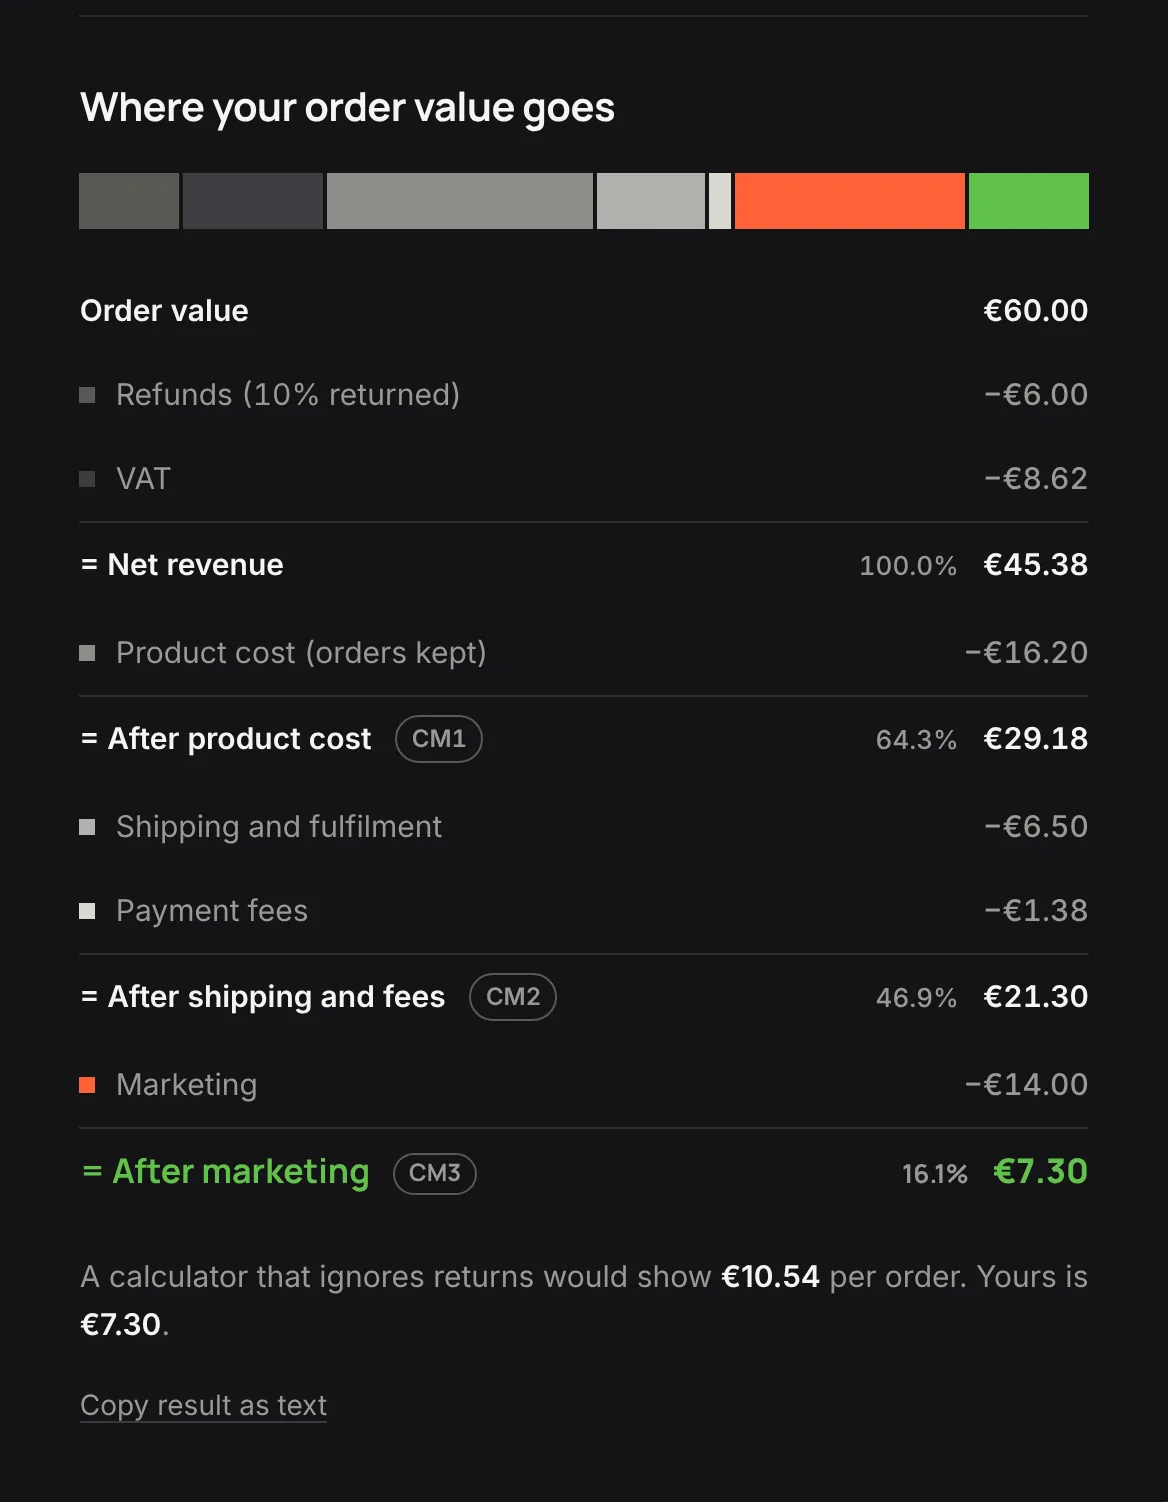
Two lines in that table trip people up. Product cost counts only on the 90% of orders customers keep, because returned products go back on the shelf. Shipping and the payment fee count on every order. The carrier and the payment provider get paid whether the parcel comes back or not, and the fee is charged on the full €60, VAT included.
The contribution margin formula
We use the European definition:
- Net revenue = order value − refunds − VAT
- CM1 = net revenue − product cost
- CM2 = CM1 − shipping and fulfillment − payment fees
- CM3 = CM2 − marketing
- Contribution margin ratio = CM1, CM2 or CM3 ÷ net revenue
Your accountant may book some of these costs somewhere else. If so, move the costs and keep the definitions. Payment fees and 3PL invoices are the usual suspects. Booked under general operating costs, they make CM2 look better than the orders ever were.
Contribution margin ratio, per unit and in total
Divide each level by net revenue to get the contribution margin ratio. Use net revenue rather than the €60. VAT and refunds were never income, and VAT rates differ across Europe, which makes a ratio on gross sales useless for comparing countries.
For a store, contribution margin per unit means per order. Total contribution margin for the month is that number times the orders you shipped.
We ran one month through 13 free calculators. Two got it right.
Before building ours, we wanted to see what was already out there.
We made up one month for a store: 2,500 orders at €80, one in ten returned, €30,000 of fixed costs. Then we typed it into 13 free contribution margin calculators the way a store owner would, with €80 as the price and €52 of product, shipping, fees and ads as the cost per order.
| True answer | Most common wrong answer | |
|---|---|---|
| CM3 for the month | €50,000 | €70,000 |
| Break-even | 1,500 orders | 1,072 orders |
Nine came out 40% or more too high. Most showed €70,000, and most of those with a break-even put it at 1,072 orders, about 430 too early.
Two got it right, and one of those only because we typed in sales after returns ourselves.
Twelve of the 13 had no field for returns, which means a month where one order in ten comes back looks exactly like a month where none do.
Ours has one. It also charges you for the shipping and payment fees a return doesn't give back.
Fix CM1 before you blame shipping or ads
CM1 is what the product earns at its price, before anyone packs, ships or advertises it. When CM1 is thin, no cheaper carrier or better campaign will rescue the order, and the fix belongs to whoever sets prices and buys stock: a higher price, a better purchase price or a different product mix.
One odd thing about CM1 as a percentage: it ignores your return rate.
Work out gross margin the lazy way, as if nothing ever came back, and you still get 64.3%. The refunded sale and the restocked product shrink together. Gross margin reads the same whether one order in ten comes back or one in three.
Returns show up in CM2
CM2 covers everything between the warehouse and the customer: the label, the carrier and the payment fee. You pay all three on every order, kept or returned.
A refunded order has already paid for its label and its fee, and neither comes back with the parcel. At a 10% return rate, about €0.79 of every order's shipping and fees goes on parcels that came back. CM2 slips from 48.7% to 46.9% of net revenue, while CM1 stays put.
In euros, the same 10% costs €3.24 an order: the margin on the refunded sales. CM3 falls from €10.54 with no returns to €7.30.
Your 3PL's price-increase email will be two paragraphs long. Add €1 per parcel and CM3 drops 14%, from a change worth less than 2% of the order. Put the new rate into the shipping field before you sign anything.
CM2 is your marketing budget
Bring this one to your next budget meeting.
CM2, €21.30 per order in the example, is the most marketing an order can pay for before CM3 hits zero.
ROAS is fine for comparing two ads that sell the same thing. For deciding how much to spend, we'd start from CM2 every time. The ROAS in Meta Ads Manager or Google Ads has never seen your shipping bill, and it usually doesn't know a tenth of those orders are on their way back.
To use CM2 in an ad account, turn it into a break-even ROAS. Then check which revenue the platform counts, because the answer depends on it:
| If the platform counts | Break-even ROAS | A 2.5x ROAS means |
|---|---|---|
| Order value incl. VAT, before returns (€60) | 2.82x | €24 of ads per order: losing money |
| Net revenue (€45.38) | 2.13x | €18.15 of ads per order: CM3 still positive |
Same ROAS. Opposite answers.
There's one more thing the calculator can't see on its own. It works with an average. If extra budget buys the next orders at, say, €25 each while the average sits at €14, those orders lose money and the average barely moves.
What is a good contribution margin?
A good CM3 pays your fixed costs and leaves something over. Only your store can set that line, and it takes one division.
Divide your monthly fixed costs (rent, salaries, software, your accountant) by your monthly orders. The result is what every order has to bring in at CM3 before the business makes a cent.
For the example store, €15,000 over 2,500 orders is €6.00 an order. CM3 is €7.30, and each order clears the bar by €1.30. Across 2,500 orders, the calculator puts operating profit at €3,245.
As a percentage, the bar sits at 13.2% of net revenue (€6.00 ÷ €45.38). Above it, the month makes money. Below it, the month loses money.
The bar moves with your order count. Rent and salaries don't shrink in a slow month, and every order you lose puts more on the ones you keep:
| Orders a month | Fixed costs per order | Left from a €7.30 CM3 | Operating profit |
|---|---|---|---|
| 2,500 | €6.00 | €1.30 | €3,245 |
| 2,200 | €6.82 | €0.48 | €1,056 |
| 2,000 | €7.50 | −€0.20 | −€404 |
A 20% dip in orders turns the same margin into a loss.
A CM3 percentage can also look fine and hide a problem. Add €1 to shipping and CM3 falls to 13.9%. The calculator still calls that Healthy. Against this store's 13.2% bar, there's 0.7 points of room left, and operating profit drops from €3,245 to €745.
Same verdict. Three-quarters of the profit gone.
Contribution margin vs gross margin
Gross margin stops at the product, which makes it roughly CM1. Shopify's profit report works the same way: gross profit is net sales minus the cost of the units sold. Use gross margin to price a product. To decide what you can spend to sell one, you need contribution margin, because it takes off every cost that comes with an order and gross margin takes off only the first. Profit margin goes one step further and also takes off fixed costs like rent and salaries.
Count the orders that pay your fixed costs
Fixed costs divided by CM3 per order, rounded up, is your break-even point.
With €15,000 of fixed costs a month, the calculator's answer is 2,056 orders. Put that next to this month's order count in Shopify. It tells you more about the month than revenue does.
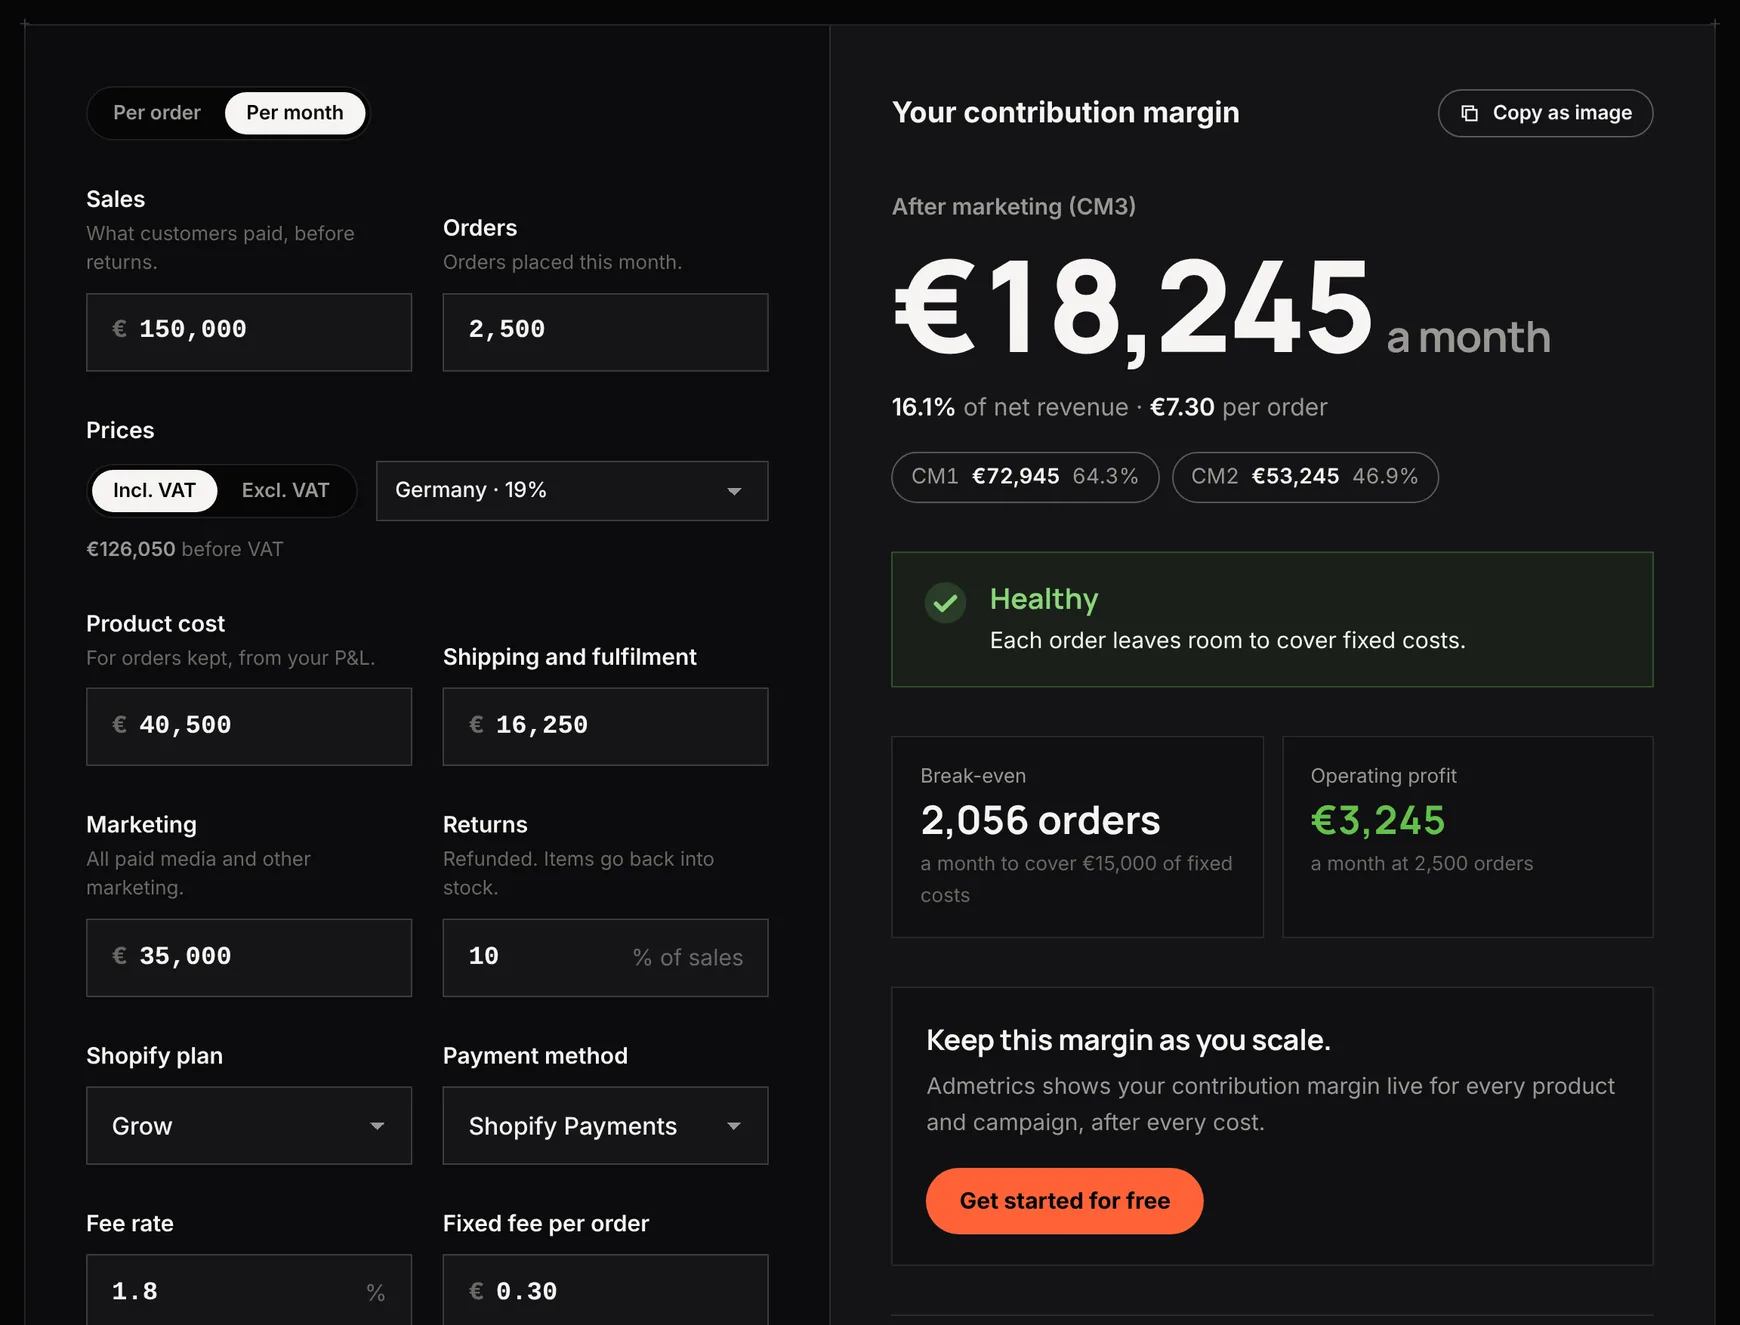
Fixed costs also lower your marketing ceiling. With €6 of them on every order, the most you can spend on marketing drops to €15.30 per order, and your break-even ROAS on the €60 rises from 2.82x to 3.92x. Both get worse whenever order volume drops.
What this calculator can't tell you
It looks at one average order, and no real store has one.
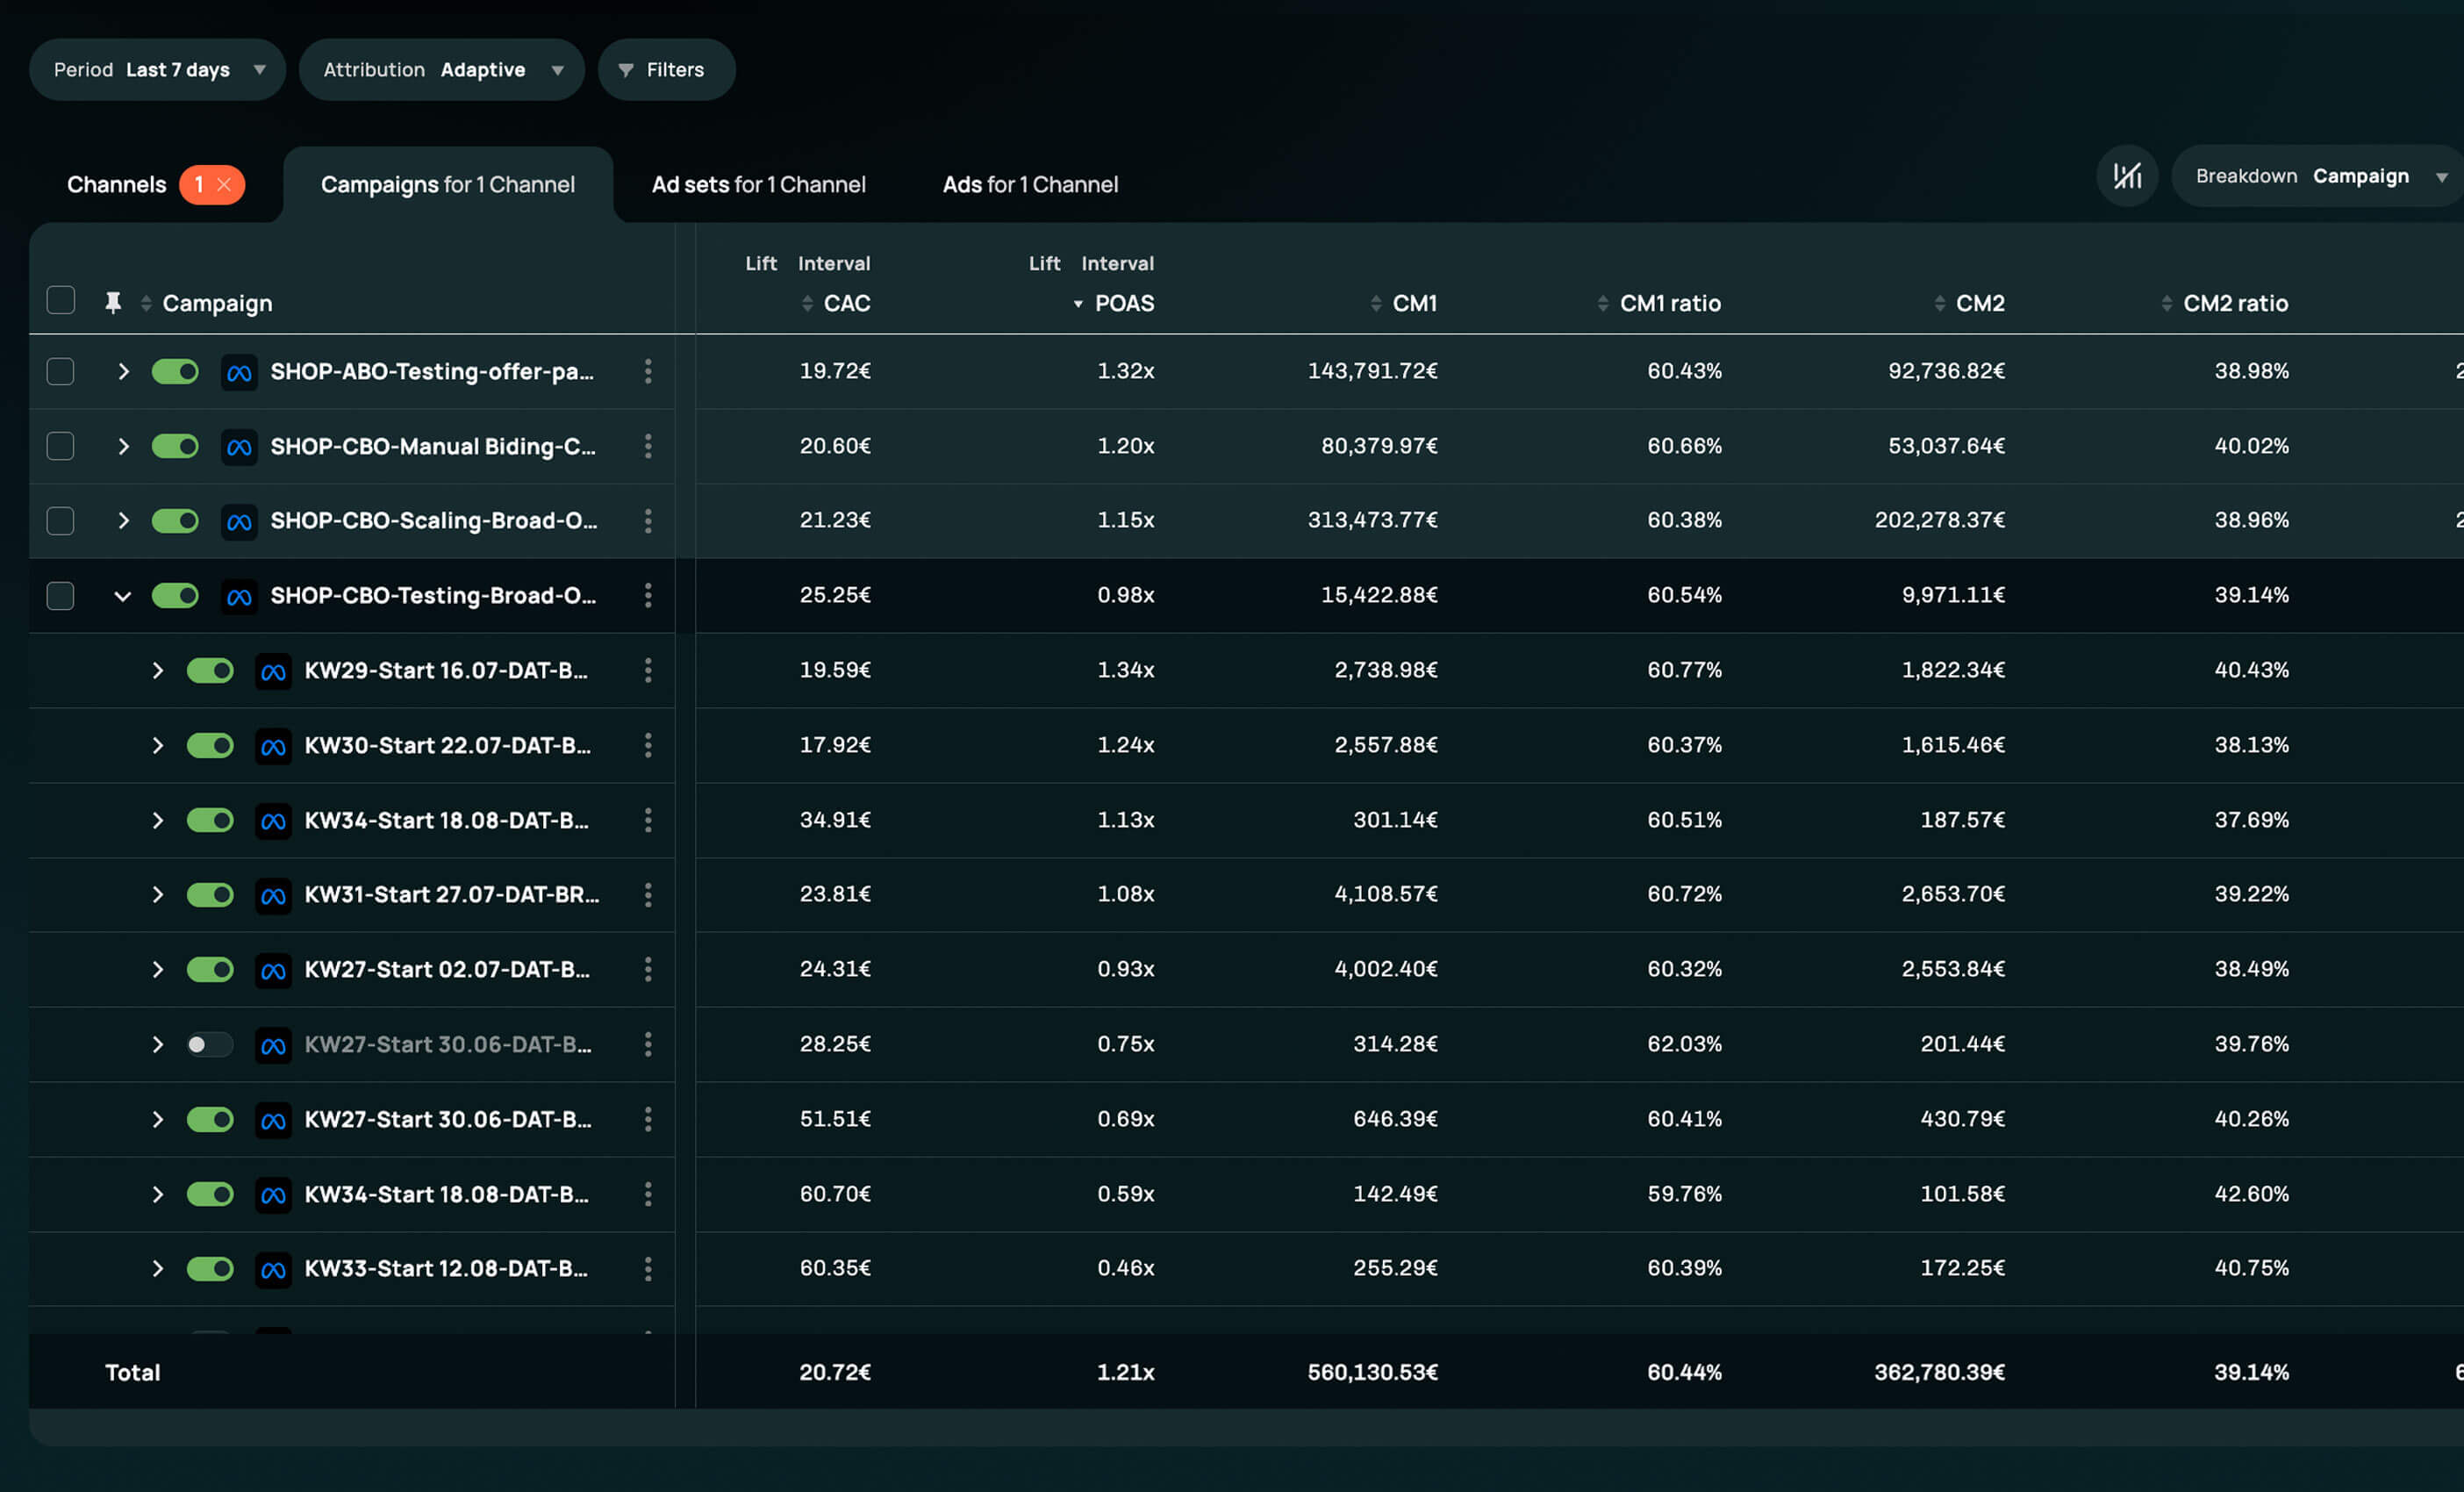
Marketing cost per order blends cheap repeat orders with expensive first ones, while in reality channels and campaigns end up with very different CM3s that the average mixes into one. It also hides the products that lose money behind the ones carrying them. And it only counts the first order, not the customer's second or third, and a first order in the red might still pay off later once they come back.
Admetrics calculates CM2 and CM3 per product, channel and campaign from your real order and cost data, and shows which ones pull the average down.
FAQ
What is contribution margin?
What a sale leaves after the costs that come with it, before fixed costs like rent and salaries. For an online store, that's net revenue (after VAT and refunds) minus product cost, shipping, payment fees and marketing. In the calculator's example, a €60 order leaves €7.30.
How do you calculate contribution margin?
Take refunds and VAT off the order value to get net revenue. Subtract product cost for CM1, shipping and payment fees for CM2, and marketing for CM3. Divide each by net revenue for the ratio. In the €60 example: €45.38 of net revenue, then €29.18, €21.30 and €7.30.
What is a good contribution margin for an online store?
One that covers your fixed costs with room to spare, which makes the answer specific to your store. Divide monthly fixed costs by monthly orders to get the CM3 each order has to clear. For a store with €15,000 of fixed costs and 2,500 orders, the line is €6.00 an order, or 13.2% of net revenue. Below it, the month loses money.
Is contribution margin the same as gross margin?
No. Gross margin stops at product cost, close to CM1. Contribution margin keeps going through shipping, payment fees and marketing. In the example, the order has €29.18 left after product cost and €7.30 after everything else. Gross margin also reads the same at any return rate, which flatters stores with lots of returns.
Should marketing be included in contribution margin?
Yes, at its own level. CM2 is the margin before marketing and CM3 after it. Kept apart, they answer two questions: how much marketing an order can carry (€21.30 in the example) and whether the marketing you run pays for itself (€7.30 left). Fold them together and you lose the first.
Should contribution margin include VAT?
No. VAT belongs to the tax office and comes out before anything else. Pick your country and the calculator removes it: €8.62 on the example's €54 of kept sales. The one place VAT still bites is the payment fee, which is charged on the full €60.
How do returns affect contribution margin?
Twice. The refund removes the sale, and the shipping and payment fee on that order are already spent. The product goes back into stock, and its cost only counts on kept orders. In the example, 10% returns take CM3 from €10.54 to €7.30, €3.24 on every order.
Can contribution margin be negative?
Yes. CM3 goes negative once marketing per order costs more than CM2, above €21.30 in the example, and the calculator says "You're losing money". A negative CM1 or CM2 is worse. The order loses money before any ad is paid for, and selling more makes it worse.
Silvana Chirita writes about ecommerce measurement for Admetrics. Last updated 8 October 2026.