Your ad platform hands you a ROAS every morning. On its own, that number can't tell you where the next euro should go.
A 4.00x can leave one store €34,000 of profit and cost another €20,000. The difference sits in costs the platform never sees: returns, product cost, shipping, payment fees and VAT. This calculator works out ROAS on a clean basis, then takes it down to profit, break-even and a target you can set in Google Ads or Meta. Use it once per campaign or channel and you have what you need to move budget.
It's free, there's no signup, and it runs in your browser.
How to use the ROAS calculator
Start on the ROAS tab with two numbers from one ad account and one date range: what you spent, and the revenue the platform credits to those ads.
The other three tabs reuse those numbers and add your costs. POAS asks for gross margin, shipping and fees, and return rate, and shows what the ads left you in euros. Break-even ROAS turns the same costs into the lowest ROAS that doesn't lose money. Target ROAS turns the profit you want to keep into the number you give Google or Meta.
You type each number once and it carries across the tabs. If you don't know your exact return rate or fee share, leave the defaults in for a first answer and come back to them.
For budget decisions, run it once per campaign or channel with that campaign's own margin. A campaign selling discounted bestsellers and one selling full-price new arrivals shouldn't share a break-even.
How to calculate ROAS
ROAS is revenue from ads divided by ad spend.
ROAS = revenue from ads ÷ ad spend
Spend €50,000, get €200,000 of credited revenue back, and your ROAS is 4.00. You'll see it written as 4.00x, 400% or 4:1, and all three mean €4 of revenue for every €1 of ads. Google Ads takes target ROAS as a percentage, and Meta Ads Manager reports ROAS as a multiple.
Use the same revenue, date range and VAT basis
The division is the easy part, and most bad ROAS calculations come from the inputs. Take spend and revenue from the same platform for the same days, because Meta's 7-day attributed revenue divided by a monthly invoice gives you a number that describes nothing. Keep agency fees and creative production out of ad spend as well. They're real costs, but mixing them in makes one account's ROAS impossible to compare with the next.
Then check VAT.
Many EU stores send order values to Meta and Google with VAT included. At 19% VAT, €200,000 of platform revenue is €168,067 once the tax office has had its share, and the 4.00x you've been reporting is 3.36x. The Incl. VAT switch under More options strips it out before anything else is calculated.
What is a good ROAS?
One that's above your break-even. A ROAS can only be good or bad against your own costs, which is why the same 4.00x can be very profitable for one store and lose money for another in the same category.
Two illustrative stores, both spending €50,000 and both credited with €200,000:
| Store A | Store B | |
|---|---|---|
| Gross margin | 60% | 40% |
| Shipping & fees | 12% | 15% |
| Returns | 10% | 25% |
| ROAS | 4.00x | 4.00x |
| Profit after ad spend | +€34,000 | −€20,000 |
Same ROAS, €54,000 apart.
Store B's ads aren't the problem. It sells lower-margin products, a quarter of its sales come back, and it pays more for shipping and fees on every order. No change in the ad account fixes that, and any budget rule built on "4x is good" would tell Store B to spend more.
Break-even ROAS: the lowest ROAS that doesn't lose money
Below your break-even ROAS, every extra euro of ad spend loses money. Above it, you keep something. Break-even is the point where the revenue from your ads exactly covers the cost of delivering those sales plus the ads themselves.
How to calculate break-even ROAS
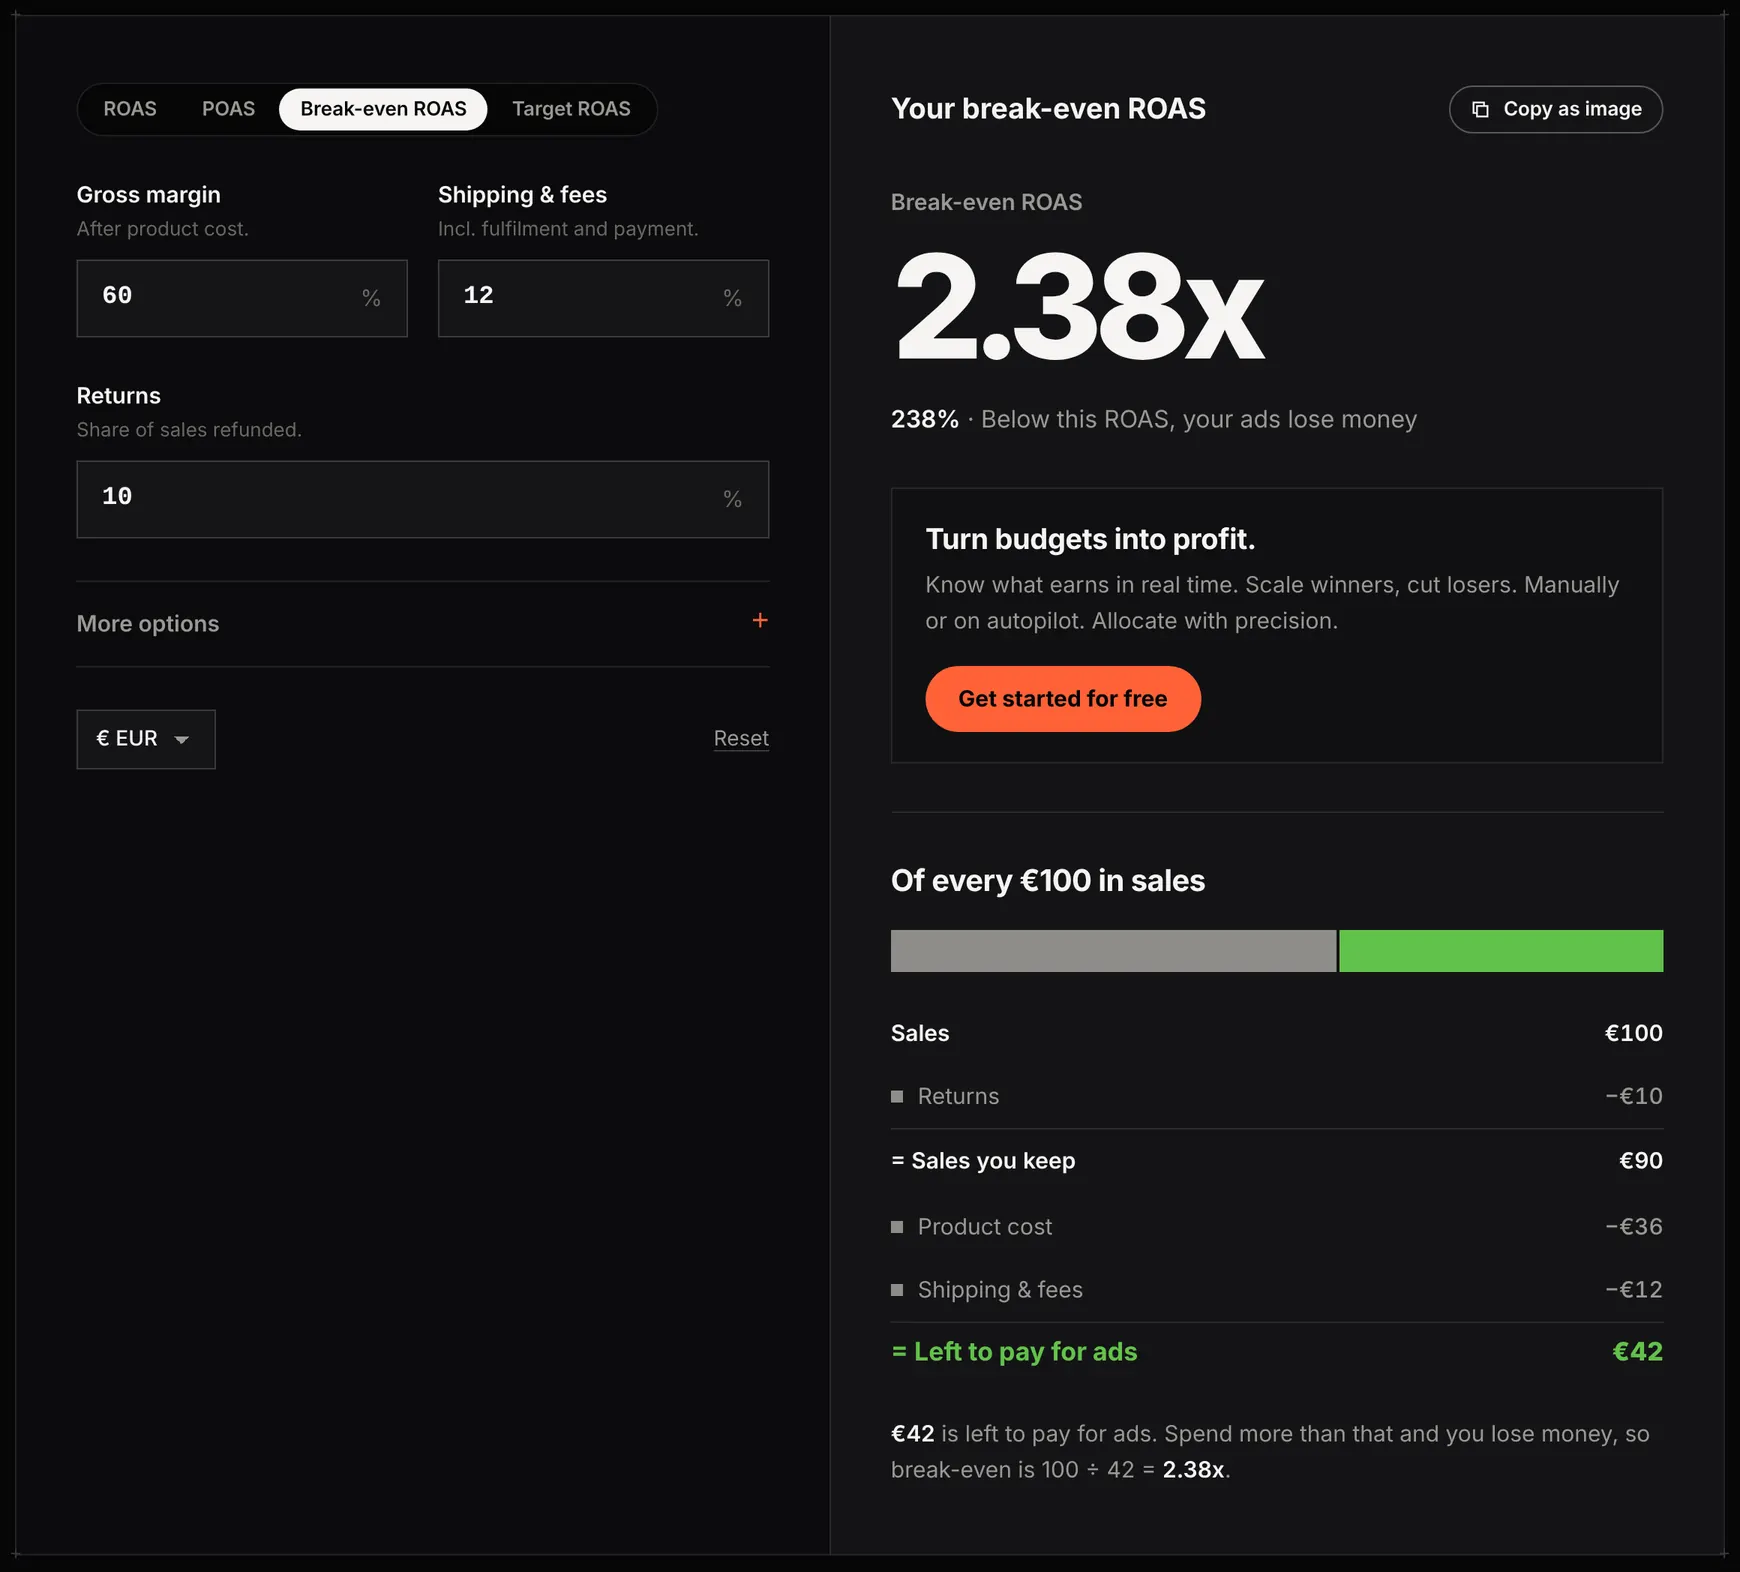
Follow €100 of reported sales down to what's left for advertising. With the calculator's default inputs (60% gross margin, 12% shipping and fees, 10% returns):
| Of every €100 in sales | |
|---|---|
| Sales the platform reports | €100 |
| − Returns (10%) | €10 |
| − Product cost on the €90 you keep (40%) | €36 |
| − Shipping & fees (12%) | €12 |
| = Left to pay for ads | €42 |
You break even when €100 of sales costs €42 in ads, which is a ROAS of 100 ÷ 42 = 2.38x.
Break-even ROAS = 1 ÷ share of revenue left after costs
The common shortcut is 1 ÷ gross margin, which gives 1.67x here because it leaves out shipping, fees and returns. Add fees but skip returns and you get 2.08x.
To see how often calculators take those shortcuts, in September we typed one store's numbers into 20 free ROAS calculators the way a store owner would: €50,000 of spend, €200,000 of revenue, a 60% margin, 12% other costs and 10% returns. Eight of them showed a break-even, and every one of the eight landed on 1.67x or 2.08x, with none counting returns, fees and VAT together.
If you've been using one of those floors to decide where budget goes, campaigns running between about 1.7x and 2.4x have looked safe while losing money.
How a discount moves your break-even
A sale changes the €42. Take an illustrative €100 product with a €40 product cost and €12 of shipping and fees per order, 10% returns, and the ads still bringing in €200,000 at sale prices on €50,000 of spend:
| Discount | Break-even ROAS | Target for 10% profit | Profit at 4.00x |
|---|---|---|---|
| None | 2.38x | 3.13x | €34,000 |
| 10% | 2.73x | 3.75x | €23,333 |
| 20% | 3.33x | 5.00x | €10,000 |
| 25% | 3.85x | 6.25x | €2,000 |
| 30% | 4.67x | 8.75x | −€7,143 |
The ROAS in the ad account can read 4.00x all week while profit falls from €34,000 to €10,000 at 20% off. Because the calculator has no discount field, enter the sale's margin instead: (sale price − product cost) ÷ sale price, which is 50% for this product at 20% off. Shipping becomes a larger share of a smaller order too (€12 on €80 is 15%). For what a discount does to a single order, the discount profit calculator works it out.
Turn ROAS into profit before you move budget
ROAS stops counting at revenue. POAS (profit on ad spend) keeps going until the order costs are paid, and it's the number to compare when you decide where money goes.
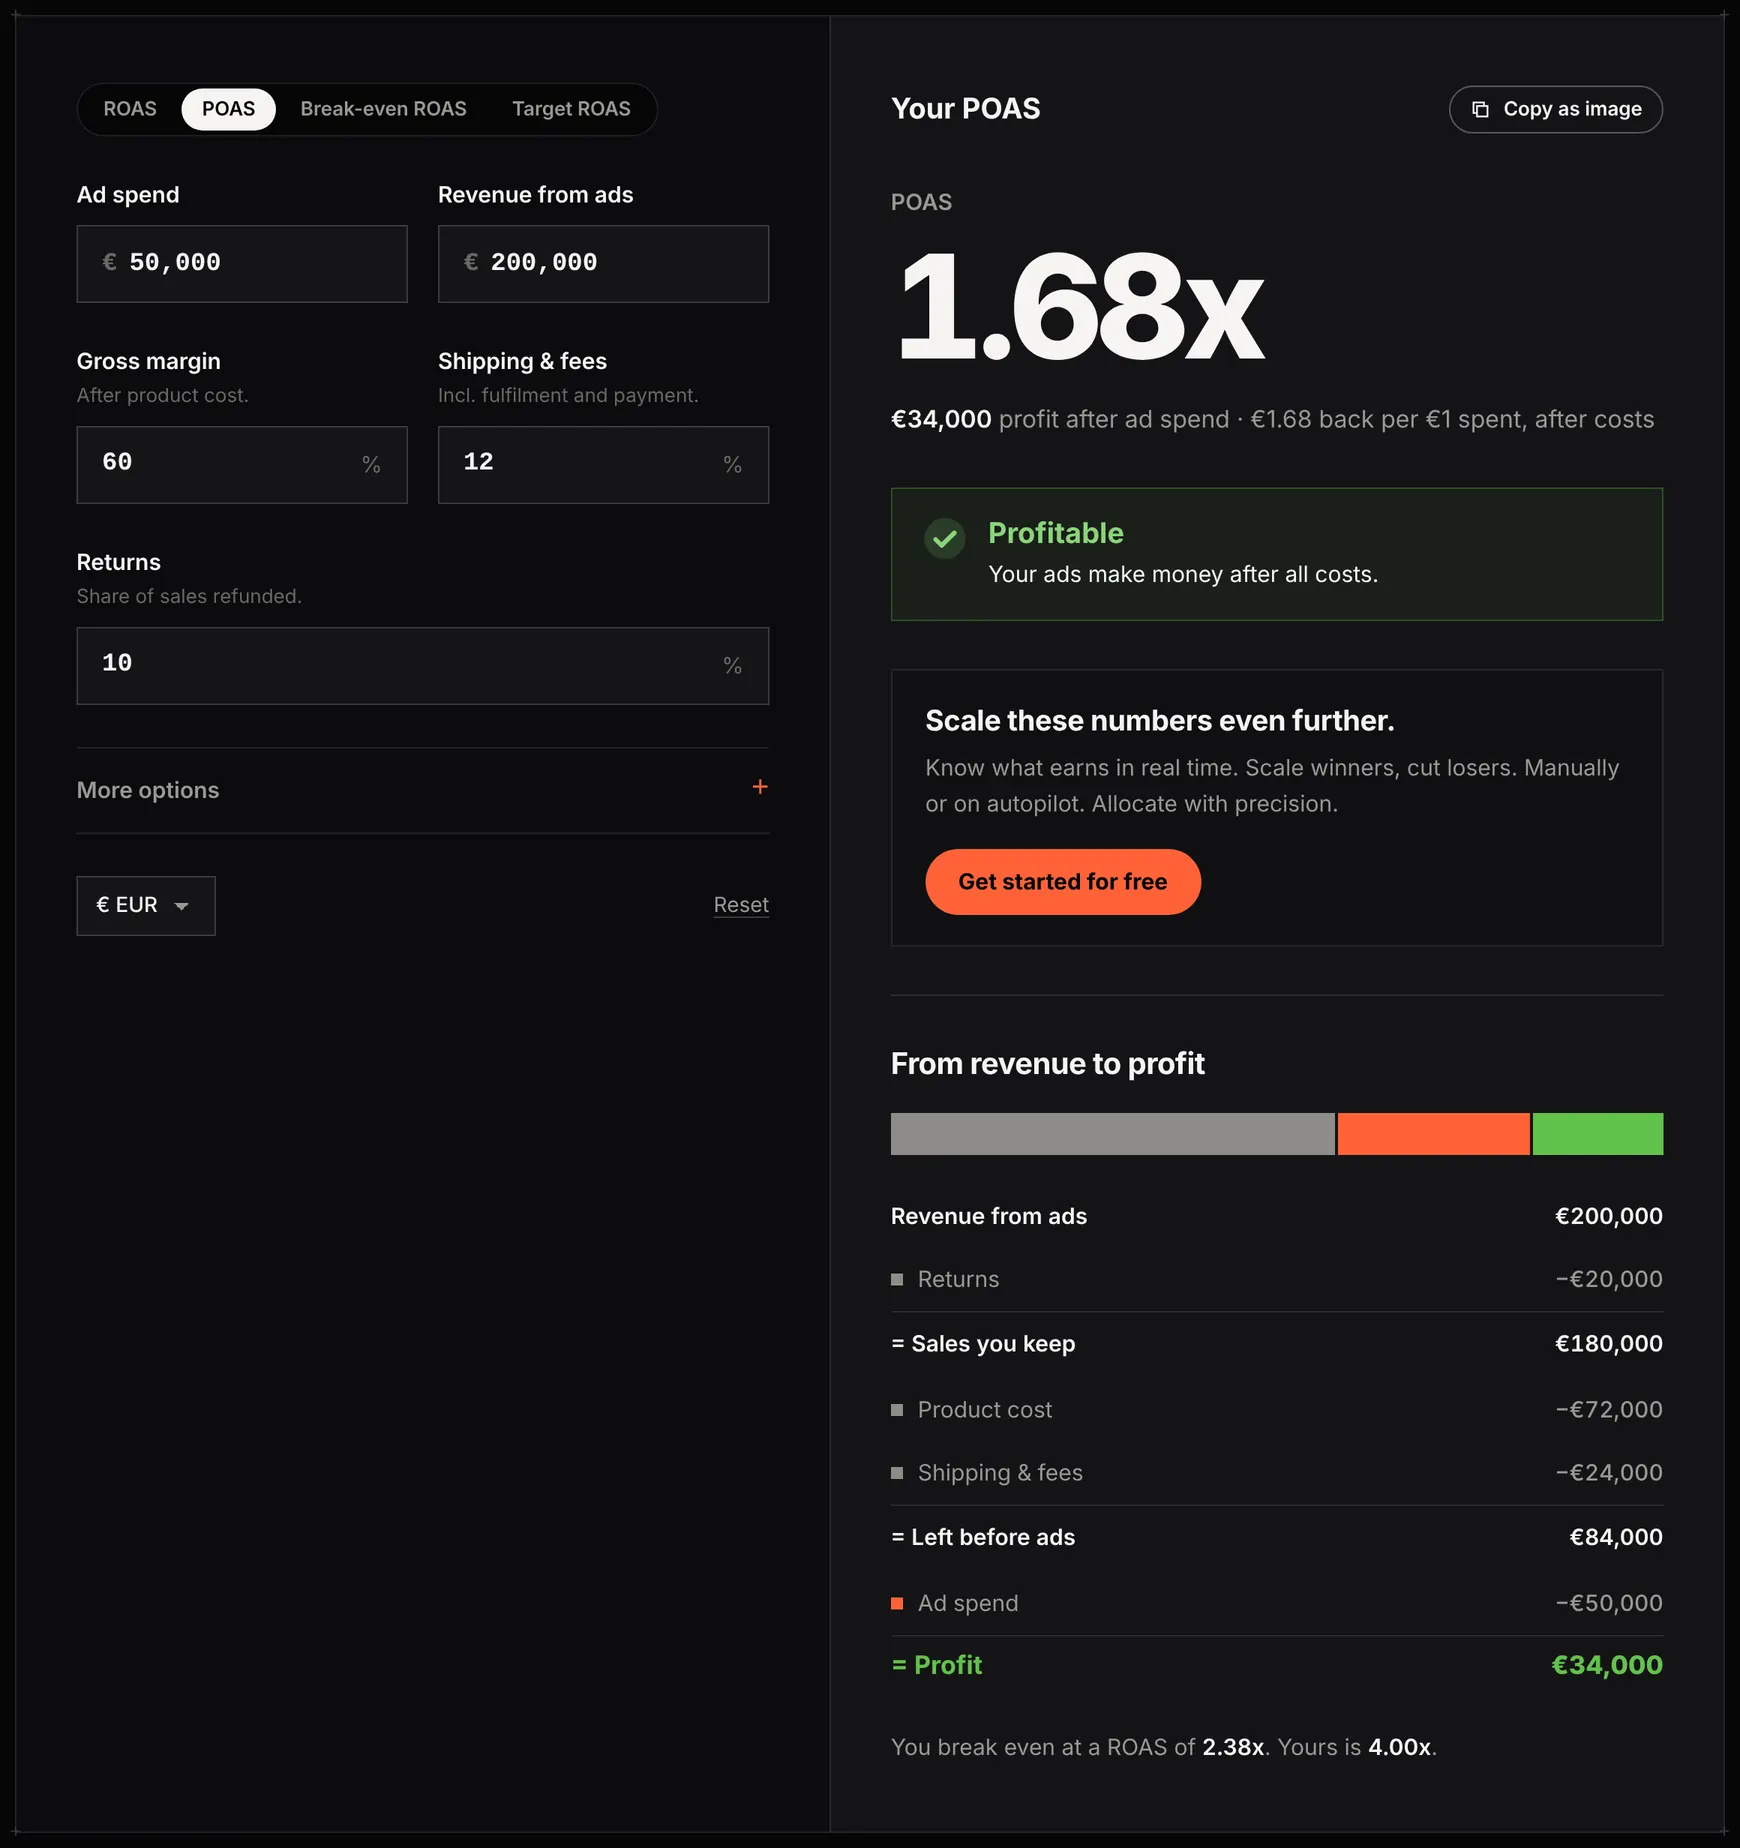
The calculator's default example, carried all the way down:
| From revenue to profit | |
|---|---|
| Revenue from ads | €200,000 |
| − Returns | €20,000 |
| = Sales you keep | €180,000 |
| − Product cost | €72,000 |
| − Shipping & fees | €24,000 |
| = Left before ads | €84,000 |
| − Ad spend | €50,000 |
| = Profit | €34,000 |
A 4.00x ROAS here is a 1.68x POAS: €1.68 back for every €1 of ads once the order costs are paid. Above 1.00 the ads made money; below it they didn't.
The result rests on four assumptions we built into the calculator:
- Returned items go back into stock, so a return counts as a sale that didn't happen.
- Product cost applies only to the sales you keep.
- Shipping and fees are a share of revenue.
- With Incl. VAT switched on, VAT comes out of the platform revenue first.
If you write off returned stock instead of reselling it, your real break-even is higher than the one shown.
Move budget to the campaign that leaves more profit
ROAS is fine for comparing two ad sets that sell the same product, because the costs underneath are identical. Once the products differ, we'd compare POAS every time.
Two illustrative campaigns in one store, each spending €20,000 a month, both with 12% shipping and fees and 10% returns:
| Campaign X: discounted bestsellers | Campaign Y: full-price range | |
|---|---|---|
| Gross margin | 45% | 65% |
| ROAS | 4.00x | 3.00x |
| Revenue | €80,000 | €60,000 |
| Break-even ROAS | 3.51x | 2.15x |
| POAS | 1.14x | 1.40x |
| Profit after ad spend | €2,800 | €7,900 |
The campaign with the lower ROAS leaves almost three times the profit.
Ranked by ROAS, X gets the next budget increase. Ranked by how far each sits above its own break-even, Y does: X runs 14% above its break-even and Y runs 40% above. Run each campaign through the POAS tab with its own margin and the order you'd shift money in usually changes.
Check the ROAS of the extra spend before you scale
A healthy account ROAS can hide a budget increase that loses money. Each extra euro usually reaches people who are less likely to buy, and the account average is held up by everything you were already spending.
So for a budget decision, calculate ROAS on the change:
ROAS of extra spend = extra revenue ÷ extra spend
An illustrative store raises its budget from €50,000 to €70,000, with the calculator's default costs:
| Month 1 | Month 2 | The extra spend | |
|---|---|---|---|
| Ad spend | €50,000 | €70,000 | €20,000 |
| Revenue from ads | €200,000 | €238,000 | €38,000 |
| ROAS | 4.00x | 3.40x | 1.90x |
| Left before ads (42% of revenue) | €84,000 | €99,960 | €15,960 |
| Profit after ad spend | €34,000 | €29,960 | −€4,040 |
The account ROAS fell to 3.40x, still well above the 2.38x break-even, and nobody looking at the dashboard would flag it. The extra €20,000 ran at 1.90x and cost €4,040 of profit while revenue grew by €38,000.
To check your own last increase, enter the difference in spend and the difference in revenue on the ROAS tab, then compare the result with your break-even. Before approving more budget, that's the first number we'd ask for. Compare like periods, though: a launch or a sale in month 2 will flatter it.
Set a target ROAS from the profit you want to keep
A target ROAS is how you hand an allocation decision to Google or Meta. Both bid toward it on average, which means the target sets how far the platform scales before it slows down.
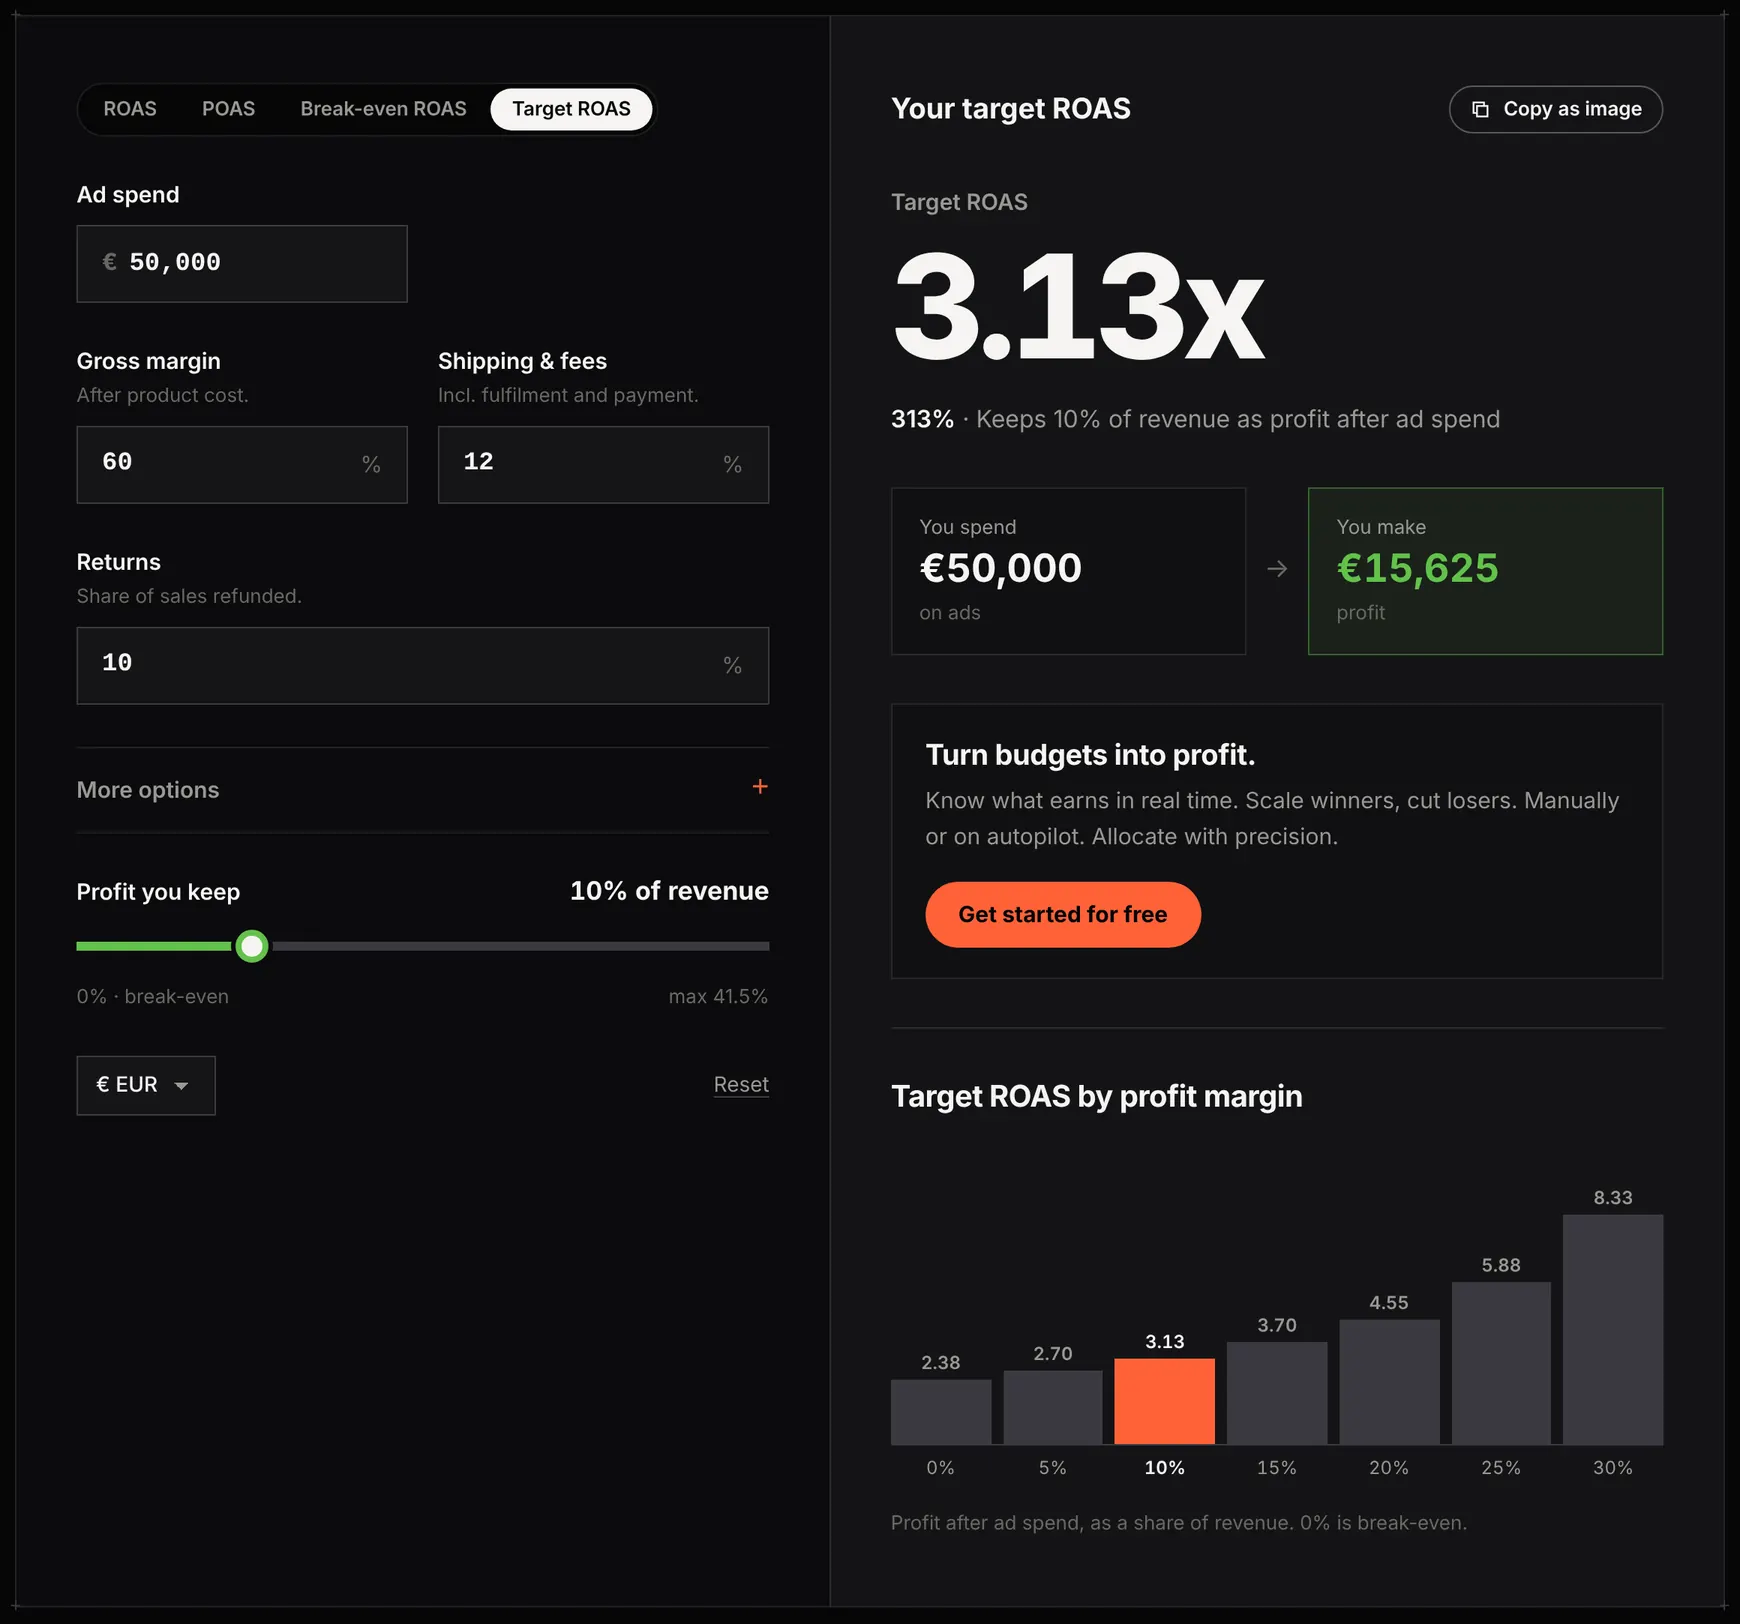
Choose the profit first and the target follows. With the default inputs, 42% of revenue is left after costs:
Target ROAS = 1 ÷ (share left after costs − profit share)
| Profit you keep (share of revenue) | Target ROAS |
|---|---|
| 0% (break-even) | 2.38x |
| 5% | 2.70x |
| 10% | 3.13x |
| 15% | 3.70x |
| 20% | 4.55x |
| 25% | 5.88x |
| 30% | 8.33x |
The target climbs slowly, then fast. Keeping 10% of revenue needs 3.13x, which means €156,250 of revenue on €50,000 of spend and €15,625 left over. Keeping 30% needs 8.33x, which very few ads reach. The Target ROAS tab warns you above 10x and won't let you ask for more profit than your costs leave.
The profit here is before fixed costs such as salaries, rent, software and the agency retainer. If those run at an illustrative 12% of revenue, a 12% profit share is where the business as a whole breaks even, and the target for that is 3.33x.
In Google Ads or Meta, set the target on the same revenue basis the platform uses. If Meta's purchase values include 19% VAT, a target that keeps 10% of that VAT-inclusive revenue rises from 3.13x to 3.95x.
What this calculator can't tell you
Everything above treats the revenue your ad platform reports as real and caused by the ads. For allocation, those are the two weakest assumptions.
Platforms claim the same sale. A customer who clicks a Meta ad and later a Google ad can count in both, and the revenue the platforms report often adds up to more than your store recorded. Credited isn't caused either. Because retargeting and branded search pick up buyers who were already on their way, their ROAS looks excellent, and a budget rule that follows platform ROAS keeps feeding them.
Refunds don't come off the platform's numbers. Meta's pixel has no standard refund event, and a purchase keeps its credit after the order is refunded in your store, which is why the returns line in the calculator matters.
Fixed costs and repeat purchases sit outside the calculation. Salaries and software come out of the profit shown here, and a first order that only breaks even can still pay off if the customer comes back.
Treat the result as the best case for that spend. Admetrics works out profit per campaign and channel from your real orders and costs, counting each sale once across platforms, which lets budget follow what the ads actually earn.
FAQ
How do you calculate ROAS?
Divide the revenue your ads brought in by what you spent on them. €200,000 of credited revenue on €50,000 of spend is a ROAS of 4.00x, also written 400% or 4:1. Use the same date range and the same source for both numbers, and check whether the revenue includes VAT.
Is a 2.5 ROAS good?
Only if your break-even is below 2.5. With a 60% gross margin, 12% shipping and fees and 10% returns, break-even is 2.38x, and a 2.5x keeps about 5 cents per euro of ad spend. With a 40% margin, the same 2.5x loses money. Put your own costs into the POAS tab to see which side you're on.
What does 4:1 ROAS mean?
You got €4 of revenue for every €1 you spent on ads, the same as 4.00x or 400%. On its own it says nothing about profit. At the calculator's default costs, a 4:1 leaves €0.68 of profit per euro of spend after product cost, shipping, fees and returns.
Is 200% ROAS good?
For most ecommerce brands, no. A 200% ROAS (2.00x) is €2 of revenue per €1 of ads, and it only breaks even if at least half of every sale is left after returns, product cost, shipping and fees. At the default inputs only 42% is left, and 200% loses about 16 cents per euro spent.
What ROAS is 25% ACoS?
4.00x. ACoS (advertising cost of sale, used on Amazon) is ad spend divided by revenue, the inverse of ROAS. To convert either way, divide 1 by the number: 1 ÷ 0.25 = 4.
What is the difference between ROAS and ROI?
ROAS compares revenue with ad spend. ROI compares profit with the full cost of an investment. A campaign can have a 4x ROAS and a low ROI once product cost, shipping, returns and other costs are counted. POAS sits between the two: profit after order costs, per euro of ads.
What is the difference between ROAS and POAS?
ROAS divides revenue by ad spend. POAS divides what's left after returns, product cost, shipping and fees by ad spend. In the calculator's default example, a 4.00x ROAS is a 1.68x POAS. Above 1, the ads made money. Below 1, they didn't.
How do you use ROAS for budget allocation?
Compare each campaign's ROAS with its own break-even, which depends on the margin of what it sells. Move budget toward the campaigns that sit furthest above it, and check the ROAS of any extra spend (extra revenue ÷ extra spend) before scaling further. Platform ROAS overstates retargeting and branded search; treat their numbers with care.
Should break-even ROAS include VAT?
Calculate it on the same basis your ad platform reports revenue. If Meta or Google receive order values including VAT, either strip the VAT out first or raise your break-even to match. At 19% VAT, the default 2.38x break-even becomes 2.83x on VAT-inclusive revenue.
Why is my ROAS different in Meta, Google and Shopify?
Each one counts something different. Meta and Google credit sales to their own ads within their own attribution windows, and both can claim the same order. Shopify only records orders and doesn't know which ad caused them. Refunds, VAT and the date a sale is credited also differ between them.
Silvana Chirita writes about ecommerce measurement for Admetrics. Last updated 9 October 2026.