If you spend six figures a month across Meta, Google and TikTok, you already know the platform numbers don't add up. In our onboarding data, platform-claimed conversions routinely exceed store orders; at SugarGang it was four or five claims per order. This guide is about what to do with that gap: how to build a number you can defend in a budget meeting, where each method breaks, and how to turn the answer into a budget move.
It draws on what we see across more than 100 brands on the platform and on nine recorded customer interviews, from founder-led shops to The Quality Group, the company behind ESN and More Nutrition, which processes more than 200,000 orders on a Black Friday.
Key takeaways
- Your platforms will claim more orders than your store recorded. After iOS 14, SugarGang saw four or five platforms each claim a purchase that appeared once in Shopify. Each platform counts every conversion inside its own window, with no knowledge of the others.
- Meta changed what counts as a conversion twice in 2026, removing the longer view windows in January and redefining a click in March. Campaigns paused over the resulting drops were paused on bad information.
- Last-click reporting quietly reallocates your budget toward branded search, retargeting and email. At ESN and More Nutrition, separating new from existing customers in every budget decision was the largest single lever, and CAC fell 70%.
- Revenue rankings mislead. Rank on contribution margin. A campaign at 4x ROAS on a 22% margin loses money; one at 2.5x on a 48% margin makes it. The worked example below shows the ranking flip.
- Better conversion data changes delivery. In a controlled Meta test, Ehrenkind's server-side pixel produced 60.3% higher ROAS and 25.2% lower cost per order than the shop's own pixel.
- Attribution cannot establish cause. It records what preceded a purchase. To find out whether a channel caused anything, move its budget and watch revenue.
- Average ROAS is the wrong number for a budget meeting. It reports what a channel has returned so far. You need to know what the next €1,000 will return, and on a saturated channel those figures are nowhere near each other.
What is marketing attribution?
Marketing attribution connects a completed order back to the interactions that preceded it, then divides the credit between them according to a defined rule.
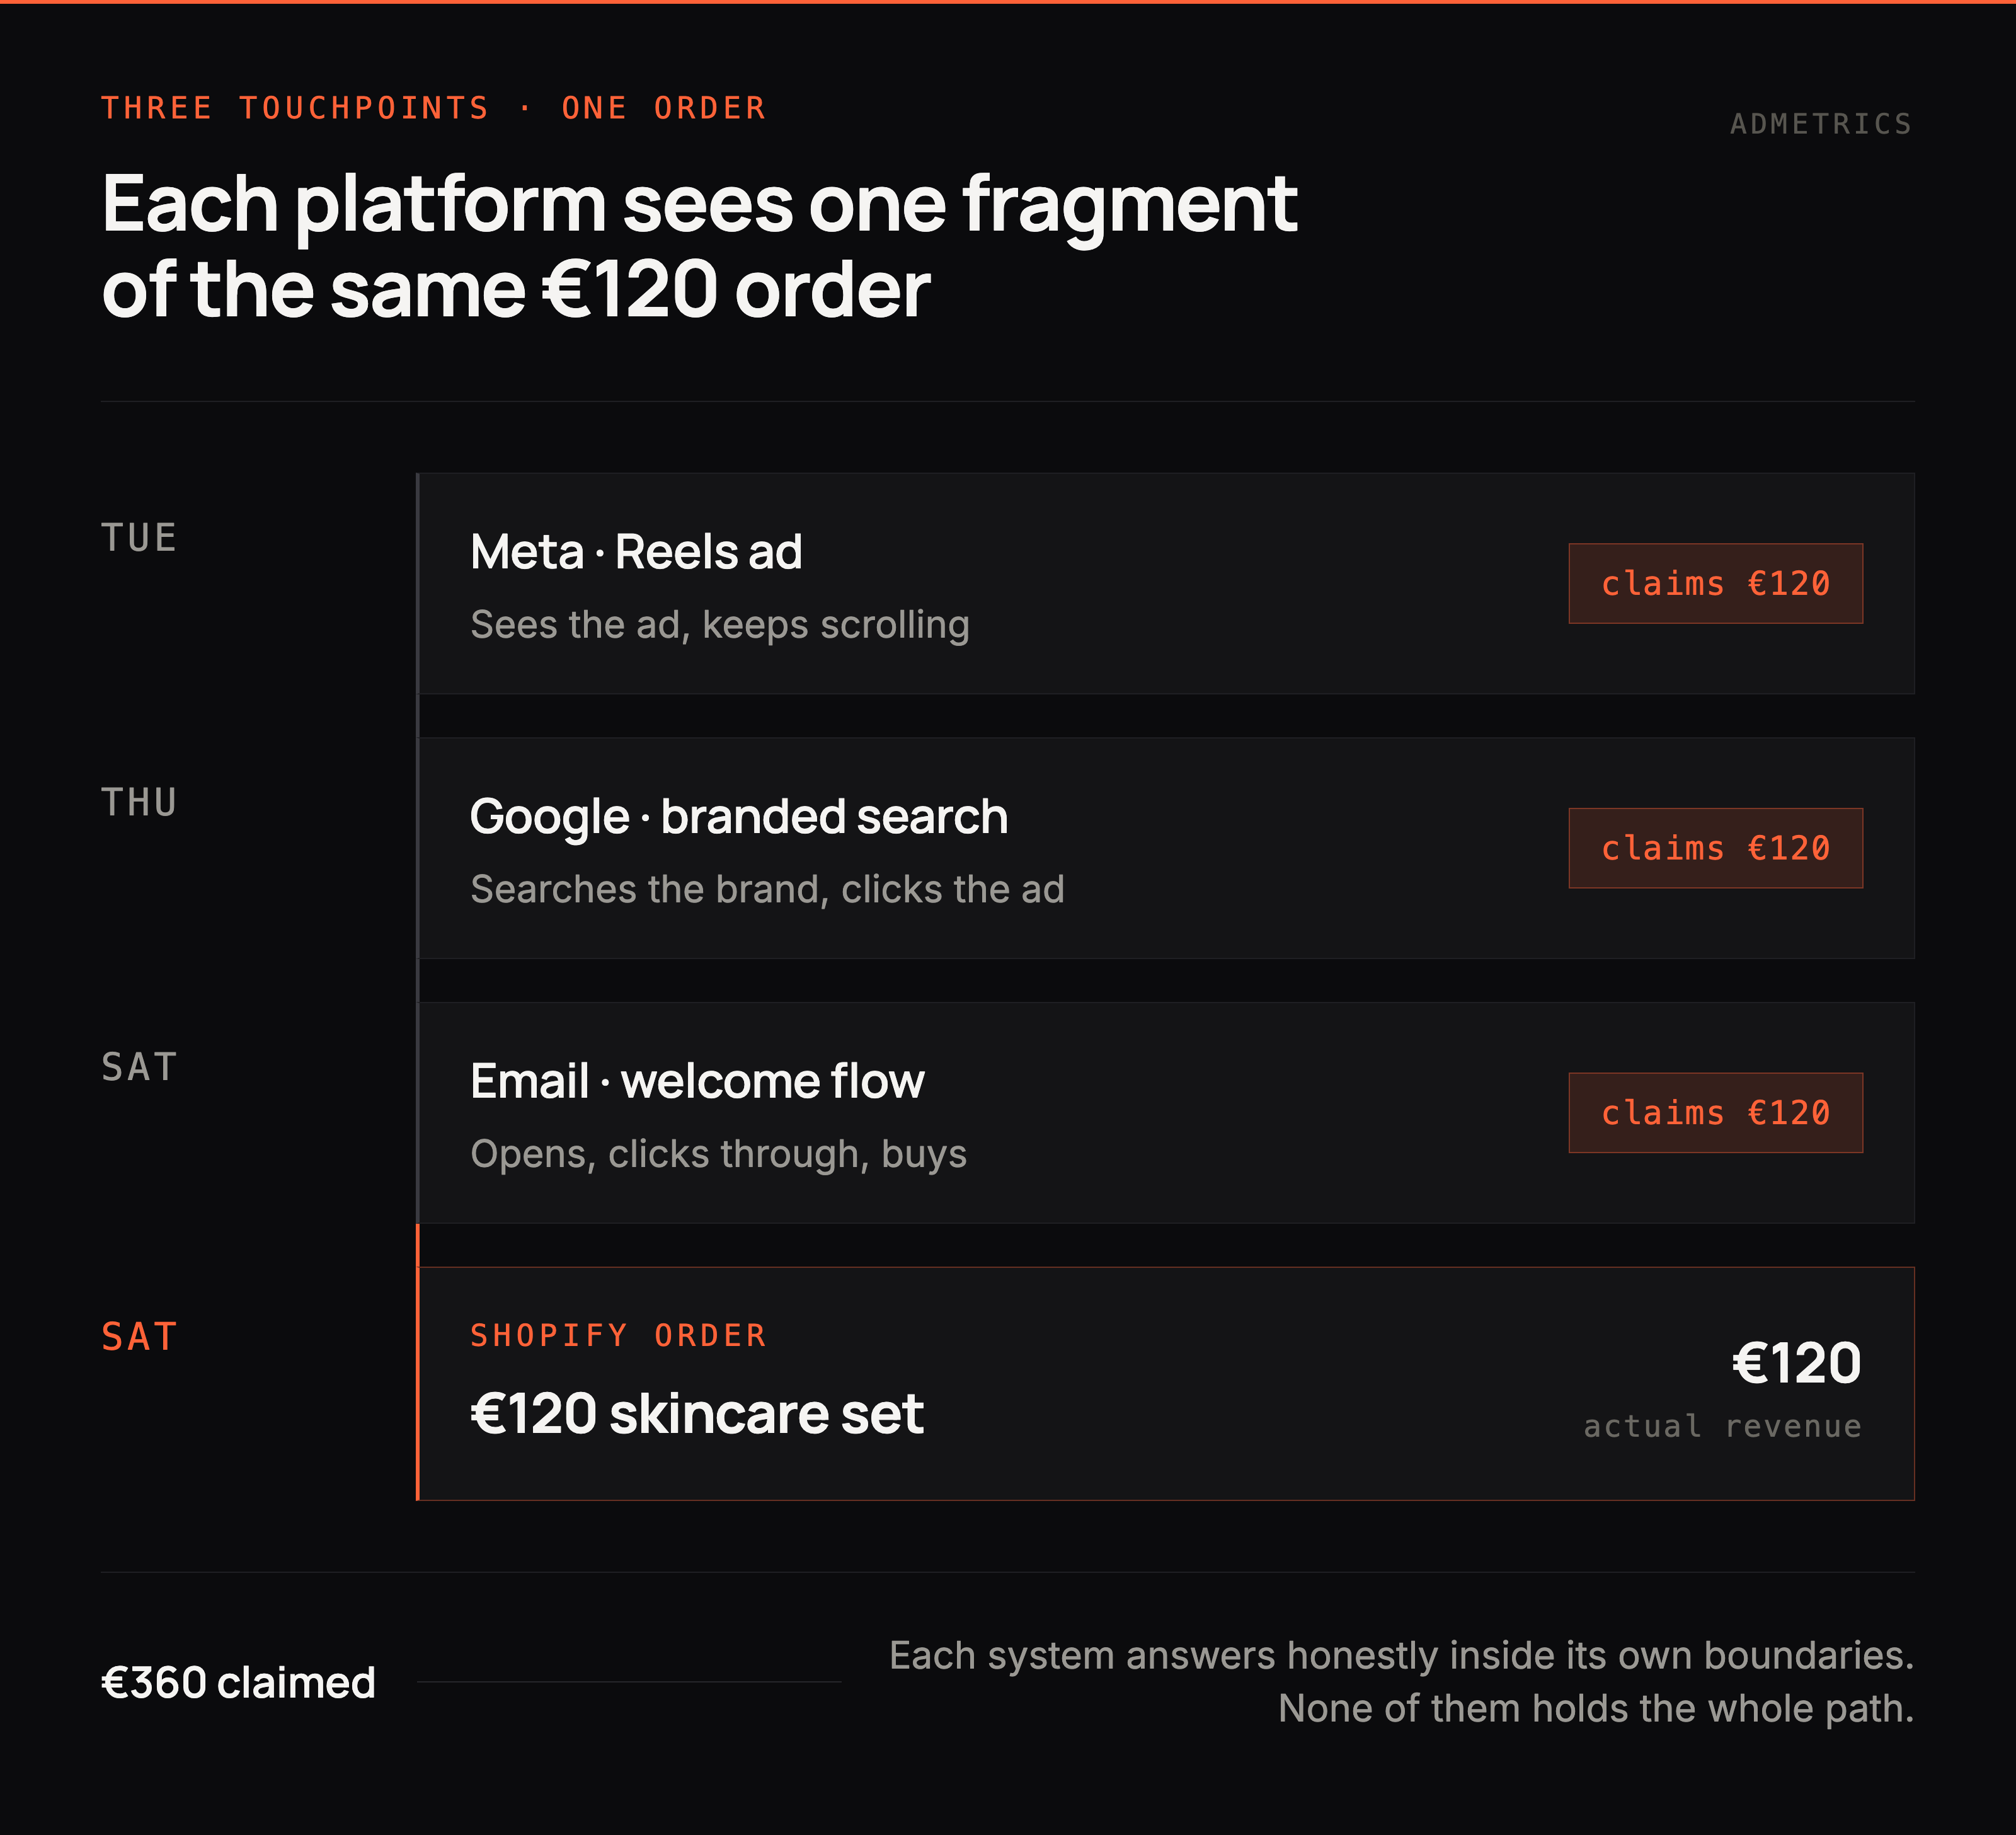
Take one order. A customer sees a Reels ad on Tuesday, searches your brand on Thursday and clicks a Google ad, then buys a €120 set on Saturday from your welcome email. Meta, Google Ads and Klaviyo will each report that sale as theirs, and each is answering honestly within its own boundaries. This is not a hypothetical edge case. SugarGang's performance team described the post-iOS 14 version plainly:
"In every single tool there was a purchase, but in the Shopify backend, instead of four or five purchases, only one was visible."
That gap is why attribution analytics exists as a discipline: to build one view of the customer journey that no platform can produce alone, then apply one consistent rule to it. Every sale attribution decision after that, from which creative to scale to which channel to cut, rests on that view.

Why platform numbers never reconcile
Add up the conversions your platforms claim and the total will usually exceed the orders in your store. This is not fraud. Each platform's conversion attribution counts every conversion inside its own window, with no knowledge of the others, and each has a commercial interest in a generous window. The platforms selling you the media also grade their own results, a conflict of interest that would be unacceptable anywhere else in the business.
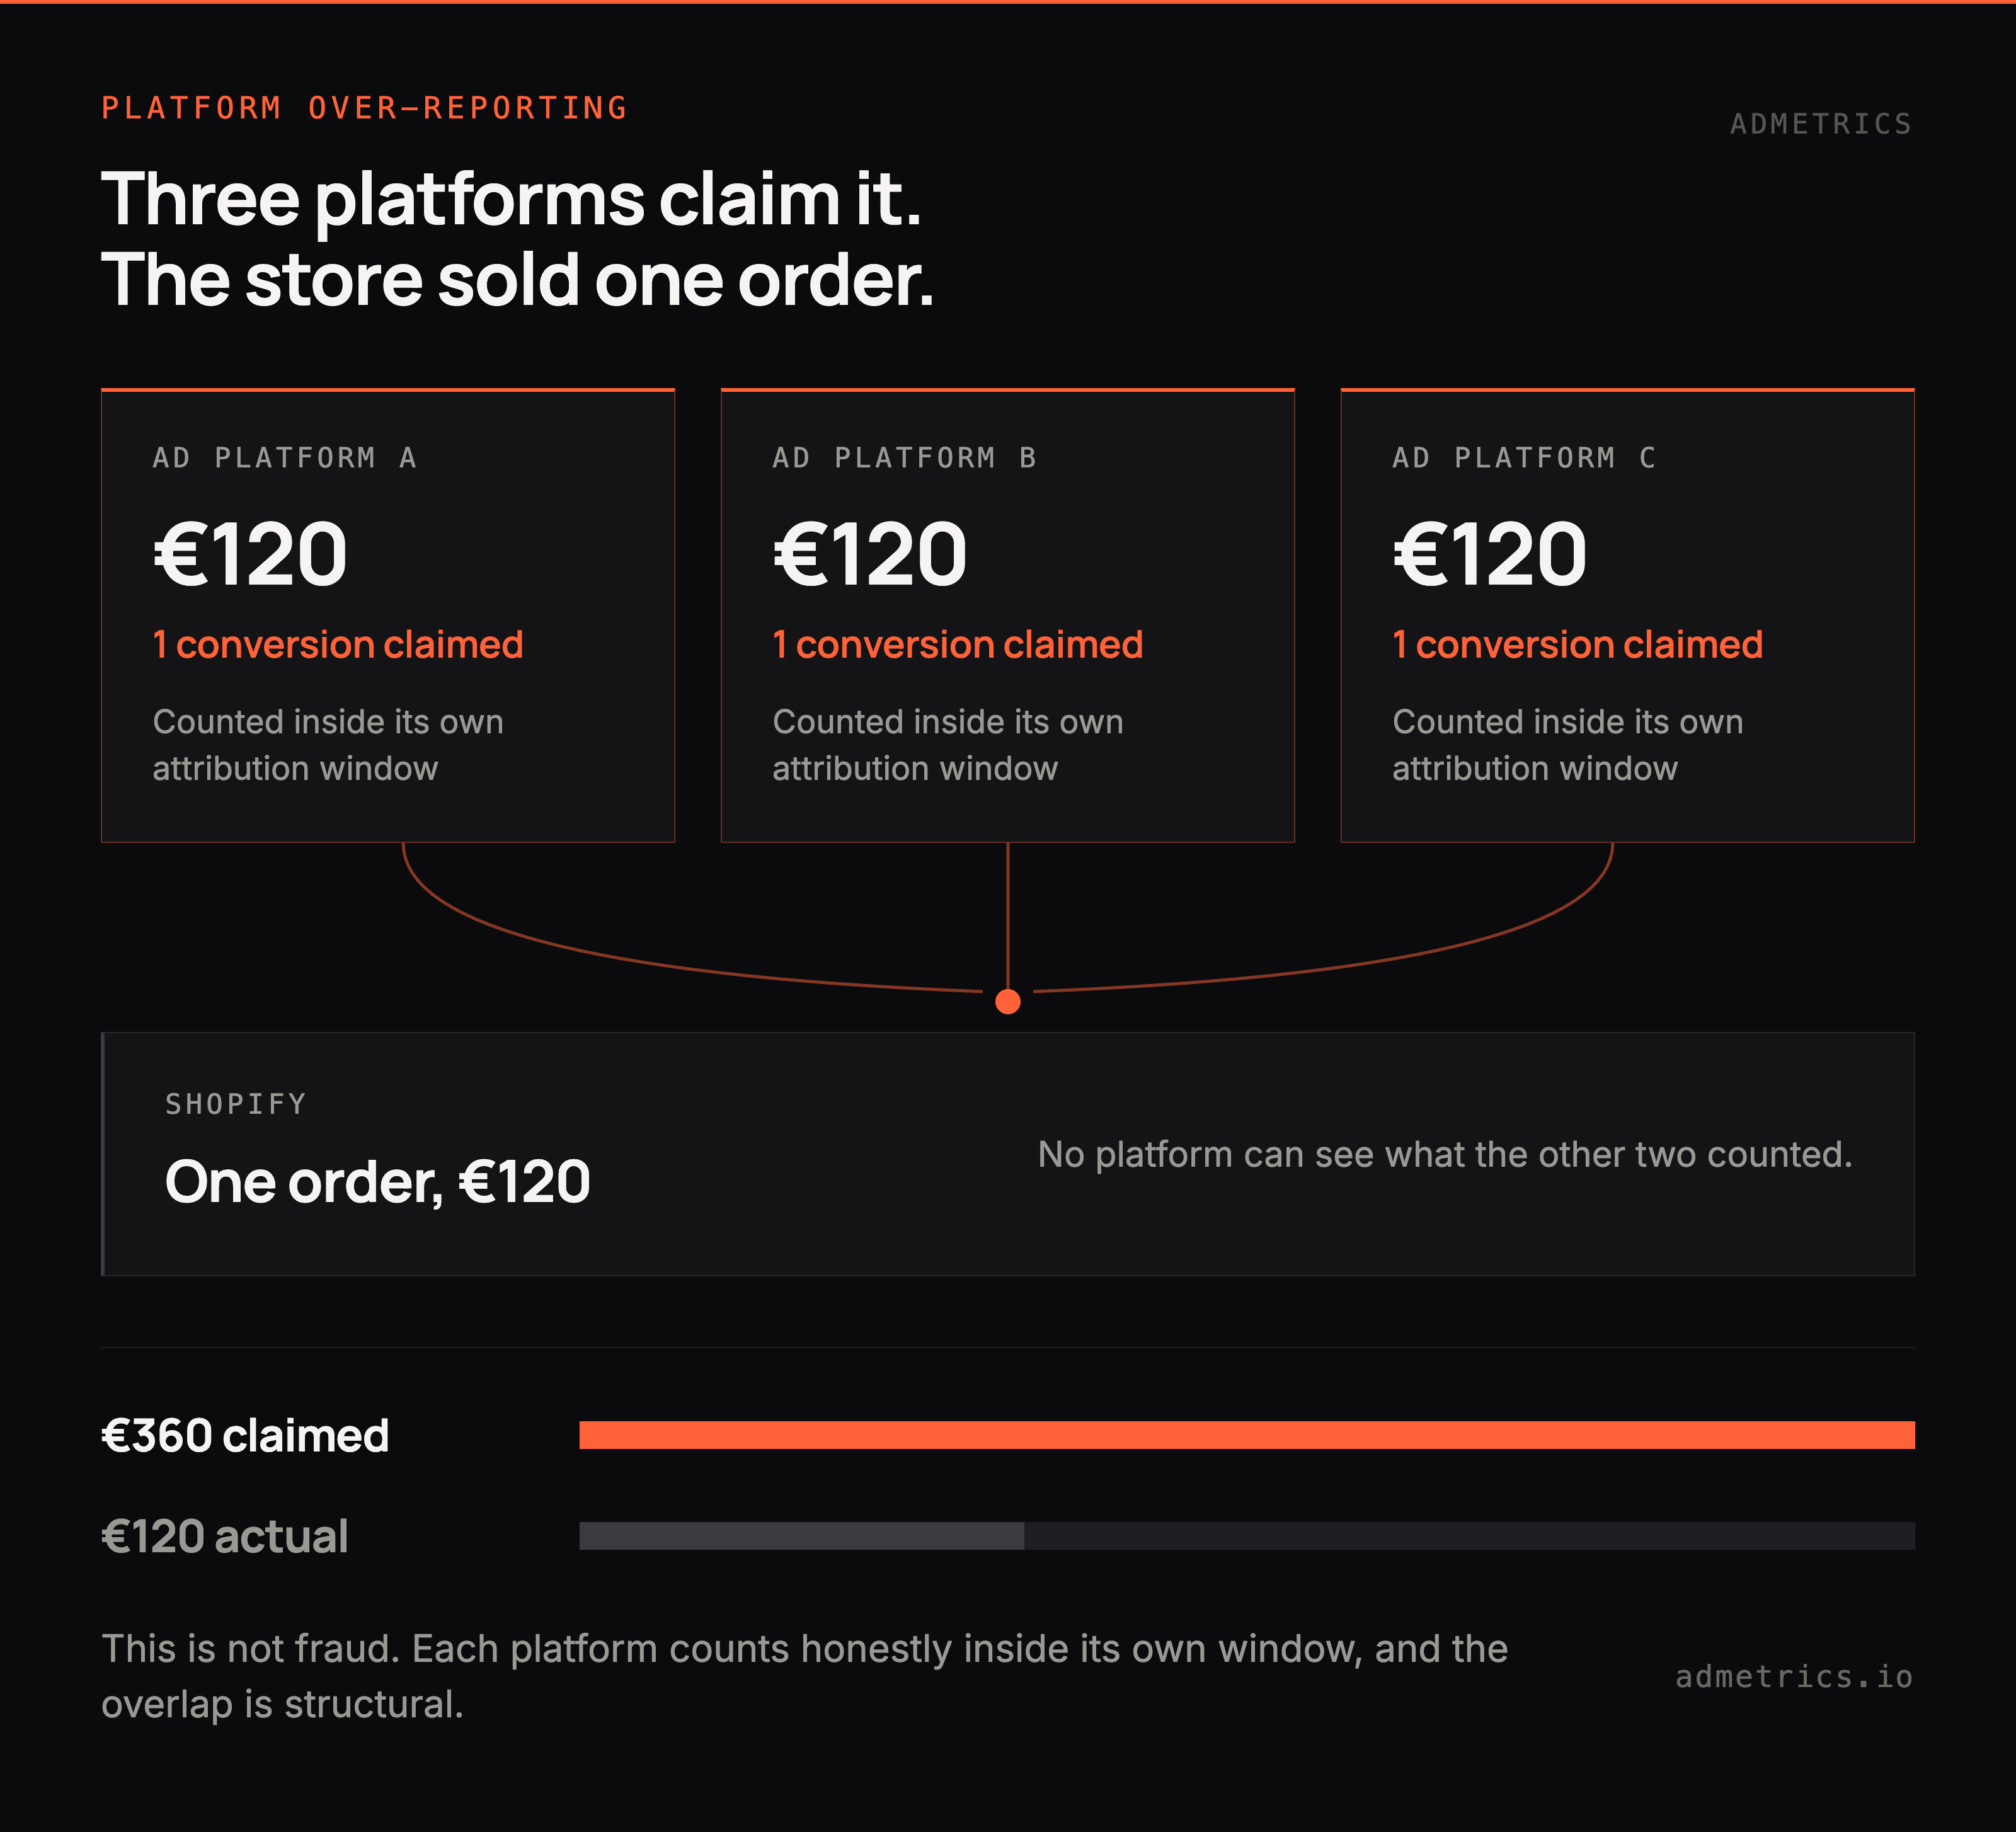
The size of the gap surprises most teams the first time they measure it. From our customers:
A worked reconciliation
Here is what a month looks like for a brand with 2,000 Shopify orders. The figures are illustrative, but the pattern is the one we see in onboarding.
Three things happen in the right-hand column. Every order is credited once. Email loses the most, because it sits at the end of journeys that paid media started. And 470 orders, almost a quarter, have no usable source signal at all. A report that silently spreads those 470 across the other channels is overstating its own precision.
How to fix double counting
Deduplication is a data design problem, not a reporting setting. It needs four things:
- The store order as the anchor. Every attribution record starts from a real order ID in Shopify, Shopware or your commerce stack, never from a platform pixel event.
- Server-side events alongside the browser pixel, so conversions blocked in the browser still reach your measurement.
- A shared event ID on the pixel and server event for the same purchase, so platforms like Meta can discard the duplicate instead of counting it twice.
- One independent credit rule applied across all channels, so each order is divided once instead of being claimed in full by several systems.
Then decide how to act on disagreement. Nyfter's rule is a good one: when the conservative independent baseline and the platform agree that a campaign has the lowest CAC, act on it. When only the platform shows the higher number, treat it as unproven.
Why attribution in marketing matters
Most brands do not have an attribution problem. They have a budget problem that attribution is supposed to solve. The purpose of attribution is to turn scattered clicks, views and sessions into one defensible answer about what your money bought.
Its value scales with what is at stake. A brand spending €20,000 a month across two channels has few moves available, and platform reporting plus clean UTMs gets close enough. The same brand at €300,000 across five channels makes dozens of consequential decisions a month, where a systematic 20% error stops being a rounding issue.
That is the honest case for why attribution is important in digital marketing: the payoff is decision quality at scale. Fragmentation raises the stakes again, because a brand splitting a small budget across six channels often cannot measure any of them. No single channel produces enough signal to evaluate.
What types of questions can marketing attribution answer?
Attribution alone cannot answer that last row. It describes what happened, and says nothing about what happens if you spend more.
How marketing attribution works
Digital marketing attribution runs in four stages: identify the visit, tag its source, store the touchpoints, then apply a model once an order arrives. Over the past five years, signal loss has pushed more of the work from the first stage to the last, as observed data thinned and modelling filled the gap. That shift makes the first stage more important, not less.
Data sources and tracking
Attribution measurement is only as good as the source data underneath it. Five inputs do most of the work, and each fails in a predictable way.
UTM parameters are manually appended tags (utm_source, utm_medium, utm_campaign) declaring where a click came from. Self-reported, and they break the moment someone forgets to tag a link.
Click IDs are platform-generated identifiers appended on click: fbclid, gclid, ttclid. More reliable than UTMs because the platform writes them, and they match back to a specific ad.
The browser pixel is JavaScript firing on page view and purchase. Increasingly lossy, since ad blockers, consent refusals and browser restrictions all suppress it.
Server-side tracking sends events from your server instead of the visitor's browser, sidestepping most client-side blocking. Meta's Conversions API and Google's equivalents accept it.
First-party data covers hashed email, customer ID and order records: the most durable identity signal you control, and the thing that connects an anonymous session to a known customer.
These gaps add up, and no model can repair them. If a quarter of your orders arrive with no usable source signal, the model simply divides the credit among the orders it can see, then presents the result as though it covered all of them.
That is why tracked-order coverage, the share of store orders that carry a usable source signal, belongs at the top of every attribution report. It is also what customers say builds trust:
"I think you are the only tool that openly shows: you had this many orders and this many were tracked." Lukas Westensee, Co-founder, Freiluftkind
Consent, GDPR and what you can measure without it
In the EU, consent decides what user-level attribution can see before any model runs. Consent rates vary widely with banner design and audience, so measure yours and track it weekly; a redesign that drops consent by ten points will look like a performance decline in every report downstream.
Two measurement routes stay open. User-level attribution works on consented traffic, strengthened by server-side events and first-party identifiers. Aggregate methods, above all marketing mix modeling, use spend and revenue totals and need no personal data. Google's Consent Mode v2, required for advertisers using Google's measurement and personalisation features with EEA users since March 2024, adds modeled conversions for unconsented traffic; treat those as estimates, not observations.
Attribution windows
An attribution window is the period after an ad interaction during which a later conversion still counts. Windows are the most underrated source of disagreement between systems, because each platform picks its own and few teams check.
Windows also change. Meta announced on its developer blog in October 2025 that from 12 January 2026 the Ads Insights API would stop returning the 7-day view (7d_view) and 28-day view (28d_view) windows. One day is now the longest view-through window available, though the 1-day, 7-day and 28-day click windows remain. Accounts reporting against the longer view windows saw conversion counts fall in January with nothing about the campaigns having changed, and a chart cannot show you that.
A longer window is not more generous. It is a different claim about how long an ad plausibly influences a purchase. Set it from data rather than habit: measure the lag between click and order for each product category, and choose a click window that covers roughly nine in ten of those orders. A €35 consumable might need seven days. Heimplanet, which sells tents and packs at an average order value of €230, sees journeys of 7 to 14+ days and uses a 120-day window to capture them end to end. See attribution windows for the trade-offs.
Click-through vs view-through
Click attribution credits a conversion when someone clicked. View-through attribution credits one when they only saw the ad. The second is far more contentious, because an impression is cheap, unverifiable from your side, and can be counted even when it had no bearing on the purchase.
Meta tightened its own definitions here. On 3 March 2026 it published "Simplifying Ad Measurement for a Social-First World," narrowing click-through attribution to genuine link clicks, meaning clicks that send someone to a website, app or lead form. Likes, shares, saves and comments stopped qualifying and moved into a renamed engage-through category with a fixed one-day window, which also absorbed video views and dropped the qualifying threshold from ten seconds to five. Reported click-through conversions fell across the industry. The conversions had moved columns. They had not vanished.
The working rule: treat click-based numbers as evidence, engage-through as supporting evidence, and view-through as a hypothesis until a test confirms it. Never add view-through conversions to click conversions at face value. See view-through conversions.
Server-side signals: better data changes delivery
Attribution is usually discussed as a reporting problem. The ad platforms have the same problem in reverse: their bidding algorithms can only learn from conversions they receive. When the browser pixel loses a large share of purchases, the algorithm optimizes on a thinner, skewed sample. Sending consented, deduplicated conversions back server-to-server fixes both sides at once.
This is the pattern in our customer base with the most consistent evidence.
The direction is consistent, and the effect is largest where a platform's own tracking is weakest, which is why native channels show the biggest jumps. See conversion signals.
"With the Admetrics integration we achieved a remarkable 60% increase in ROAS, reduced our Cost per Order by 25%, and optimized our Meta ad spend with precision and confidence." Philip Richter, Performance Marketing, Ehrenkind
Types of marketing attribution models
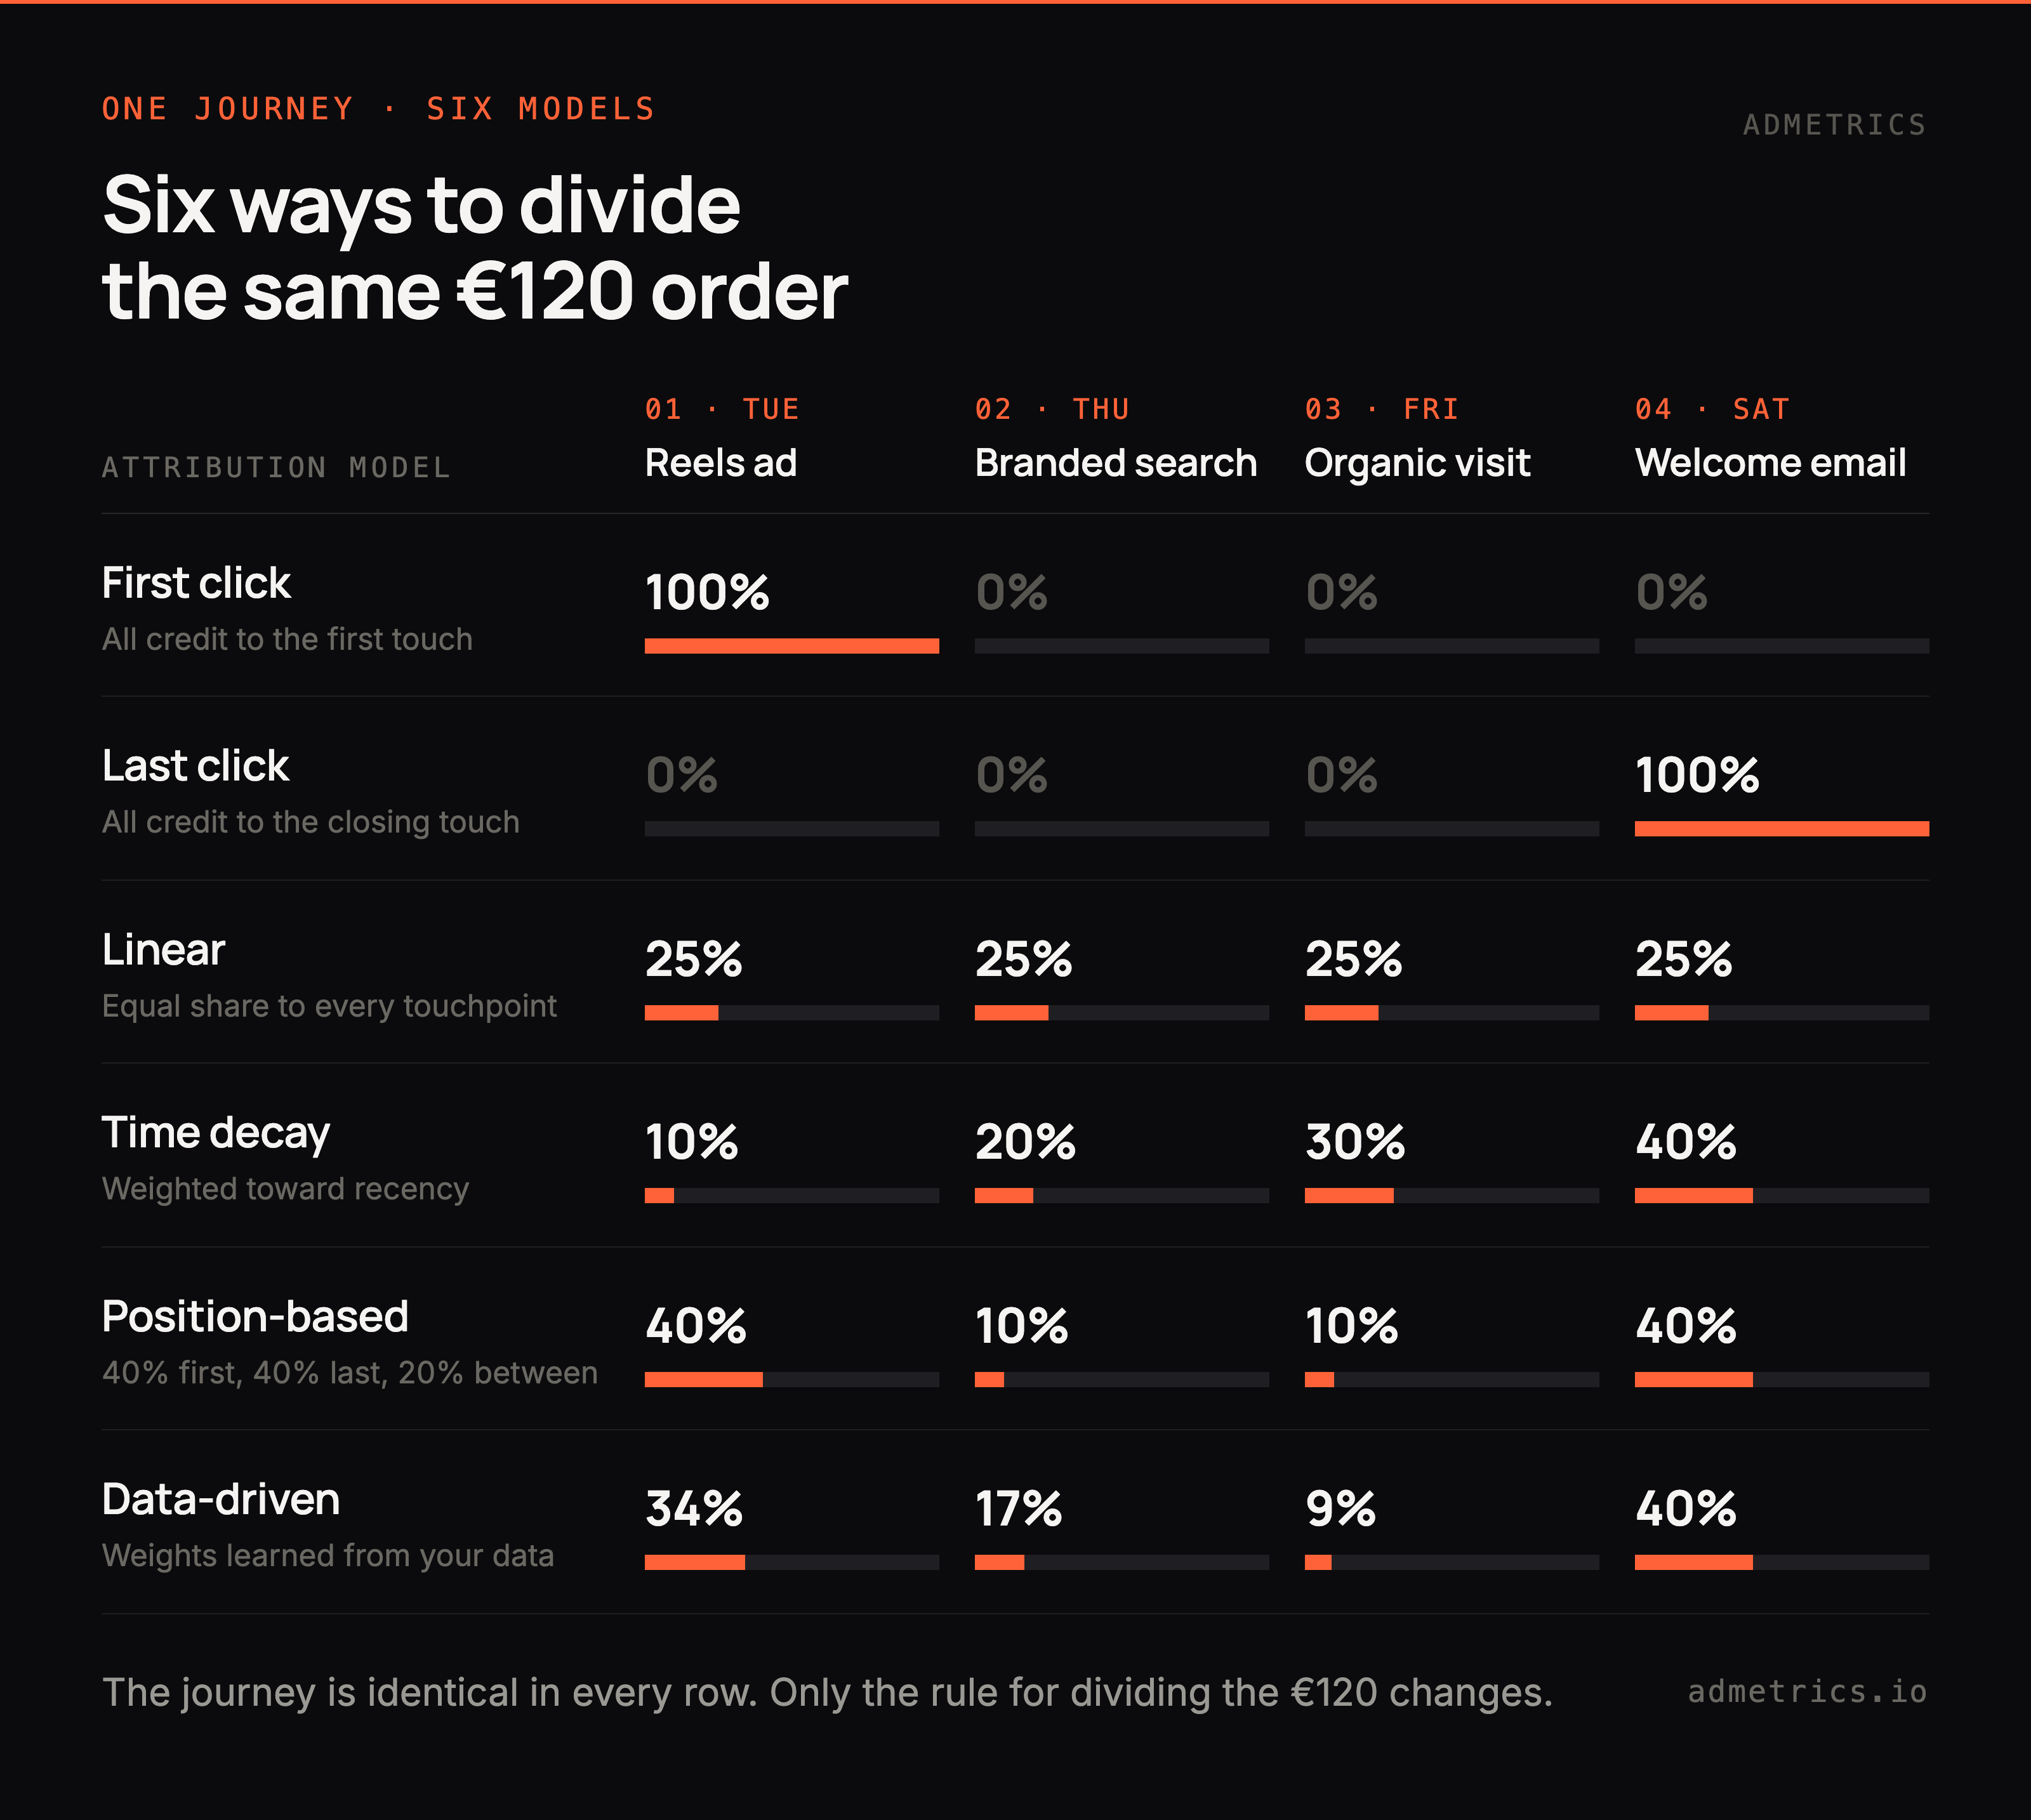
An attribution model is the rule that splits credit between touchpoints. People asking what the four types of attribution are usually mean the four best-known: first click, last click, linear and time decay. The choice matters less than most debates suggest. Tracking coverage, deduplication and the new-versus-existing split usually move channel rankings more than switching models does.
Single-touch models
Single-touch attribution gives everything to one interaction. The danger is directional. Because last click favours whatever sits at the bottom of the attribution funnel, it steadily shifts budget toward branded search, retargeting and coupon affiliates, all of which look excellent because they intercept demand that already existed. A team compensated on last-click ROAS can hit every target while acquiring almost no new customers. Ron Berman's analysis in Marketing Science (2018) found that last-touch attribution pushes advertisers to over-bid on exposures and often leaves them with lower profits than a Shapley-value approach would.
Multi-touch, rules-based models
Linear, time decay and position-based models spread credit across the path. Their weights look scientific, but nobody derived them from your data: a 40/20/40 split exists because someone decided it should. W-shaped and full-path models were built for B2B pipelines with named stages; the full path model gives four milestones 22.5% each and spreads the last 10% across everything between them. An ecommerce journey has no equivalent of an opportunity being created.
Rules-based does not have to mean generic. ESN and More Nutrition replaced last click with a U-shaped model that weights new-customer, existing-customer and influencer touchpoints differently, because those touchpoints do different jobs in their business. The weights are still chosen, but they are chosen for a reason the team can state.
Data-driven and algorithmic models
Data-driven attribution estimates weights from your own conversion paths. Markov chains measure each channel's removal effect: how much conversion probability disappears if that channel is deleted from the paths. Shapley values, from cooperative game theory, give each channel its average marginal contribution across every combination of channels. Google made data-driven attribution the default in Google Ads and GA4 and, during 2023, removed first click, linear, time decay and position-based from both, noting that fewer than 3% of Google Ads web conversions still used them.
Two cautions apply. Algorithmic models need enough converting paths to be stable, so they misbehave on small accounts, and a model you cannot inspect is one you cannot defend in a budget meeting. A newer approach calibrates the path model with a marketing mix model, scaling attributed credit so channel totals agree with what the MMM says each channel contributes.
One working assumption is worth adopting: every attribution model is wrong on the day you install it, because none is calibrated to your sales cycle, funnel shape or product mix. The ones that become trustworthy get there by iteration. Adopt a baseline, generate hypotheses, test what matters, correct, repeat. A model that has survived six months of that beats a more sophisticated one switched on last week.
Is Google Analytics 4 enough?
For one or two channels and modest spend, GA4 with clean UTMs is a reasonable baseline. It stops being enough for three reasons. It runs on browser tracking, so ad blockers and consent refusals remove orders before any model runs; Olivenzauber found Google Analytics saw at most half the signal their independent tracking captured. It cannot see impressions or engagement on Meta, TikTok or native platforms, so influence without a click is invisible to it. And it reports revenue, not contribution margin.
Use GA4 as a benchmark and a sanity check. Do not use it as the only basis for five- or six-figure monthly budget decisions.
Attribution, marketing mix modeling and experiments
Attribution is one method among three. Mature teams run all of them across marketing measurement and attribution, and use each for what it is good at.
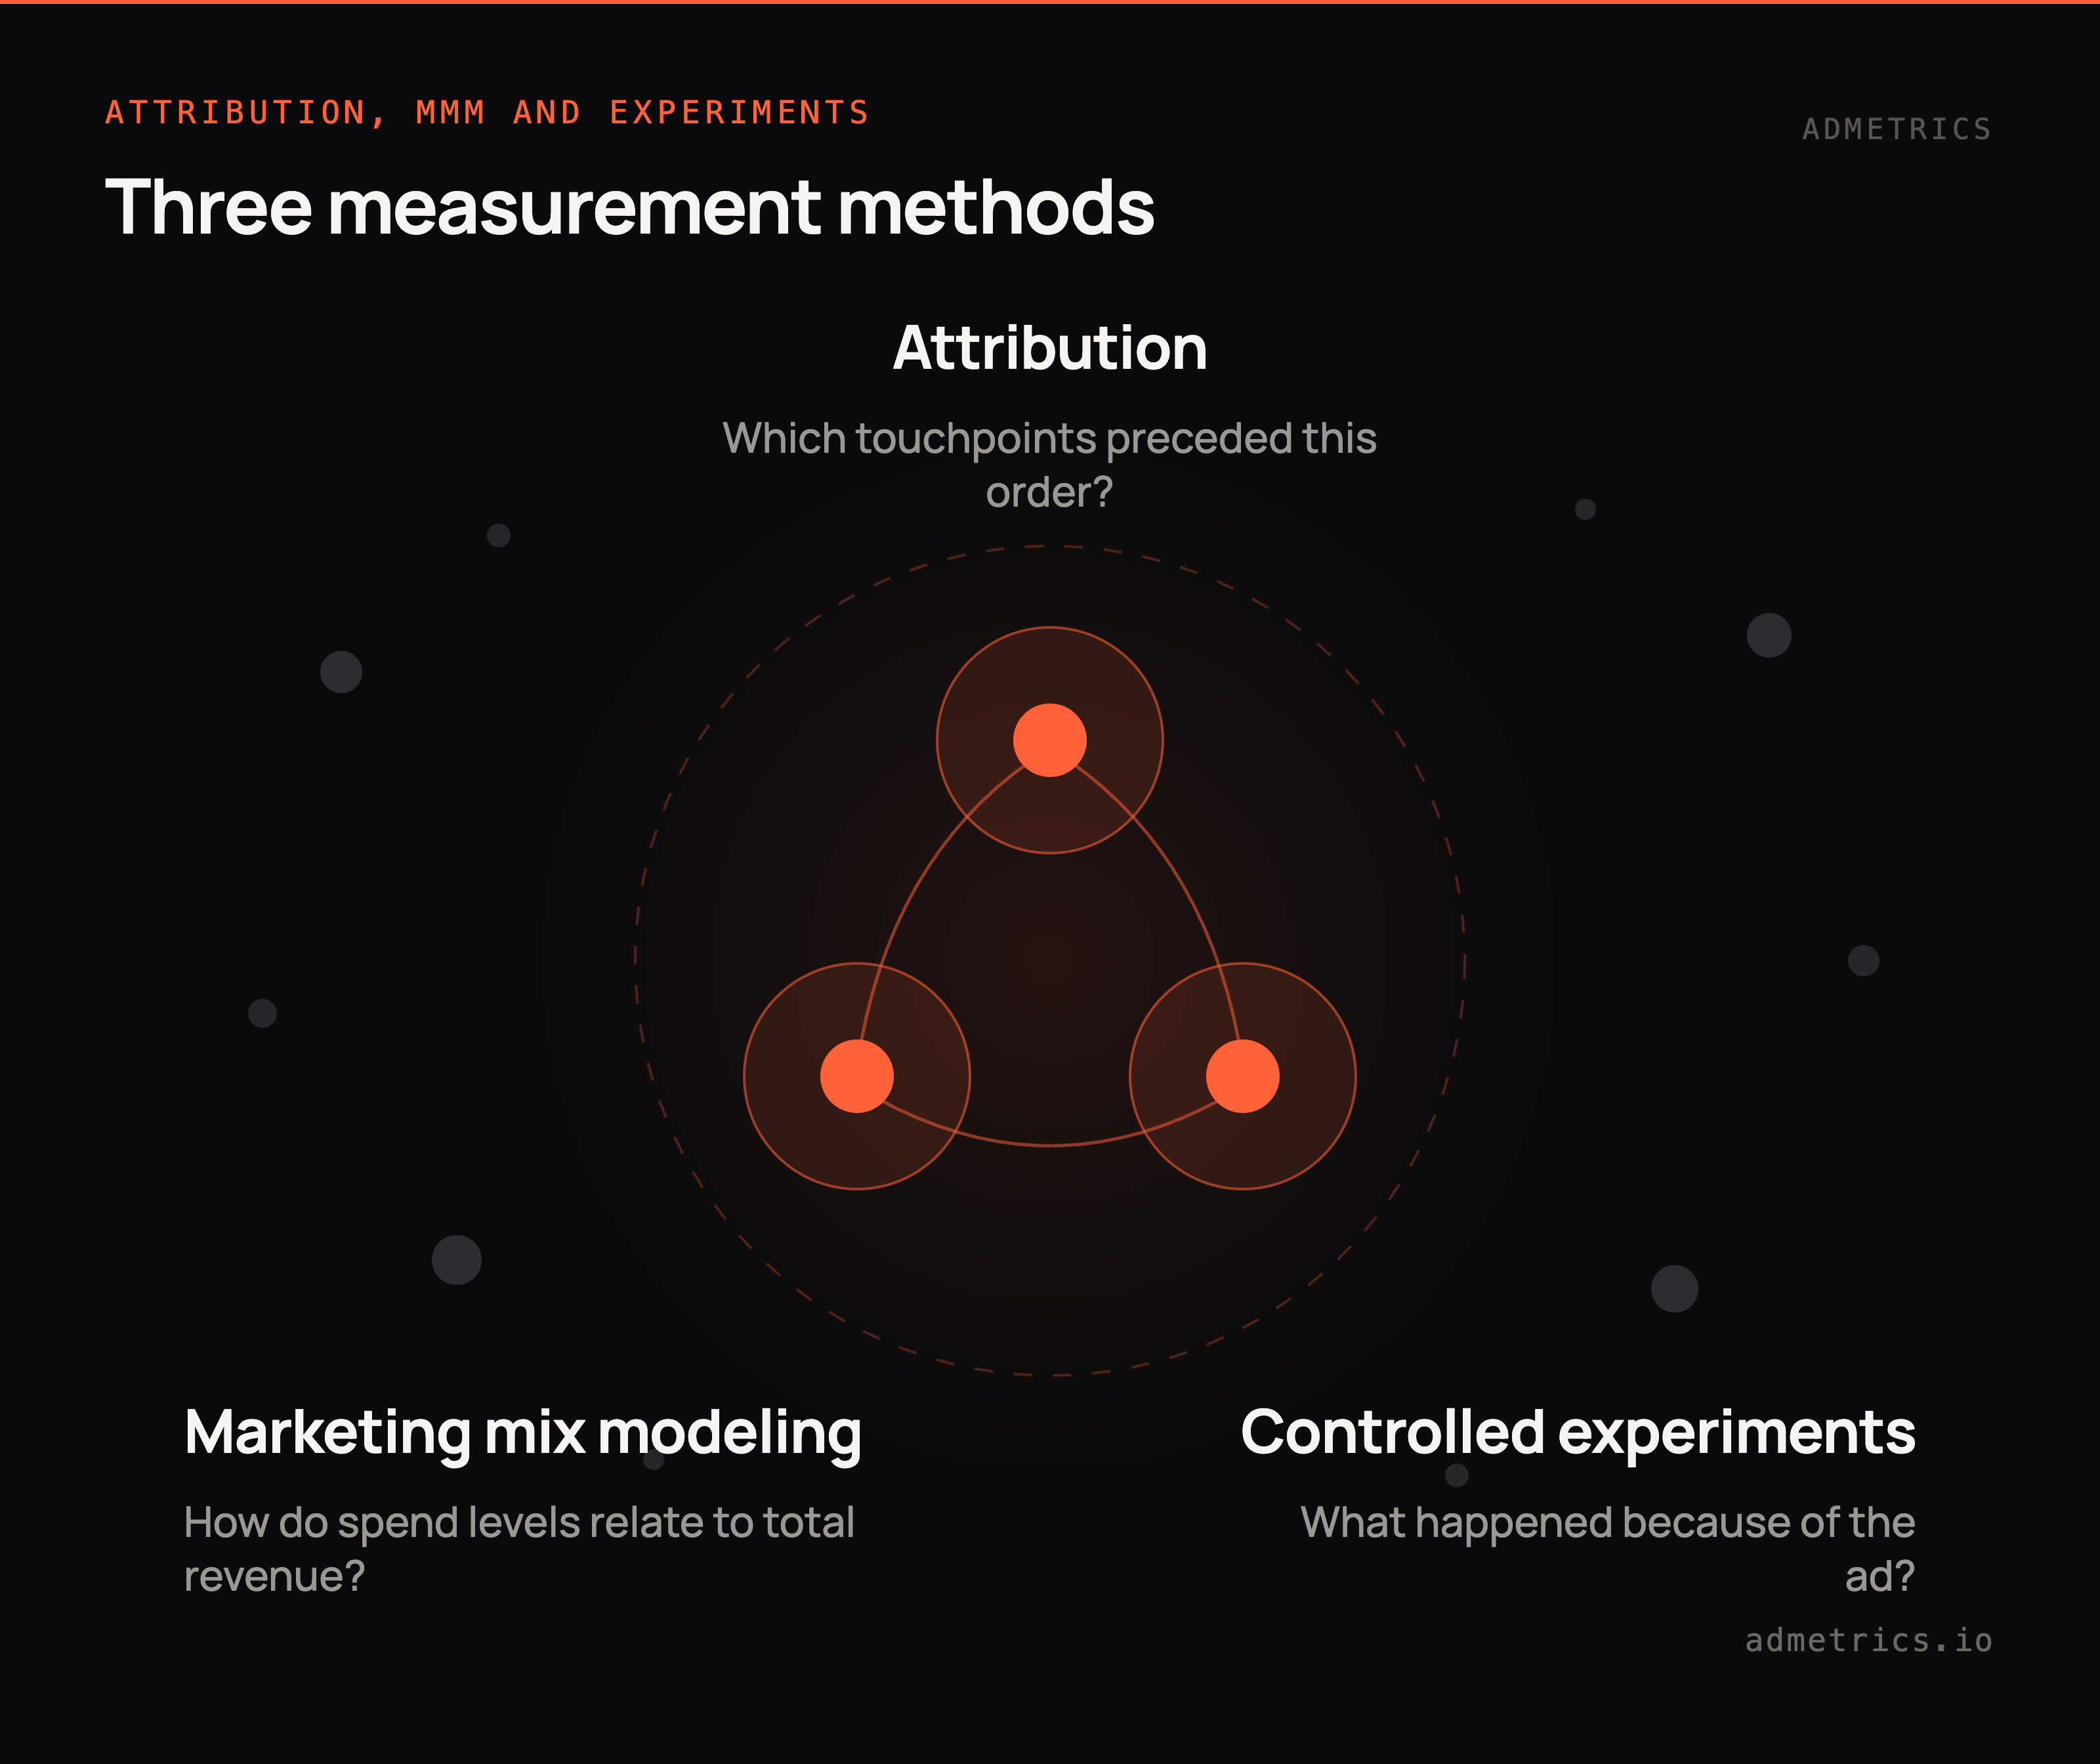
They fail in different directions, which is the point. Attribution is granular and fast but correlational. Marketing mix modeling covers unclickable media at weekly channel level. Experiments give the strongest evidence and cost the most.
The most valuable thing the combination produces is a contradiction test. When one method credits a channel heavily and another shows nothing, you have found a hypothesis. You do not yet have an answer.
The classic version: a channel shows meaningful attributed revenue in a modeled report while producing almost no last-click conversions. That fits genuine upper-funnel influence, where people saw the ad, remembered it and returned later from another device. It fits equally well with a model crediting traffic that was never going to convert, including bots. The two explanations look identical in a report and differ by a lot of money.
The only way to separate them is to move spend and watch. Scale the channel up while holding everything else steady, or cut it and look for a revenue gap. If a channel supposedly contributing 10% of revenue can be halved with no detectable effect, the attributed number was describing correlation. Teams stall here for cultural reasons, because running the test risks proving that a channel someone has defended for a year does not work.
In Admetrics, response curves from Marketing Mix Modeling show how revenue responds as spend rises, and Experimentation puts a controlled A/B, funnel or creative test beside them. See MTA vs MMM for where the two main methods diverge.
Marketing attribution by channel
Every platform breaks ad attribution in its own way. Online advertising attribution problems depend on how a platform counts, what it can see, and what it has an incentive to claim, so marketing channel attribution only works once you know each channel's bias.
Cross-channel and cross-device advertising attribution
Advertising attribution gets hard the moment a journey crosses a device or a platform boundary. Someone discovers you on a phone during a commute and buys on a laptop that evening, so two sessions exist where there is only one customer. Household behaviour makes it worse: one person researches, sends a link to a partner, and the partner completes the order. No identity system resolves that deterministically.
First-party identity, such as a logged-in account, an email capture or an order record, is the only durable bridge. Gifting is the extreme case: at Nyfter, a gaming-accessories brand, up to 30% of purchases in a normal month are gifts from parents or grandparents who never saw the ad.
Campaign attribution: the right unit of comparison
Campaign attribution is a more useful unit than channel attribution. "TikTok doesn't work for us" is almost always a statement about specific campaigns, creatives and targeting, and two campaigns on one platform routinely differ more from each other than the platform averages differ from one another.
Marketing campaign attribution at campaign and ad-set level gives you a fair comparison. Roll everything up to platform level and you end up making inventory decisions when the real question is about creative and account structure.
Meta
Meta reports what happens inside Meta. It cannot see your Google or email touchpoints, and counts any conversion falling inside its own window. Since iOS 14.5 introduced App Tracking Transparency in April 2021, much of what Meta reports is modeled. AppsFlyer's data marking four years of ATT, published in April 2025, put global opt-in at 50%, with Germany at 47%.
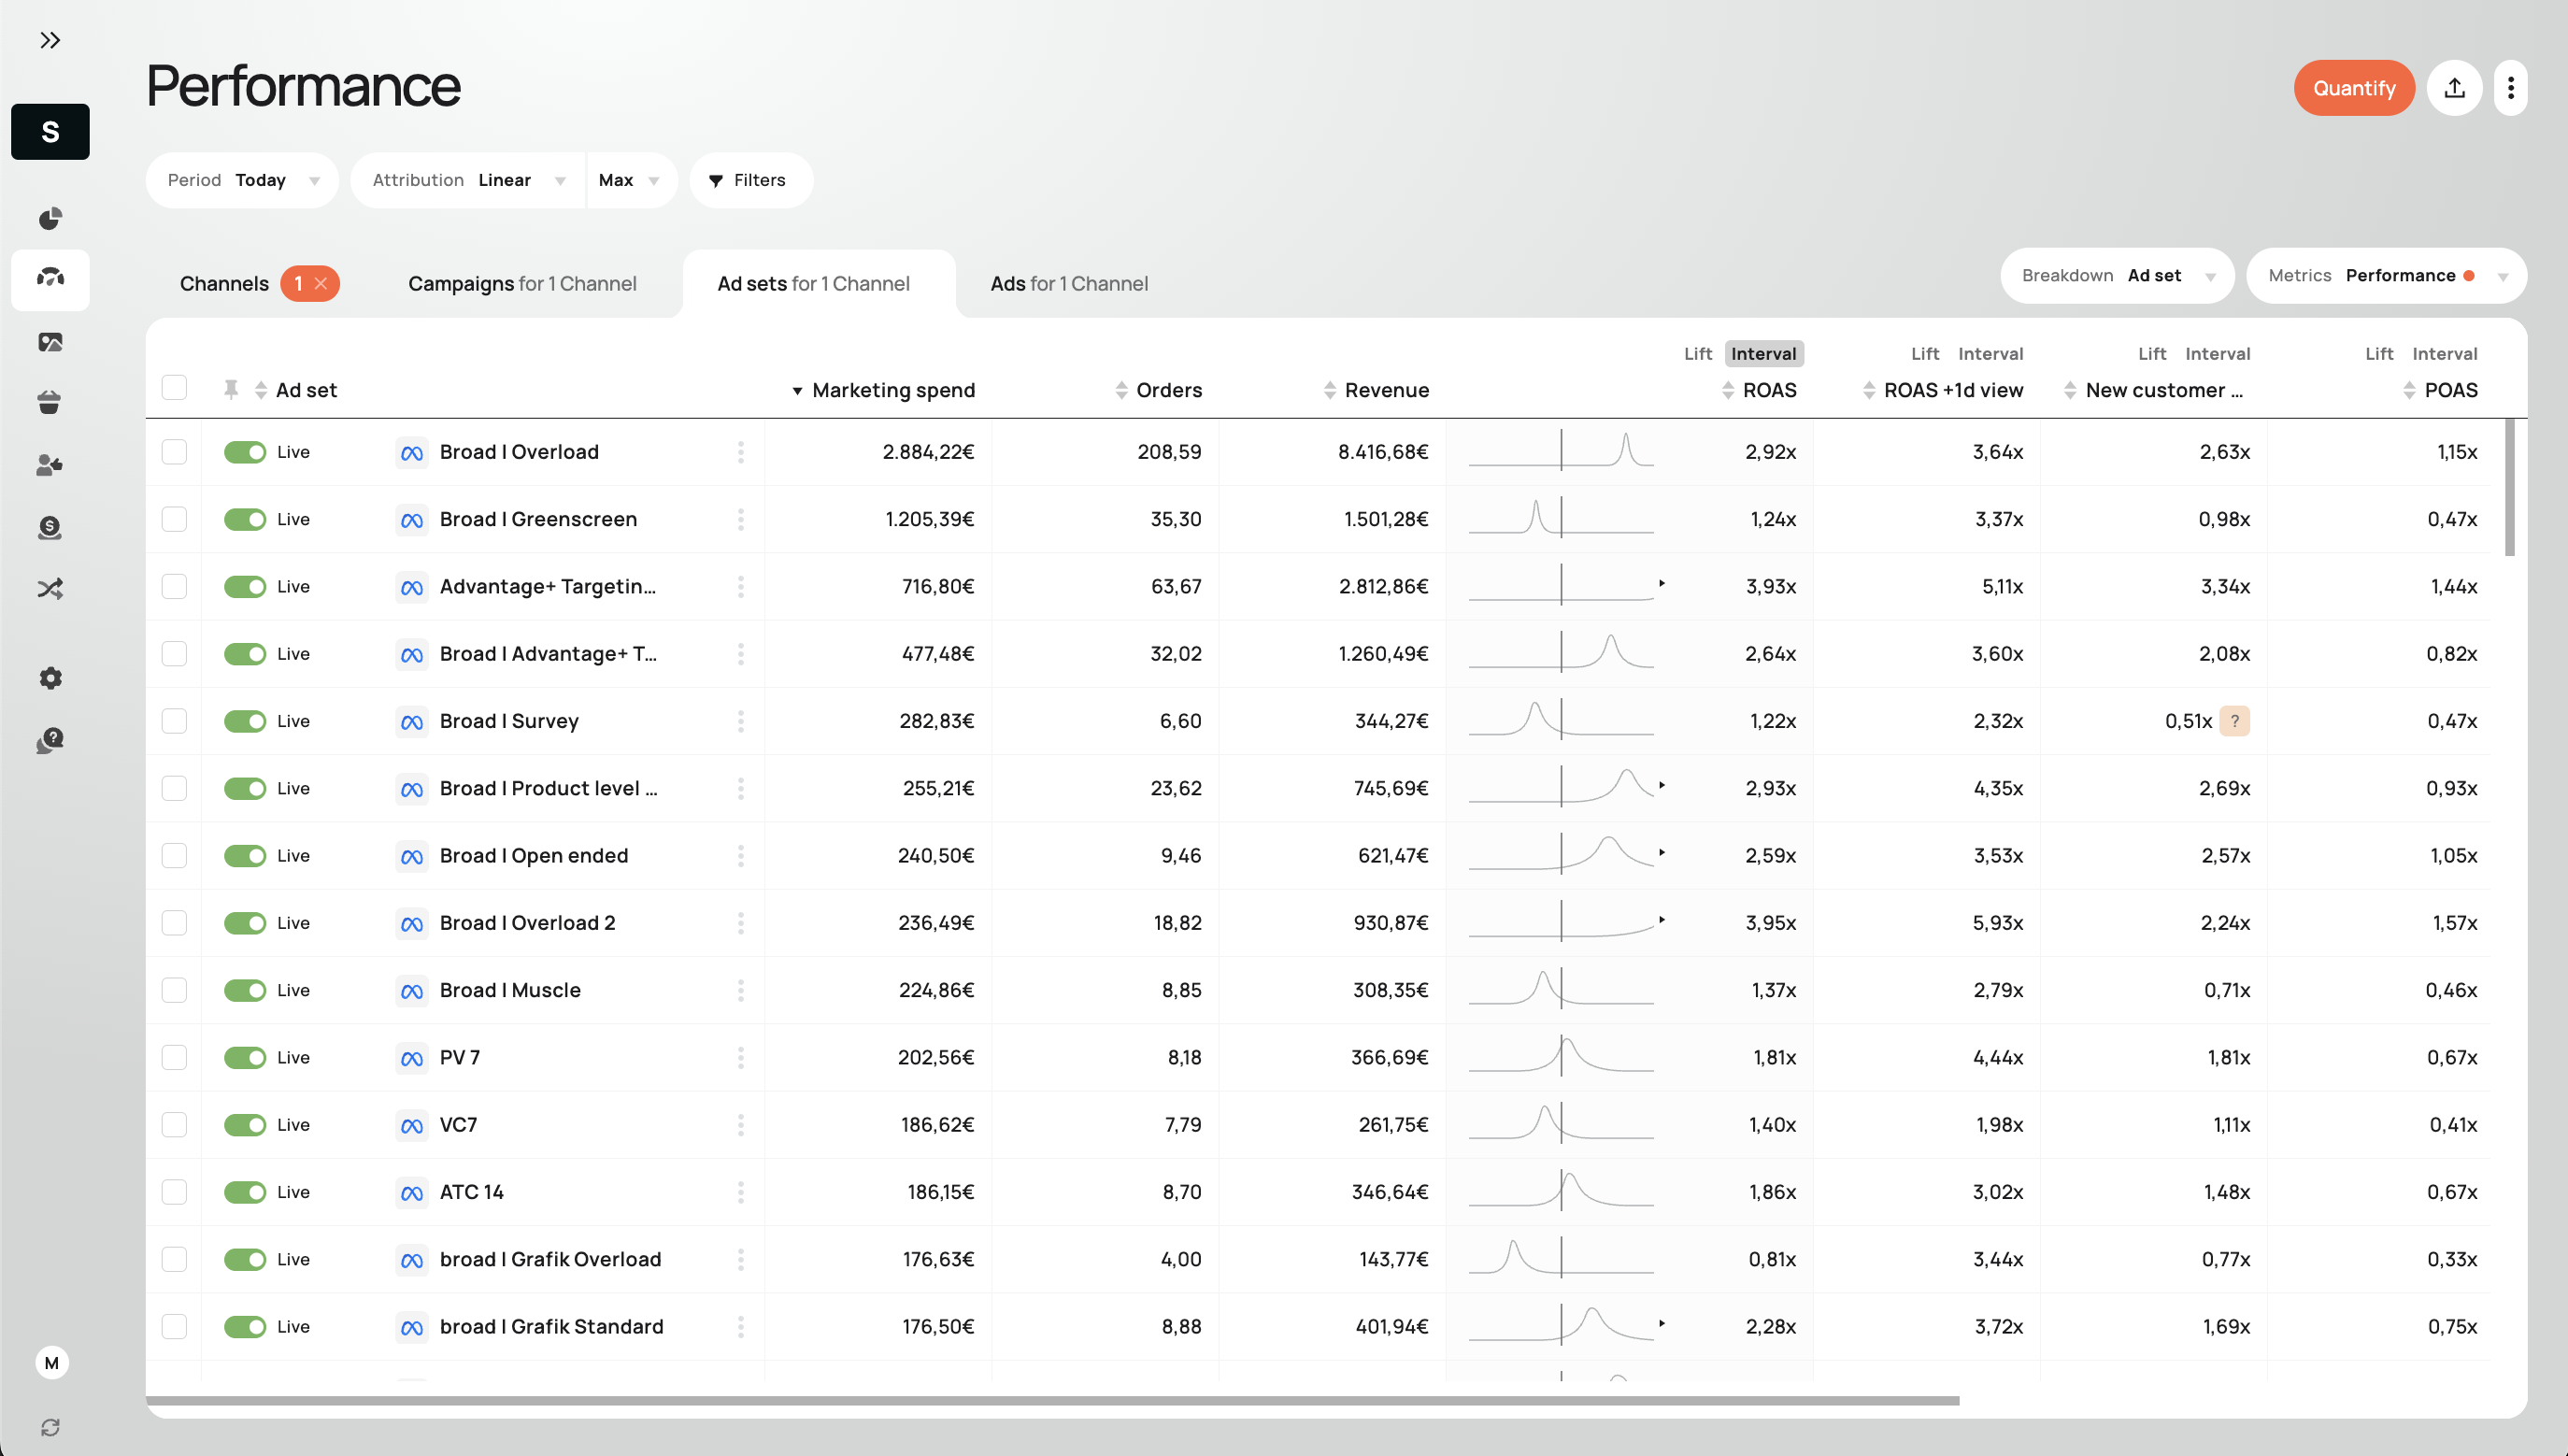
Running the Conversions API alongside the pixel is now table stakes. Buyers also optimize inside Ads Manager, which is where an independent number has to appear, so Admetrics surfaces independently measured performance inside Meta Ads Manager through a Chrome extension.
Google Ads
Google Ads runs on data-driven attribution by default with a 30-day conversion window. Branded search absorbs credit for demand other channels created, so a harvesting channel reports like an acquisition channel; split brand from non-brand in every report.
TikTok
TikTok is the clearest case of click-based measurement understating a channel. Consumption is passive, discovery happens without clicking, and purchases tend to arrive later through search or direct. Last-click reporting will show TikTok performing badly whether or not it is working, so test its contribution before assuming either way.
Email has the opposite problem: it over-claims. An email click is unambiguous, well tracked and late in the journey, so last-click models hand it credit for demand paid media created. Flow revenue is the worst offender, re-crediting customers you already paid to acquire.
Influencer marketing
Influencer attribution is genuinely hard. Most of the impact is unclickable, and codes and tracked links only capture conversions that used them. Treat code data as a floor, never the total. Affiliates need the opposite caution: coupon and cashback sites often intercept buyers who were already checking out.
Media attribution for native ads and content
Native, display and content sit furthest from a clean click. Native is often under-tracked rather than under-performing: Freiluftkind had switched off campaigns that were working because its previous tool could not see them, and was typing native spend in by hand each week. After connecting Taboola and Outbrain natively and restoring the Outbrain signal server-side, it tripled native spend within a month at higher ROAS. Content attribution has the same shape, since a comparison page can influence a purchase without appearing near the final click, so it is better judged by assisted paths and holdouts than by last click.
Revenue and profit attribution
Here is the flaw that survives every model upgrade. Attributing revenue tells you nothing about whether you made money. Two campaigns both report 4x ROAS. One sells a high-margin bestseller at full price to new customers. The other sells a discounted, bulky, frequently returned item to people who already buy from you. Identical ROAS, and only one is worth funding.
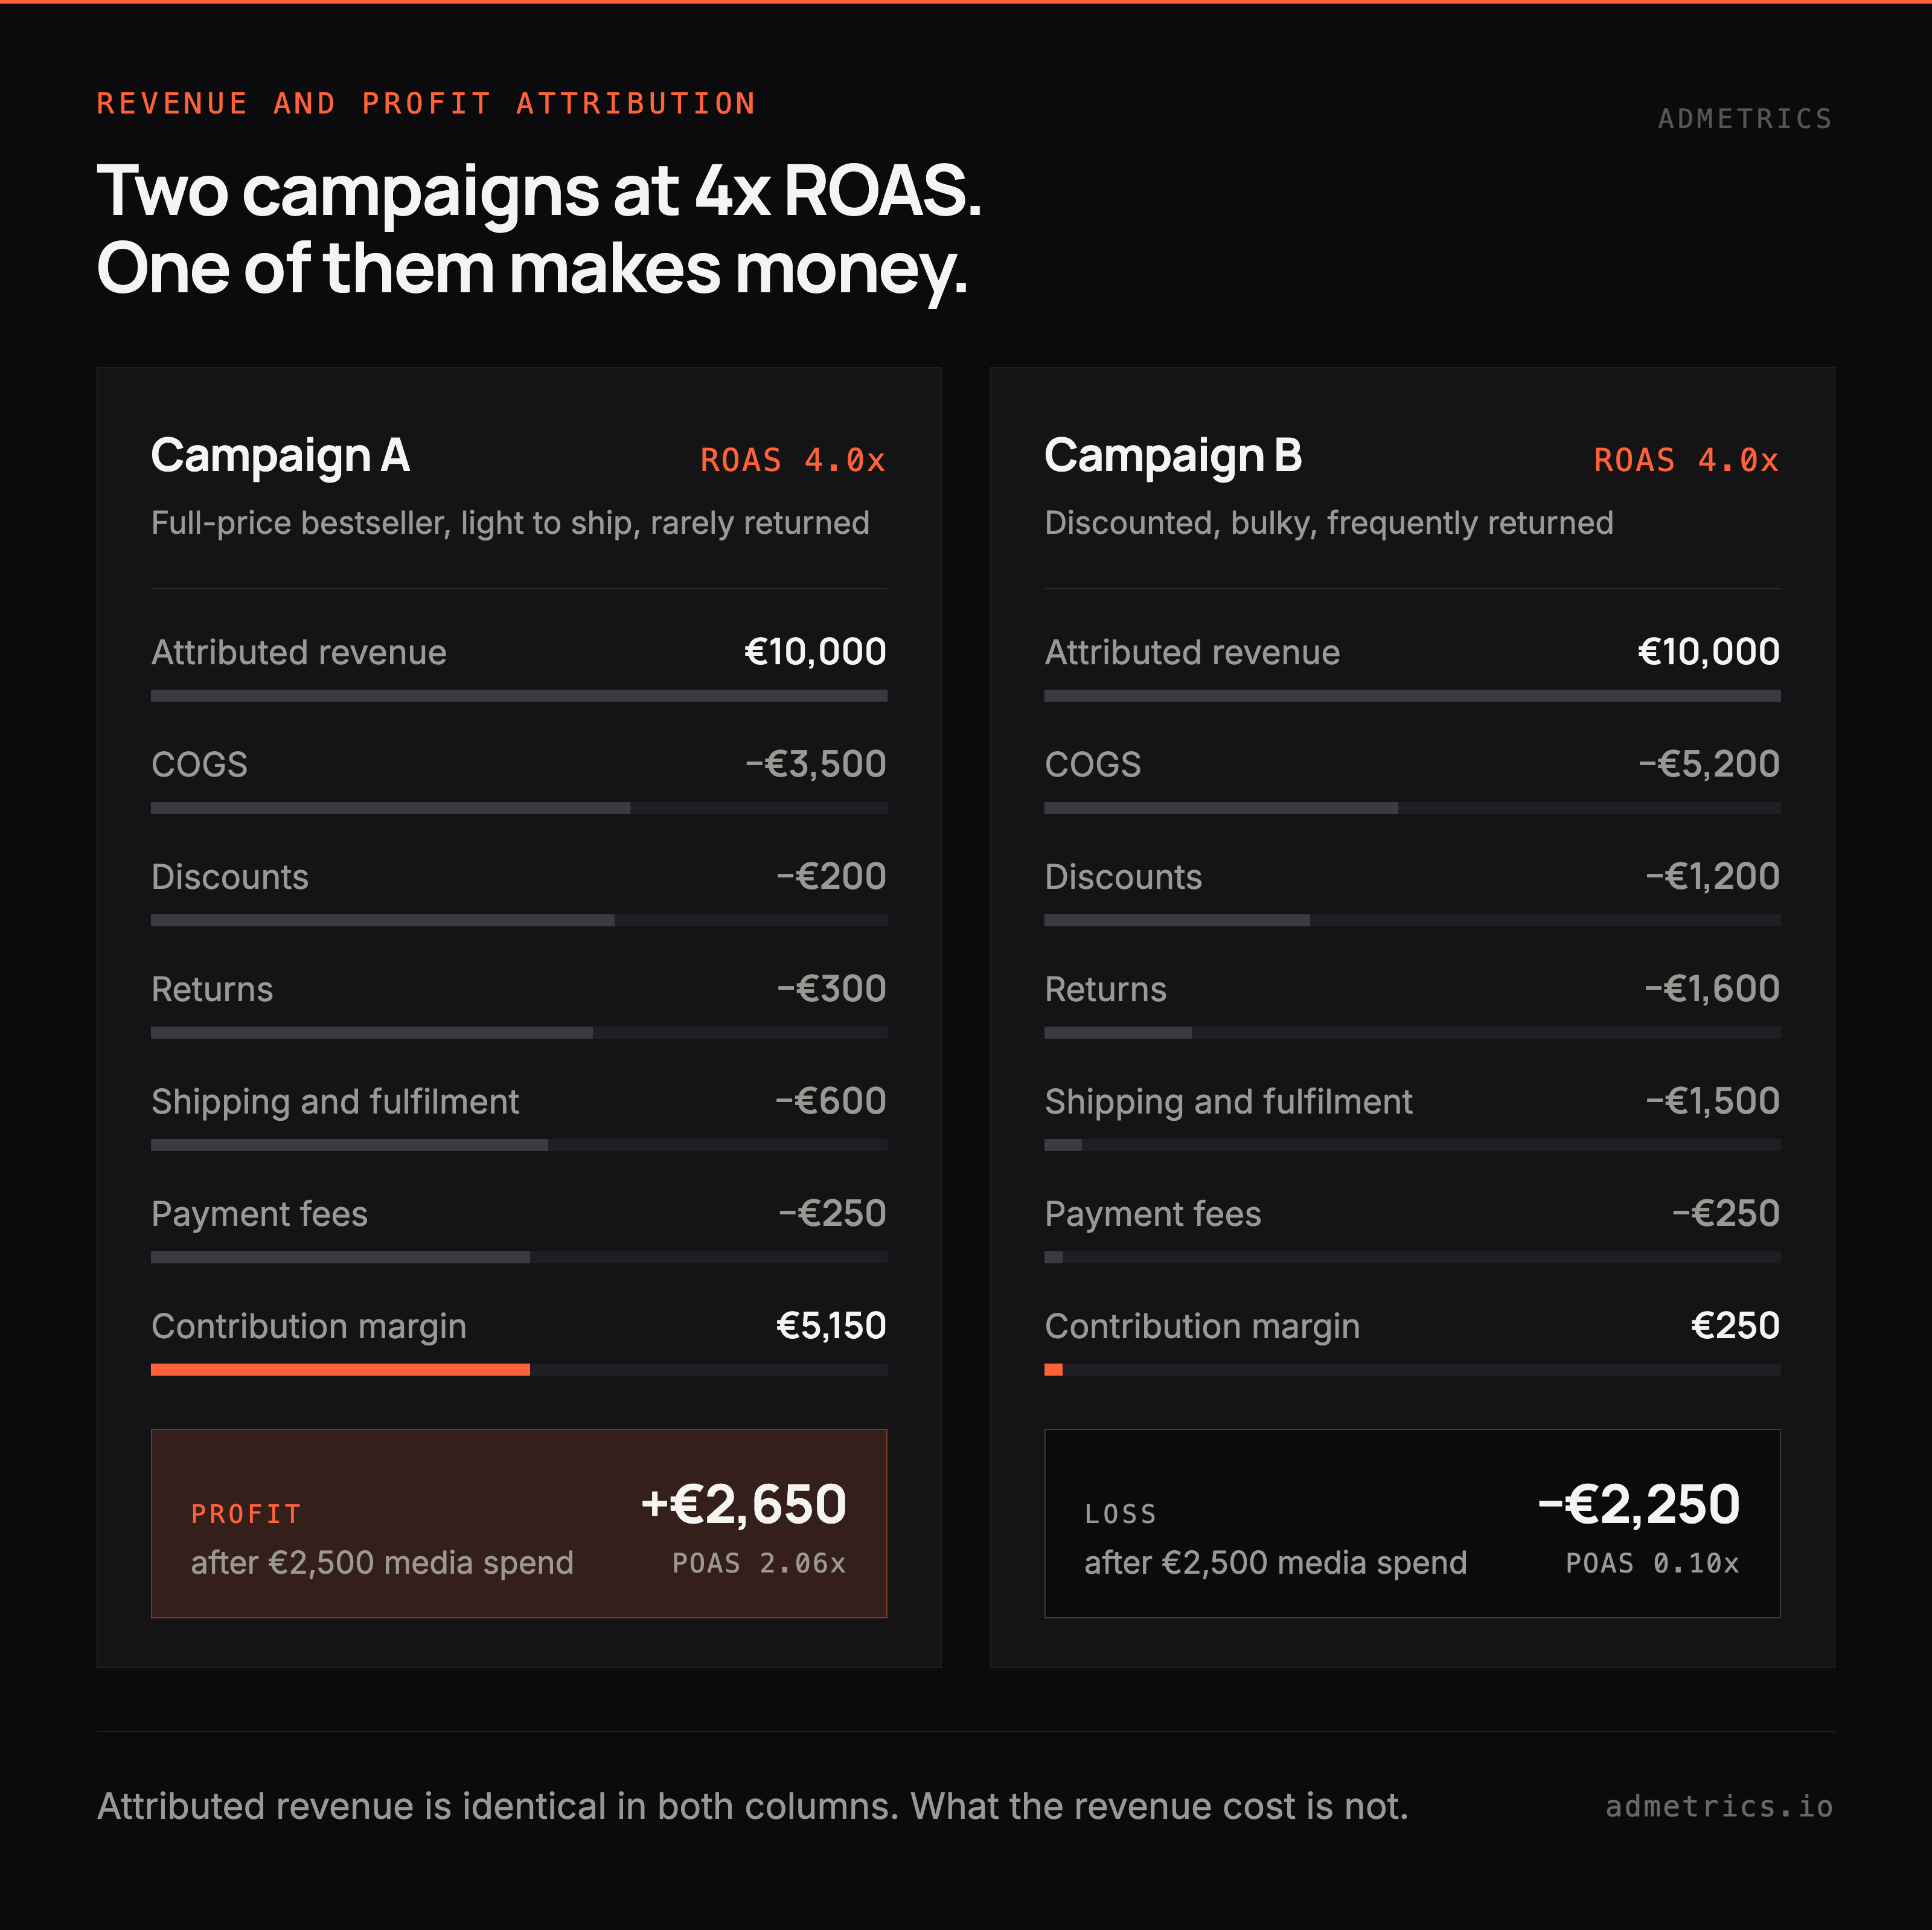
Profit attribution subtracts what the revenue cost:
- COGS and product margin, which vary across a catalogue
- Discounts, often the reason the order converted
- Returns, which some channels and creatives produce far more of
- Shipping and fulfilment, where bulky items destroy margin
- Payment and transaction fees
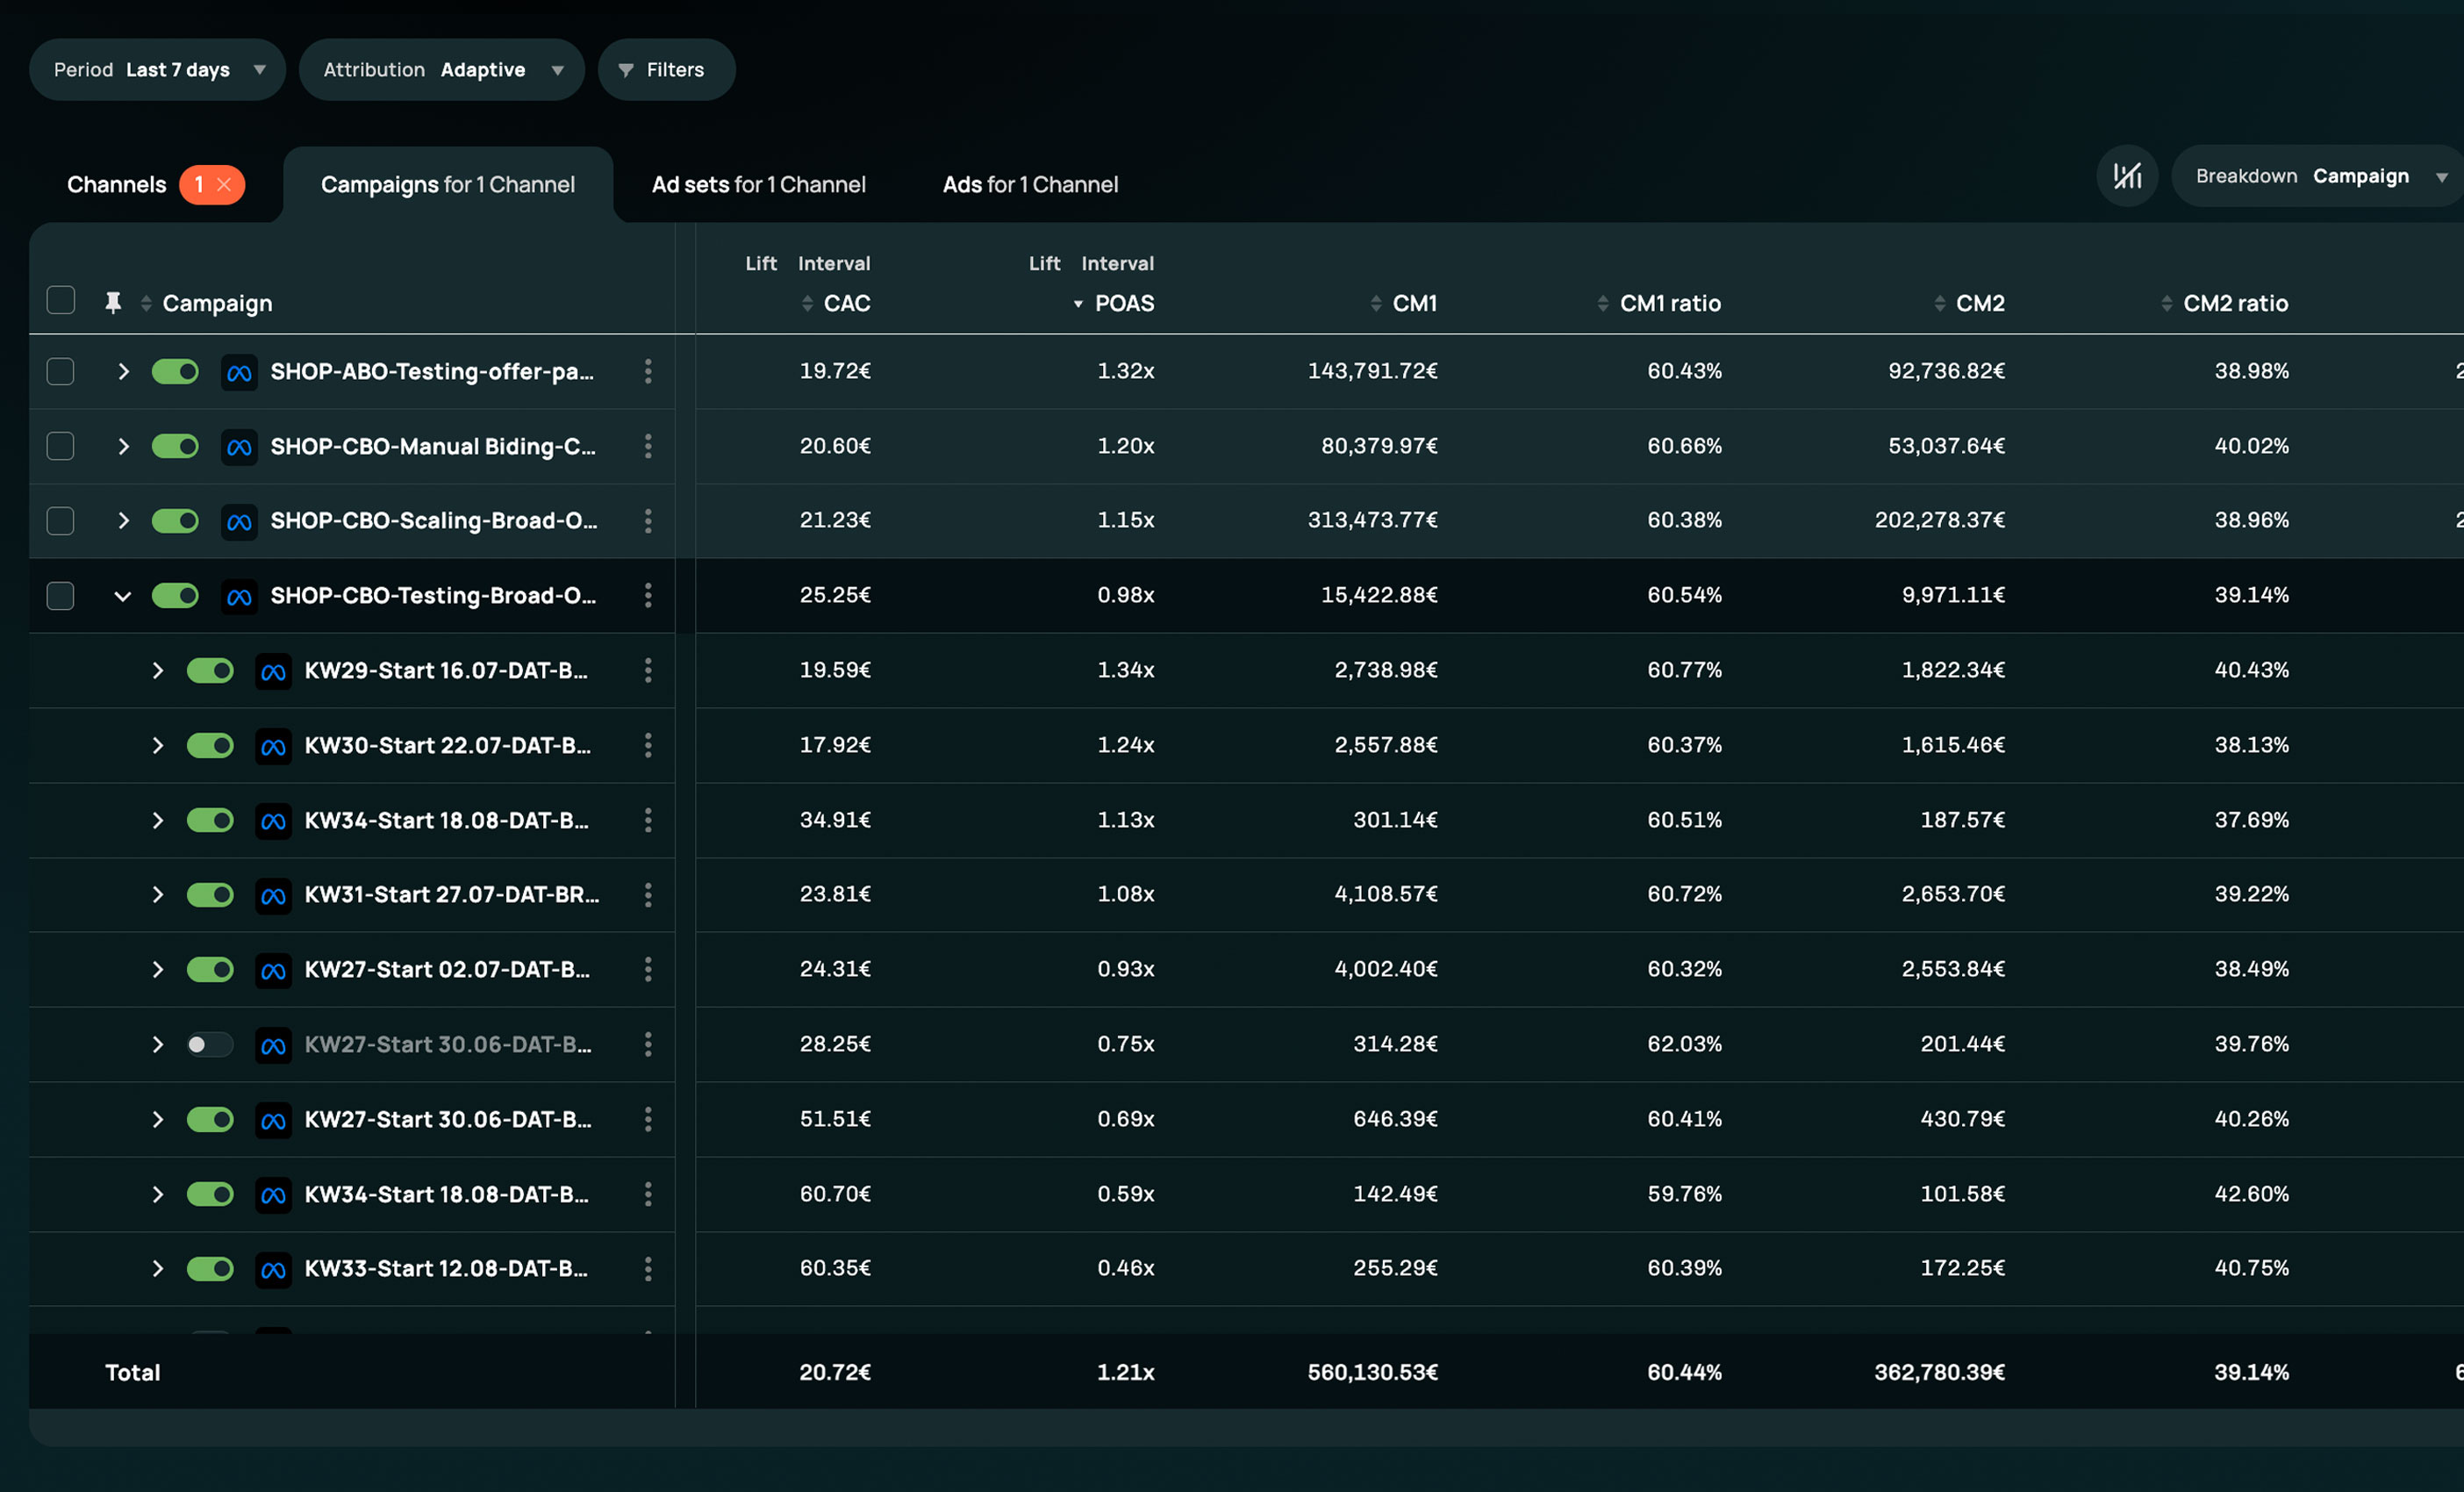
What remains is contribution margin. Measured against media spend it becomes POAS, profit on ad spend, and it reorders channel rankings regularly. NC-CAC, the cost to acquire a genuinely new customer, does the same job for acquisition by stripping out the repeat purchases that flatter retargeting and email.
Attribution metrics measured in profit are the ones a CFO can act on.
Ecommerce and Shopify attribution
Shopify gives you one trustworthy fact, the order, and a limited view of what caused it. Its marketing reports use last non-direct click over a 30-day window: a reasonable default and a poor foundation for allocating six figures a month. Three ecommerce-specific issues matter more than the model choice.
New versus returning customers. A blended CAC that mixes both will always flatter retargeting and email. Customer attribution that separates first orders from repeat orders changes channel rankings more than switching models does.
Lifetime value. A channel with worse first-order CAC can still be the better investment if its customers reorder. Subscription brands feel this most, because renewals have no browsing session and land as direct by construction. Tales & Tails, a subscription-led pet food brand, deliberately keeps some campaigns with weaker first-order ROAS live because they produce subscribers later.
Subscriptions and marketplace orders. Many brands sell a large share through Amazon: Naturtreu runs roughly 50/50 between Amazon and its own shop, Nyfter between 50/50 and 60/40. Store attribution cannot see those orders, so a channel that quietly drives Amazon sales looks weaker than it is, and a "new" shop customer may already be an Amazon customer. Cross-matching customers across both is how Naturtreu judges whether a new customer really is new.
Challenges of marketing attribution
The challenges of marketing attribution are structural. Every digital marketing attribution problem below has a size and a direction you can estimate, and estimating them is the job. None of them can be removed.
Privacy, consent and signal loss
Consent banners, ad blockers and browser restrictions remove visitors from measurement before any model runs. Safari, Firefox and Brave block third-party cookies by default, and Safari's Intelligent Tracking Prevention has capped JavaScript-set first-party cookies at seven days since WebKit shipped ITP 2.1 in February 2019, so a visitor returning after eight days looks new. Apple's Link Tracking Protection, added in iOS 17, strips known tracking parameters from links shared in Messages, Mail and Safari Private Browsing.
One widely predicted change did not happen. Google confirmed in April 2025 that it would keep third-party cookie choice in Chrome, then retired most Privacy Sandbox technologies, including the Attribution Reporting API, in October 2025. Cookies survived, and measurement kept eroding anyway, because Chrome was never what was driving it.
Signal loss also hurts platform delivery, which is why server-side conversion feedback belongs in the same workstream as measurement (see the server-side section above).
Direct traffic and non-attribution traffic
Non-attribution traffic is any session that arrives with no identifiable source. Direct traffic attribution is the most common form, covering typed URLs, untagged links, stripped referrers, payment redirects and links opened from a messaging app.
Ecommerce stores routinely see a substantial share of orders land here, and the bucket is misleading because it is not neutral. Direct is where upper-funnel demand hides: someone who saw your ad last week, remembered the brand and typed it in gets recorded as free.
There is a cheap diagnostic. Cut upper-funnel spend materially and watch direct, branded and organic orders over the following weeks. If they fall, that traffic was never free, and the credit had been landing in the wrong bucket.
Cross-device and household journeys
As above, some journeys cannot be stitched without a login. Modelling can estimate the shape of what is missing, but it cannot recover the individual paths.
Correlation versus causation
This is the attribution problem in marketing that no model solves. Attribution observes what preceded a purchase, and it cannot tell you whether the purchase would have happened anyway.
Retargeting is the clearest example: it shows ads to people who have already chosen you, then takes credit when they buy. The attributed number is real while the incremental contribution may be close to zero.
The risk compounds when a belief is involved. If a team is convinced a channel drives awareness, it is straightforward to find a methodology that agrees, and vendors exist to supply exactly that. Any model crediting a channel generously while that channel produces almost no direct response is a claim awaiting a test.
Data silos and offline touchpoints
Ad platforms, the store, email, the warehouse and finance each hold one piece. Retail, wholesale and marketplace revenue often sit outside the attribution system, so a brand can write off a channel quietly driving Amazon sales nobody counts. Joining that data needs a governed data layer, and another scheduled export will not do it. See Open Data Layer.
Attribution reporting and analysis
Most attribution reports fail for one reason: they show what happened without supporting a decision. What you can learn from attribution reports depends on what they contain, and useful performance attribution reporting has four properties.
- The model and window are stated on the report, so two people comparing numbers know they are comparing the same thing.
- The evidence opens. A channel total is a claim, and the orders behind it are the evidence. If you cannot get from a number to the orders that produced it, you cannot defend it.
- New-customer and profit views sit alongside revenue, with blended ROAS demoted to context.
- There is a change worth making. A marketing attribution dashboard that ends in a chart has not finished the analysis.
Attribution web analytics tools give you the first property. The other three have to be built. Creative-level analysis is where attribution becomes most actionable, because creative is the variable you can change fastest. See Creative Intelligence.
How to set up marketing attribution: a 90-day plan
An attribution methodology, in the order that matters. Nothing has to be switched off on day one; run the new setup in parallel with existing tools and compare.
Days 1–30: foundation. Server-side tracking alongside the pixel, a shared event ID for deduplication, and live Conversions API connections. Audit consent handling and record your consent rate. Enforce one UTM convention everywhere, including email, affiliates and creators. Import COGS, returns and shipping costs. Target: tracked-order coverage known, and attributed orders reconciled to store orders.
Days 31–60: definitions and baseline. Define what counts as a new customer, which costs enter contribution margin, and which window you report on. Set a simple baseline model; it exists to generate hypotheses and does not need to be right. List the three channel claims where the model and the platforms disagree most.
Days 61–90: first test and first move. Size and run a test on the largest disputed claim. Add a marketing mix model if spend and history support it. Set the reporting cadence, then make the first budget move in a controlled step and record the result.
After that, recalibrate on a schedule. Attribution is a system you maintain; it never reaches a finished state.
Expect the first trustworthy version to take a quarter or two. Teams that skip step 1 rebuild everything later.
How to choose marketing attribution software
Marketing attribution technology has converged on much the same feature list, so these questions separate the options faster than any comparison grid.
- Is the measurement independent? A system that reports platforms' own numbers is doing reporting and not measurement.
- Can you inspect an individual order? Order-level evidence separates a number you present from a number you can defend.
- Does it handle profit as well as revenue? Contribution margin, returns and logistics costs need to be first-class inputs.
- Does it cover more than one method? Attribution plus marketing mix modeling plus experiments beats a better single model.
- Does it cover your whole business? Native channels, Amazon, subscriptions and retail, not just Meta and Google.
- Is the data yours? API access, exports and warehouse delivery determine whether you can leave.
- Does anything happen after the insight? Most marketing attribution systems stop at the report.
If you're still building a shortlist, start with 10 best marketing attribution tools or 10 best multi-touch attribution tools.
And if you already run a tool and the numbers don't reconcile, the two most common switches are covered in Triple Whale alternatives and Northbeam alternatives.
From attribution to budget decisions
Attribution earns its cost at the moment it changes an allocation. Until then, marketing attribution optimization is an expensive opinion.
The problem. Your reports show average ROAS: total revenue divided by total spend over the period. But you are never allocating the whole budget from scratch. You are deciding where the next slice goes, and that decision turns on what an additional €1,000 would return. What the previous €50,000 already returned is a different question.
The two numbers separate as a channel saturates. A branded search campaign might return €20 on its first €1,000 because it intercepts people already searching for you. By the tenth €1,000 it has exhausted that audience and returns almost nothing. The average still reads well, dragged upward by those early efficient euros, so the report looks healthy while recent spend earns back less than it cost.
This is why bottom-of-funnel channels look untouchable and scale badly. They saturate early. Upper-funnel campaigns often have flatter response curves and more room to absorb budget, even when their attributed returns look worse on paper.
The fix. Three practices, in order:
- Estimate a response curve for each channel and campaign, so you can see where returns start flattening instead of inferring it from an average.
- Move budget in controlled steps and measure the result, so every shift produces evidence for the next one.
- Separate the allocation decision from channel execution. When the people running a channel also decide how much it receives, every review turns into a negotiation. Brands running several agencies feel this most.
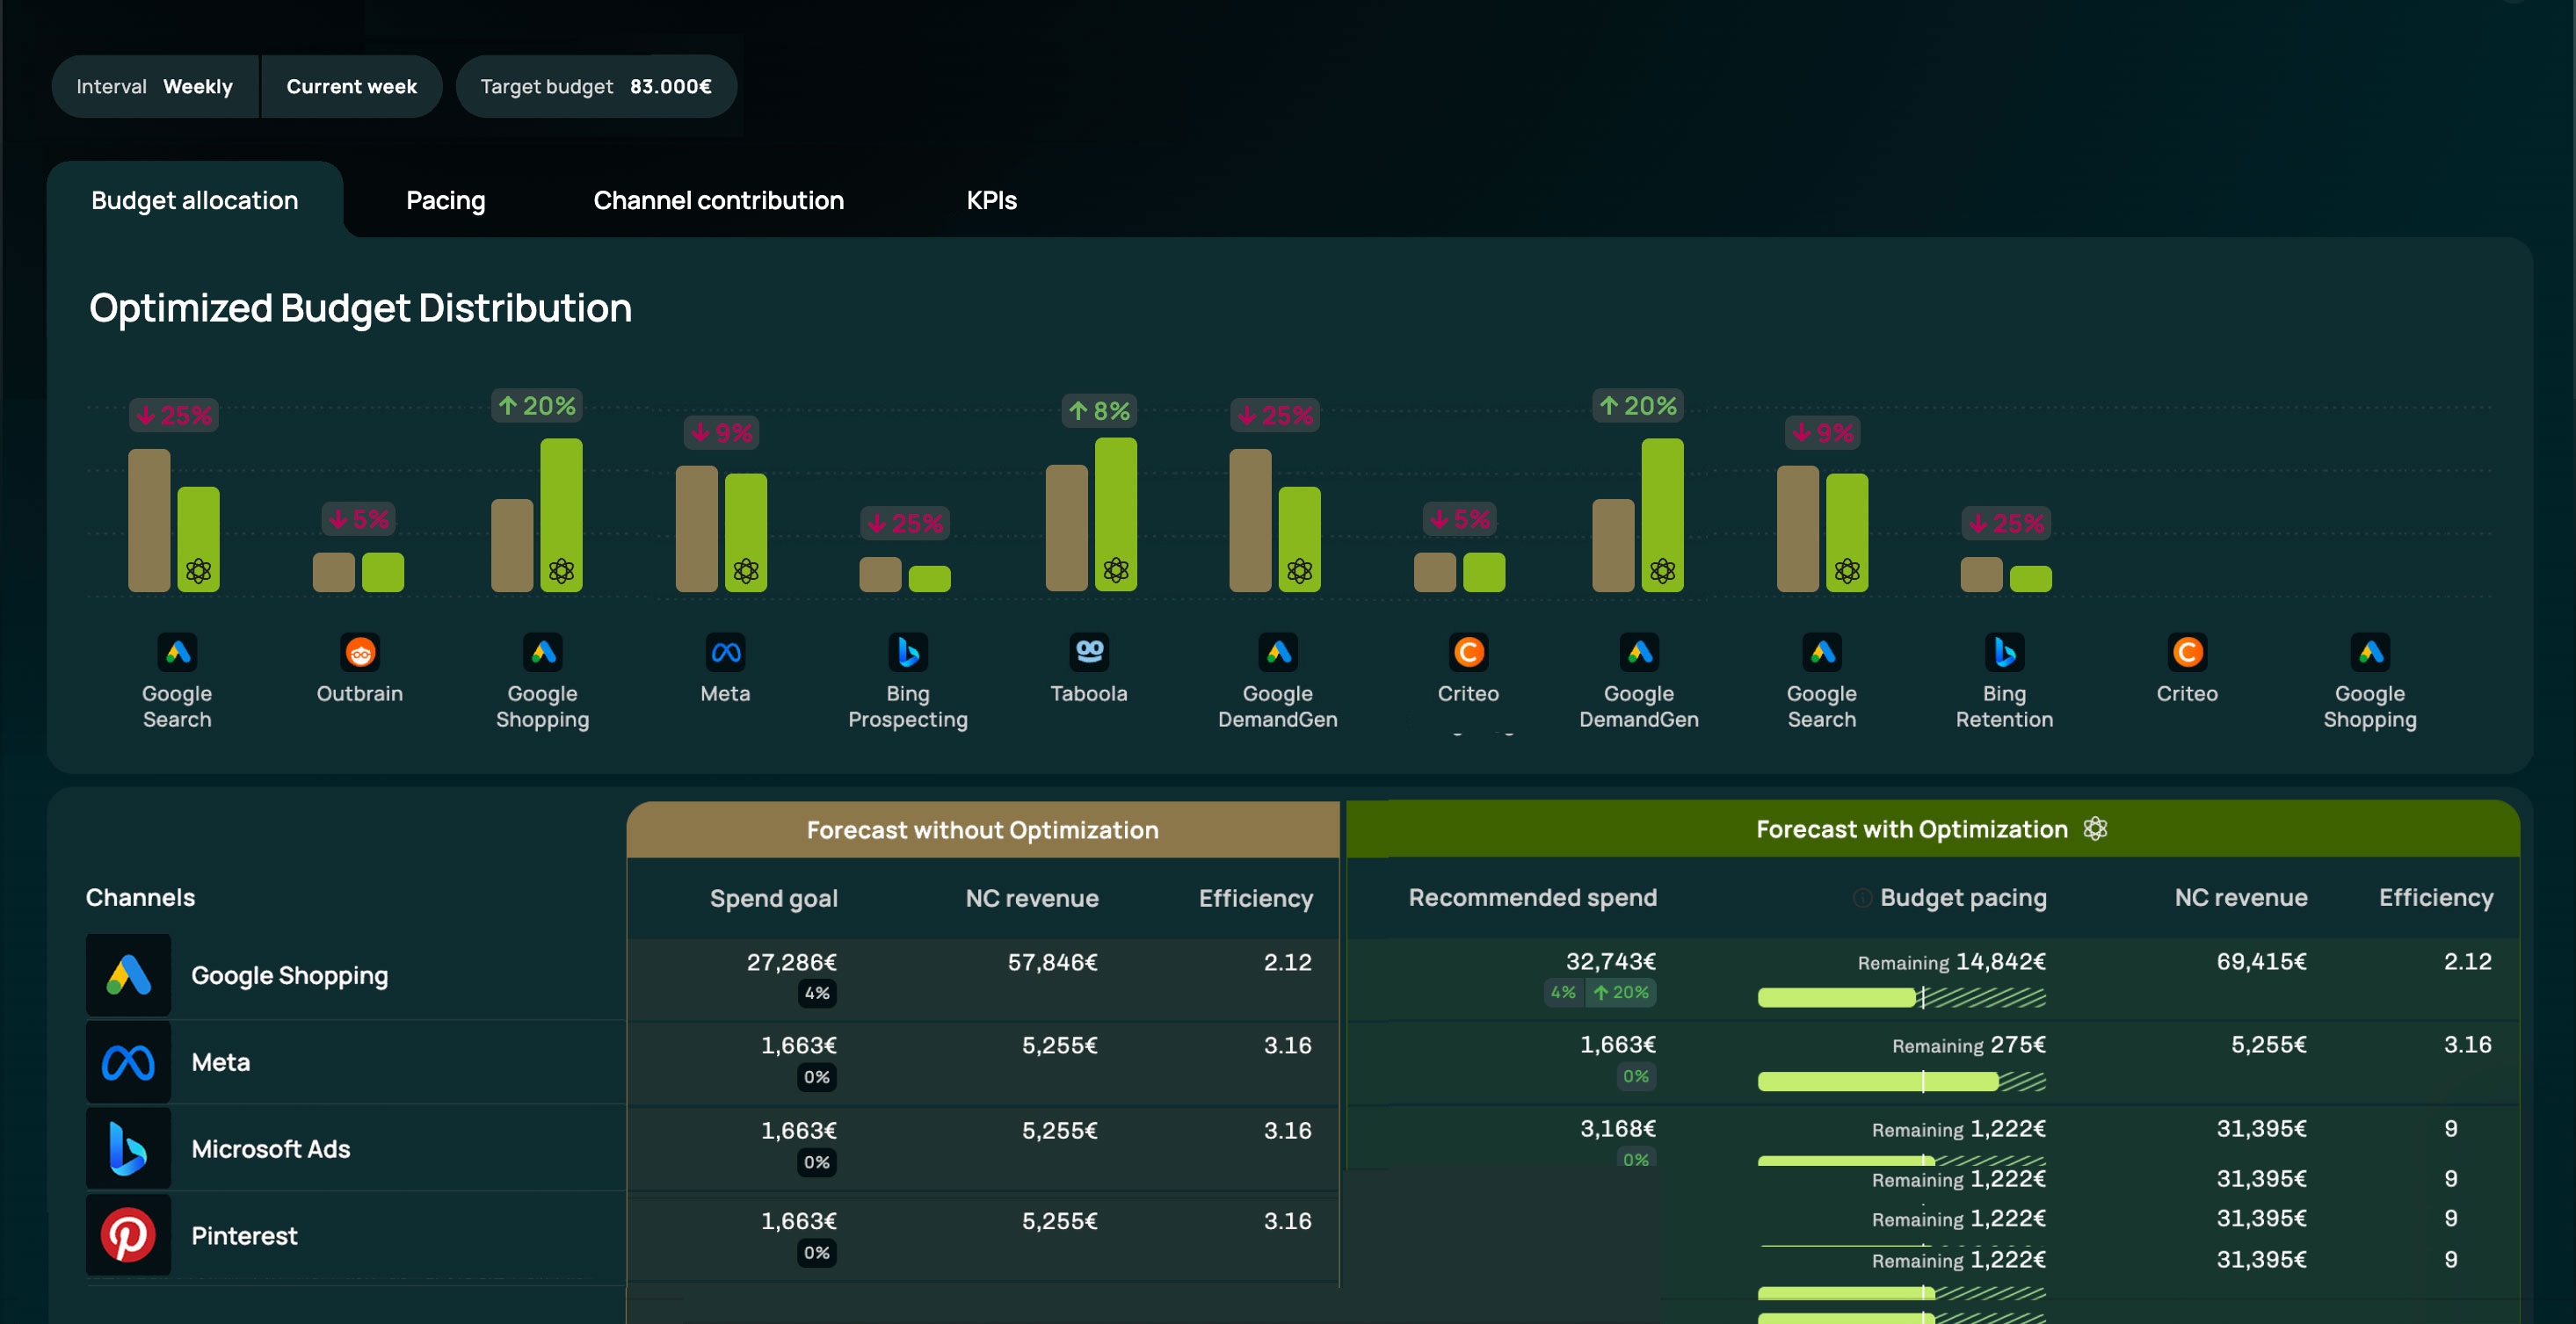
That loop, measuring independently, expressing results in contribution profit, allocating against it and verifying the outcome, is what Admetrics calls ProfitOps.
FAQ
What is attribution in marketing?
What attribution means in marketing is assigning credit for a conversion to the touchpoints that preceded it, so a brand can see which channels, campaigns and creatives produced revenue instead of only seeing which one happened to be last.
What are the four types of attribution?
The four most commonly cited are first click, last click, linear and time decay. A fuller list adds last non-direct click, position-based, W-shaped and full path, plus data-driven models such as Markov chains and Shapley values.
How do you measure marketing attribution?
Capture touchpoints through UTMs, click IDs, server-side tracking and first-party data; anchor them to store orders and deduplicate; apply a model; then validate against marketing mix modeling and controlled experiments. Report tracked-order coverage alongside the results. Measurement quality is set at the capture stage, long before the modelling stage.
Why do my Meta, Google and TikTok conversions add up to more than my orders?
Each platform counts every conversion inside its own window without knowing what the others claimed, so one order can be counted several times. The fix is an independent layer anchored to store orders that credits each order once.
Is Google Analytics 4 enough for attribution?
For one or two channels and modest spend, it is a reasonable baseline. It misses orders lost to consent and ad blockers, cannot see impressions on Meta, TikTok or native platforms, and reports revenue rather than contribution margin. Use it as a benchmark, not the only basis for large budget decisions.
At what ad spend does an attribution tool pay off?
It depends on margin and channel count more than on a fixed number. A simple test: if a few percent better allocation of your monthly spend exceeds the tool's cost, it pays.
What is MER?
Marketing efficiency ratio: total revenue divided by total marketing spend. It cannot tell you which channel worked, but it cannot be inflated by attribution either, which makes it a useful check beside channel-level numbers.
What is non-attribution traffic?
Sessions arriving with no identifiable source, including typed URLs, untagged links, stripped referrers and payment redirects. It usually contains real demand created by upper-funnel activity, so reading it as organic will cost you money.
Is post-purchase survey attribution reliable?
As a validation layer, yes, especially for unclickable channels. As a primary source, no: response rates are low and skewed, and customers misremember.