Most MER figures come from one division: last month's revenue over last month's ad spend, set against a band someone found in a blog post.
The agency usually divides by ad spend only and finance usually starts from net revenue. The same month ends up with two MERs, and neither says whether marketing made money.
This marketing efficiency ratio calculator answers that for your own store, in euros, and works out the MER a profit goal needs. Below it is a guide to the inputs and to the mistakes that make an MER look better than it is.
Free, no email, and it runs in your browser.
How to use the MER calculator
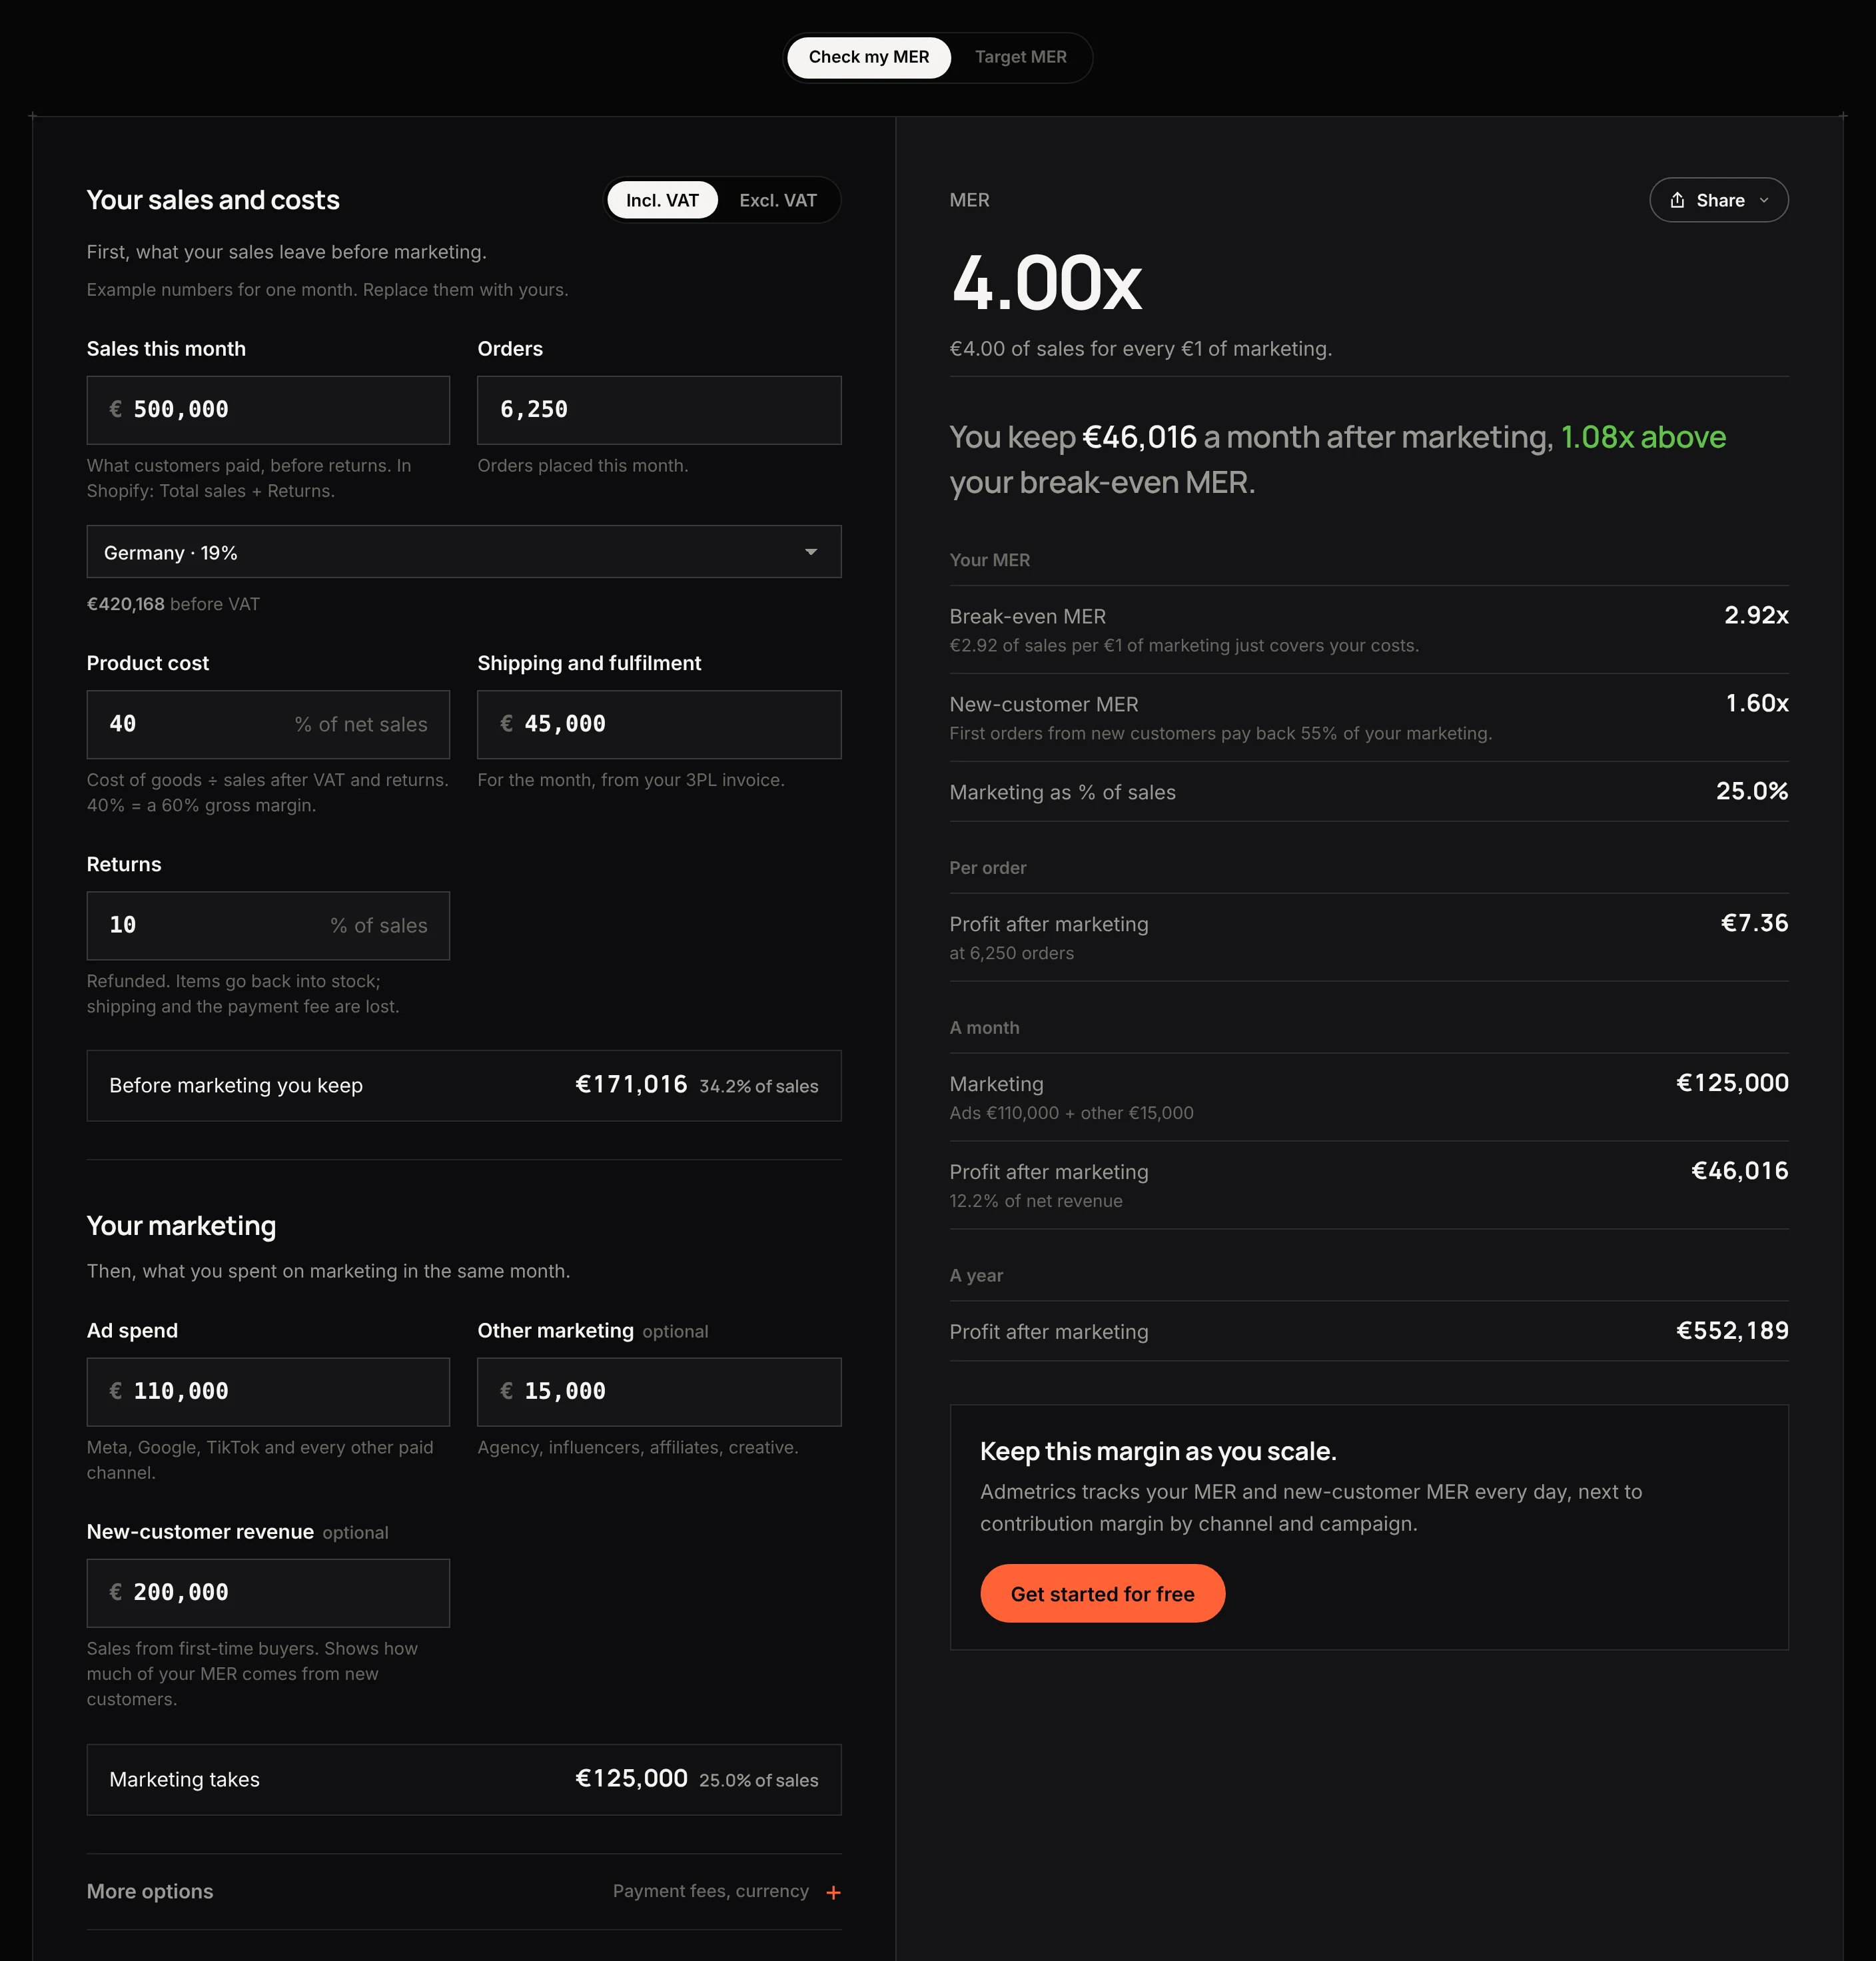
Pick the tab first. Check my MER looks at a month that has closed and tells you whether its marketing paid. Target MER starts from the profit you want and gives you the MER you need and the most you can spend a month.
The card opens on example numbers for one month. Replace them with yours, all from the same calendar month:
- Sales this month: Total sales plus Sales reversals (formerly Returns) from Shopify Analytics. Shopify's Total sales already has returns taken off and includes VAT and the shipping customers paid. Set Incl. VAT and pick the country.
- Orders placed in the month.
- Product cost as a share of net sales, from the P&L.
- Shipping and fulfilment, the month's total from the 3PL invoice.
- Returns, the share of sales refunded, from Shopify Analytics.
- Ad spend from Meta Ads Manager, Google Ads, TikTok Ads Manager and any other paid channel.
- Other marketing: the agency, influencers, affiliates and creative.
- New-customer revenue (optional): sales from first-time customers.
On Target MER, Your goal takes the place of the marketing fields: the profit you want after marketing, as a share of net revenue. More options has the payment fee presets and the currency. Share copies the result with its main inputs, as text or as an image.
How to calculate MER
Eight steps, in the order you'd work through a month that has just closed.
1. Agree what goes into MER before anyone calculates it
The marketing efficiency ratio formula is the easy part:
MER = sales ÷ total marketing spend
When two MERs for the same month disagree, the difference is almost always in what went into them, which is why the definition gets written down first:
| Choice | What to write down |
|---|---|
| Top line | Shopify Total sales + Sales reversals, VAT included |
| Marketing | Every paid channel, agency, influencers, affiliates, creative and gifted product at cost; no salaries |
| Period | One calendar month, closed, with marketing booked in the month it ran |
We built the calculator on Shopify's total sales before returns because that's the number the team already looks at. VAT and returns still count. They come off in the break-even in step 4. If finance reports on net revenue, run the MER, the break-even and the target on net revenue instead, and say so under the number.
2. Count every marketing cost, not just ad spend
Next to the ad accounts, add the agency retainer, influencer fees, affiliate commissions, creative production and product sent to creators, at cost.
If the agency buys media and bills it on its own invoice, take the media out of the invoice total. Otherwise the same euros get counted twice, once from Ads Manager and once from the invoice.
Leaving these costs out raises the ratio without changing anything in the business. Move budget from an in-house ad account to an agency, and an ads-only MER goes up while the store spends the same. Blended ROAS has this problem because it divides by ad spend alone.
We'd leave team salaries out. They don't change when a campaign starts or stops, and a new hire would otherwise show up as a drop in efficiency.
Book each cost in the month the work ran. A retainer invoiced once a quarter goes in as a third each month.
3. Work out what your sales leave before marketing
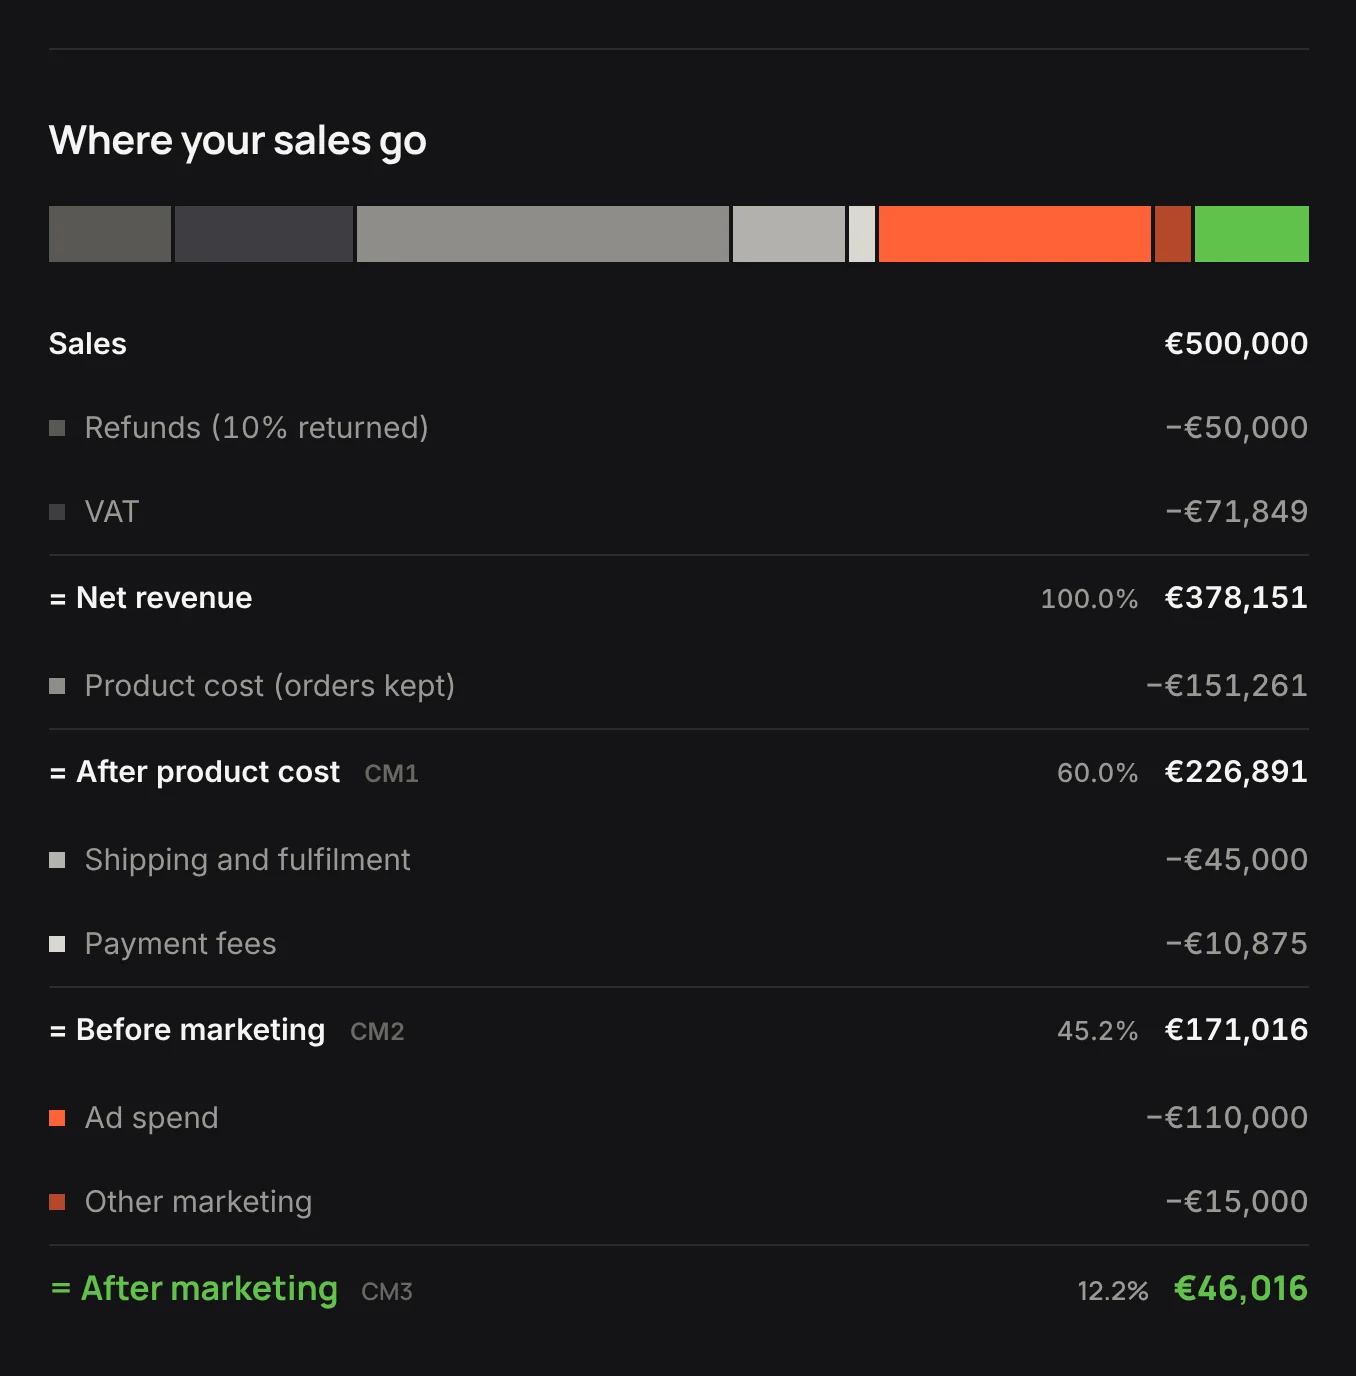
Marketing is paid out of what the month's sales leave after VAT, refunds, product cost, shipping and payment fees. The VAT rate is the one for the country you ship to. Refunds are in Shopify Analytics, product cost is in the P&L, and shipping and fees are on the 3PL invoice and the payment provider's statement.
A return costs more than the margin on the sale. The calculator puts returned items back into stock but counts the outbound shipping and the payment fee as lost. If returned goods can't be resold, as with opened cosmetics or food, add the written-off stock to product cost.
The calculator's example store sold €500,000 in one month, VAT included, and spent €125,000 on marketing. Before marketing, it had about €171,000 left, which is the most its marketing could have cost before the month made a loss.
4. Hold your MER against your break-even MER
Divide sales by what they leave before marketing and you get the break-even MER, the ratio at which profit after marketing is zero. The calculator shows it under your MER.
Break-even MER = sales ÷ what sales leave before marketing
Every shortcut gives a break-even that's too low. On the example store:
| Break-even built from | What it leaves out | Break-even MER |
|---|---|---|
| Gross margin only | VAT, returns, shipping, payment fees | 1.67x |
| All costs, VAT left in revenue | VAT | 2.34x |
| All costs, returns left out | Returns | 2.55x |
| All costs | Nothing | 2.92x |
Keep the MER and its break-even on the same top line. An MER on total sales next to a break-even on net revenue makes the month look much better than it was.
5. Read the gap in euros
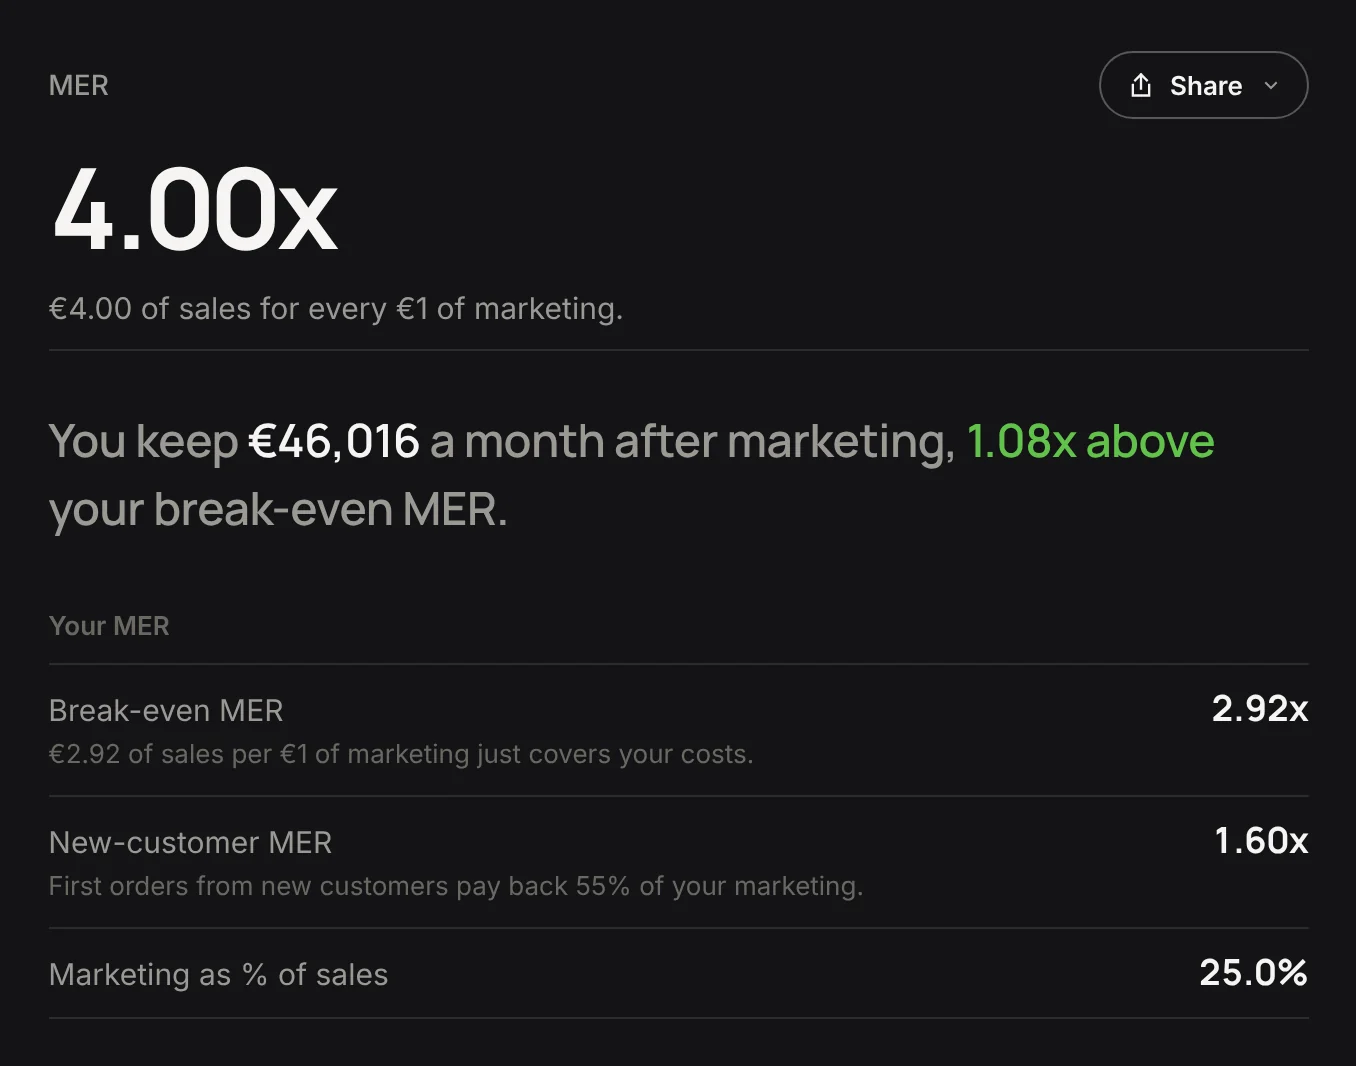
The sentence under the big number turns the gap between your MER and the break-even into euros for the month, and the rows below give the same figure per order and per year.
The example store's MER of 4.00x leaves about €46,000 a month after marketing.
That figure is contribution after marketing. Salaries, rent and software come out of it afterwards, so compare it with the month's fixed costs on the P&L before you call the month profitable.
6. Split out what new customers pay for
Blended MER counts every order, including those from returning customers who might have bought without this month's ads. If a lot of your sales are refills, subscriptions or seasonal reorders, it can stay flat while new customers get more expensive.
New-customer MER divides first-time customers' sales by all marketing. Some teams call it aMER (acquisition MER), and some include reactivated customers. We count first-time buyers only. Shopify Analytics splits sales into first-time and returning customers; use the first-time figure, on the same basis as your sales line.
In the example store, first orders pay back 55% of the month's marketing. Returning customers cover the rest.
How long a new customer may take to pay back the remainder is a cash question for finance. We'd report new-customer MER next to blended MER every month when returning customers make up a large share of sales.
7. Set the target from your profit goal, not from a band
Write the goal as profit after marketing, as a share of net revenue. If the plan is set in net profit, add your fixed costs as a share of net revenue first, because the calculator's profit comes before salaries and rent.
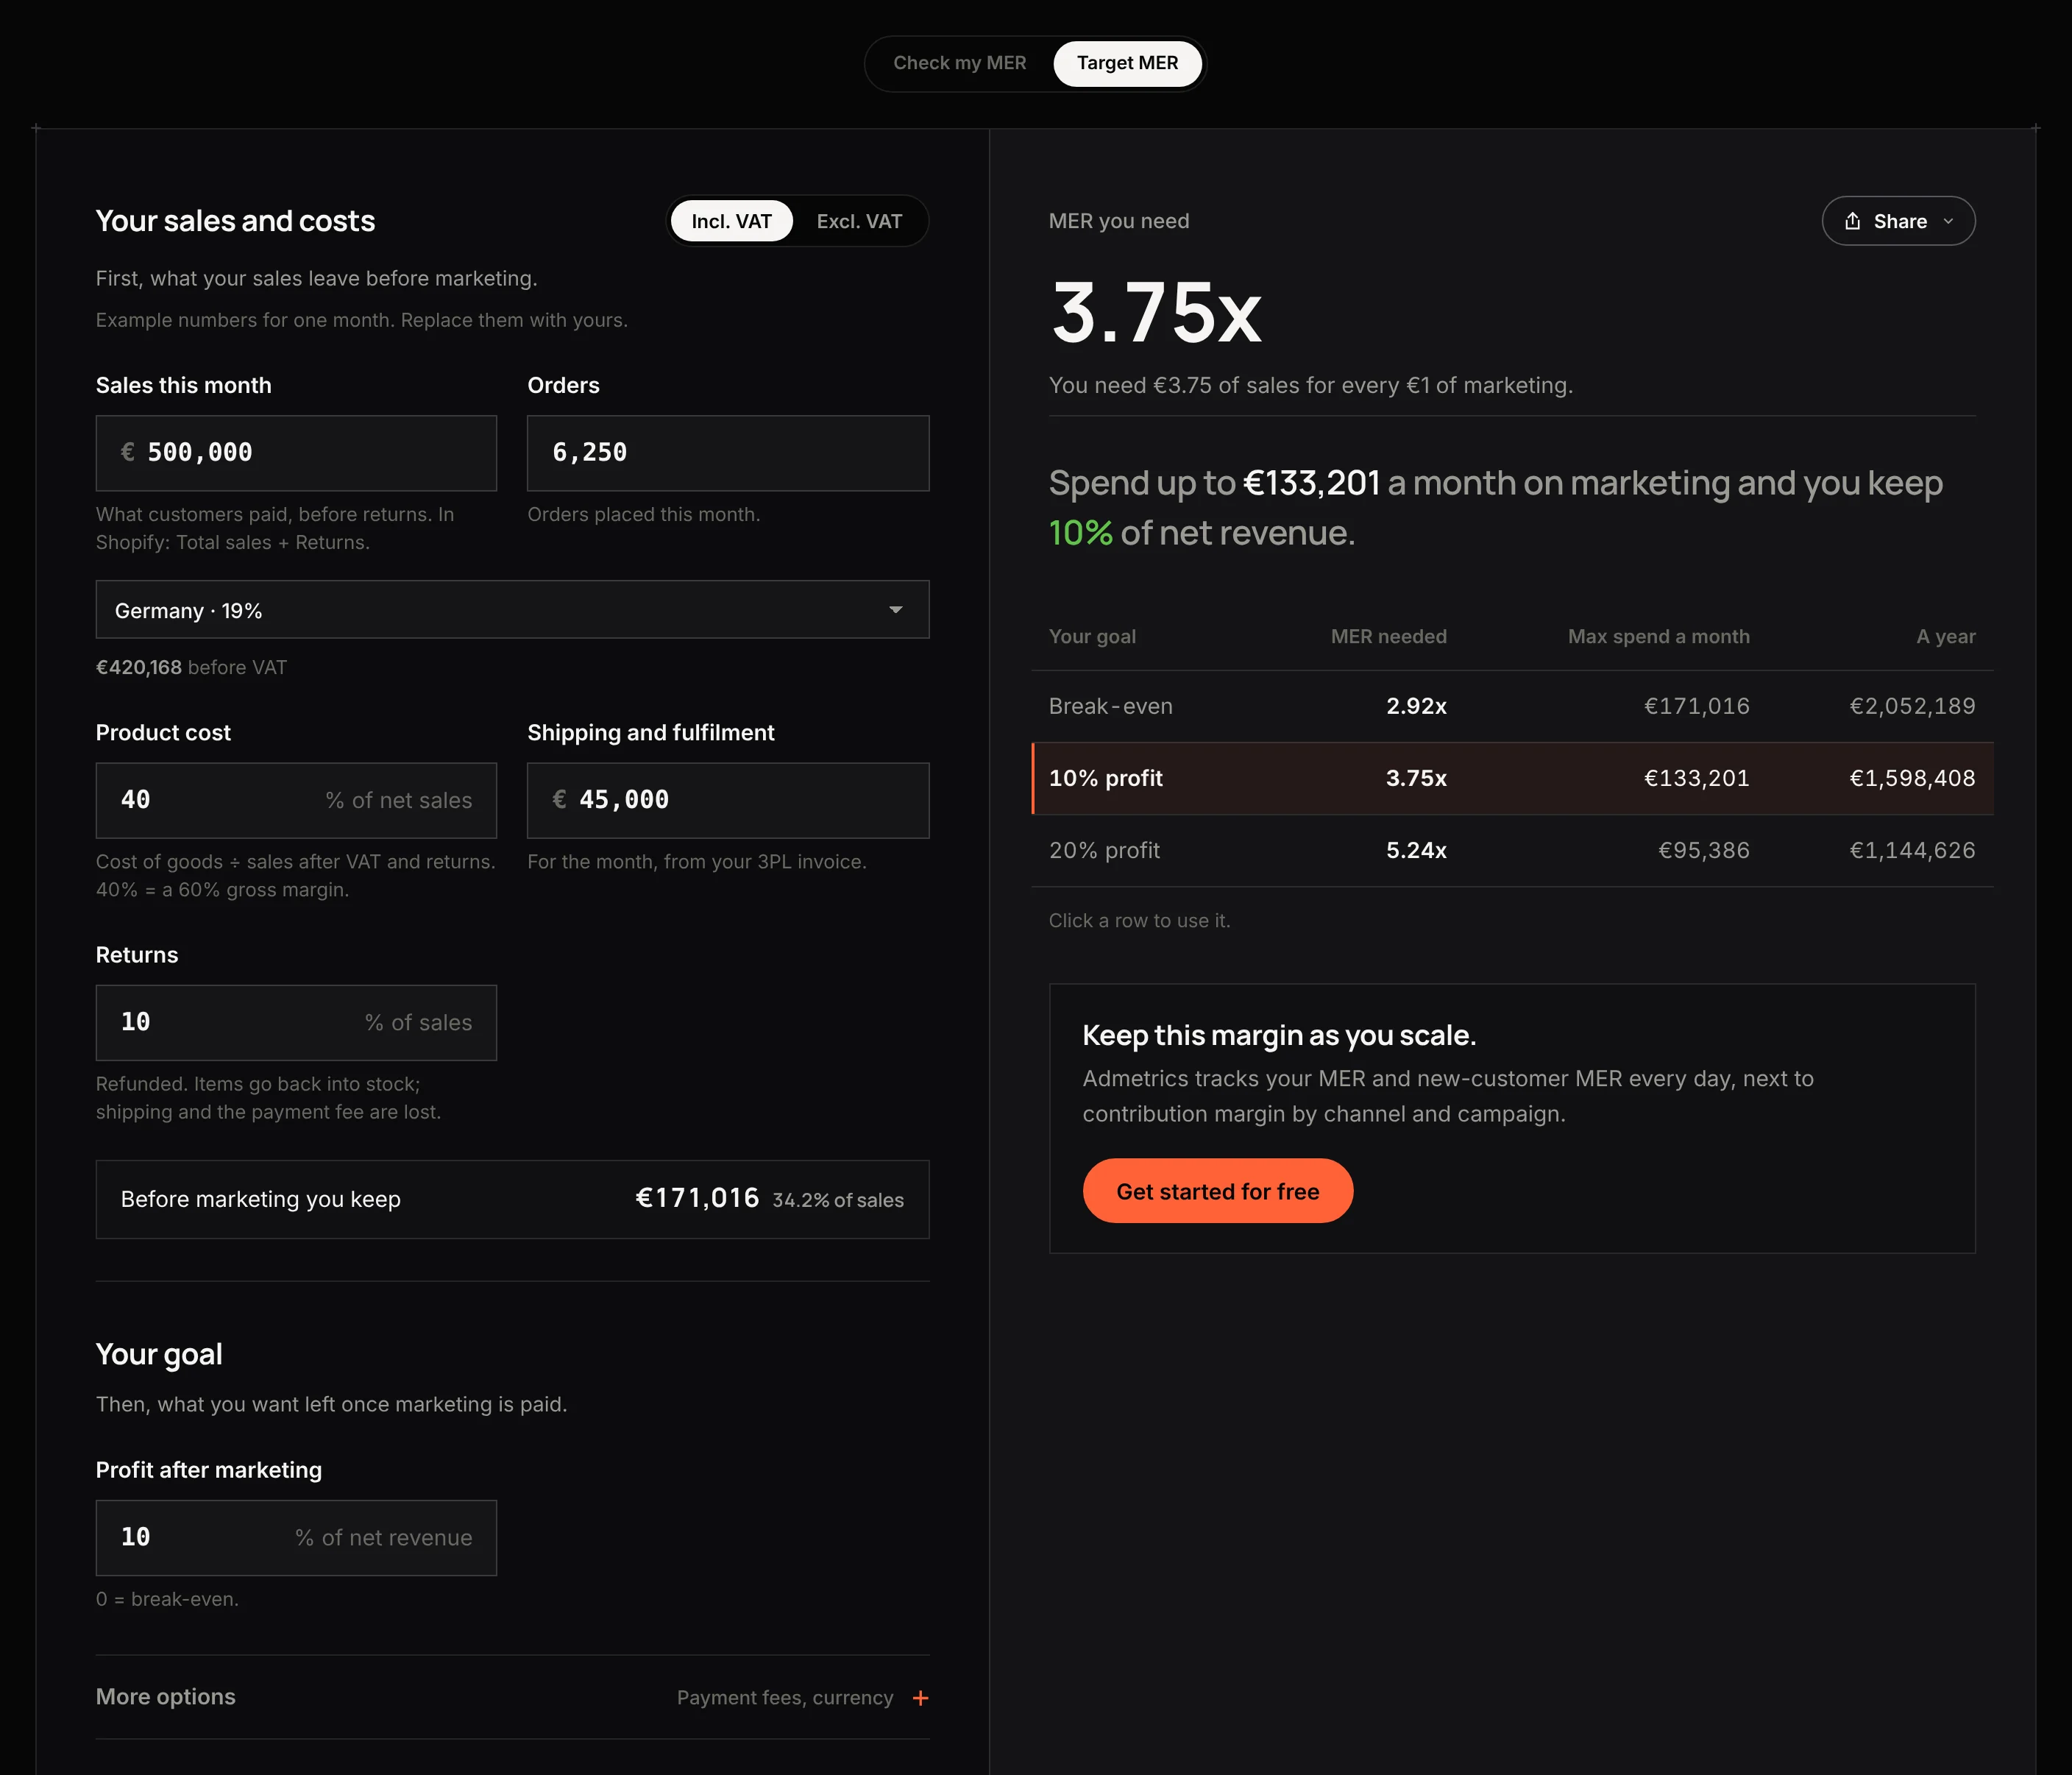
On the Target MER tab, the calculator takes that profit away from what sales leave before marketing, and what's left is the most you can spend on marketing in a month. Sales divided by that amount is the MER you need.
For a 10% profit on net revenue, the example store needs 3.75x and can spend up to about €133,000 a month.
The ceiling assumes today's sales, and more spend usually brings back less per euro. Raise spend toward it in steps and check MER after each one.
MER sizes the total. Splitting it between campaigns is a job for platform ROAS inside each channel. ROAS can't size the total, because each platform counts its own conversions: Meta's default attribution includes one-day view-through conversions, and Meta and Google often both claim the same order.
8. Recheck every month on the same definition
Rerun the calculator when the month closes. Rerun it sooner after a price change, a new 3PL rate card, a rise in returns after a sale or more orders going to a country with a different VAT rate, because each of these moves the break-even even if marketing spend stays put.
When someone brings a different MER, rebuild it on their definition before comparing. On net revenue, the example store's month comes out at 3.03x, while the break-even on that basis falls in the same proportion and the profit after marketing doesn't change.
For a board or investor update, show the trailing three months next to the month, since one sale or one late invoice can swing a single month. Share → Copy text includes the main inputs. Add the order count and the payment provider, and whoever checks the number can rebuild it.
What is a good marketing efficiency ratio?
One that clears your break-even MER by the profit you planned.
Check my MER gives you the break-even, and Target MER gives you the goal. Below the break-even, marketing loses money. Between the two, it pays but misses the plan. Above the goal, it's on plan.
This page gives no range for that reason. The bands most pages quote ignore margin, and a store with thin margins, high returns or expensive shipping can sit inside them and still lose money on marketing.
What this calculator can't tell you
It reads one month at today's sales and doesn't model how sales respond when spend changes. The Target MER ceiling holds only at the sales you typed.
It takes one VAT rate per run. A store selling in Germany, Austria and Switzerland runs it once per main market, or types a blended rate under "Other rate".
Marketing goes in as one total, with no split by channel, and new-customer revenue is typed in by hand. Profit after marketing comes before salaries, rent and software, and returned items are assumed to go back into stock.
Admetrics tracks MER and new-customer MER every day, next to contribution margin by channel and campaign, with customers split into new, returning and reactivated. Its marketing mix modeling learns a response curve for each channel, and the Budget Optimizer turns those curves and a profit goal into a budget split across channels, within the limits you set, and simulates the plan before any money moves.

FAQ
What is MER in marketing?
MER, the marketing efficiency ratio, is a store's total sales divided by its total marketing spend for the same period. It reads as euros of sales for every euro of marketing, across all channels, and it doesn't depend on any platform's attribution. It says nothing about profit until you compare it with the break-even MER your costs set.
How do you calculate marketing efficiency ratio?
Take the month's sales from Shopify Analytics, Total sales plus Sales reversals, and divide by everything spent on marketing in the same month: ad spend on every platform plus agency, influencer, affiliate and creative costs. For the break-even MER, divide sales by what they leave after VAT, refunds, product cost, shipping and payment fees. Then compare the two.
What's the difference between MER and ROAS?
ROAS divides the revenue one platform credits to itself by that platform's ad spend. MER divides all the store's sales by all its marketing. Platforms count view-through conversions and often claim the same order, so adding up their ROAS overstates what the ads brought in. Use ROAS to compare campaigns inside a channel and MER to set and check the total.
Is MER the same as blended ROAS?
Close, and many teams use the names for the same number. Blended ROAS usually divides all revenue by ad spend alone, while MER, as this calculator counts it, also includes agency, influencer, affiliate and creative costs. On the example store, the ads-only version is 4.55x. Whichever name your team uses, write down what's in the denominator and keep it the same every month.
What is aMER?
aMER, or acquisition MER, divides revenue from new customers by all marketing spend. It shows how much of the marketing bill first orders pay back on their own, which the blended MER doesn't show. Definitions vary: some teams count reactivated customers as well. The calculator's New-customer MER counts first-time buyers only.
Should MER include agency fees and salaries?
Agency fees, yes, along with influencer fees, affiliate commissions, creative production and gifted product at cost, because they go up and down with campaigns. Salaries, no. The team costs the same whether a campaign runs or not and belongs with rent and software in fixed costs. Whatever you include, keep the list the same every month.