The quickest way to set an ad budget is to divide next month's revenue goal by the ROAS in Ads Manager. It also quietly assumes that every sale next month has to be bought, and that the next euro of ads will earn what the average one did last month.
Neither holds, least of all for a store with returning customers.
This marketing budget calculator starts from last month instead and settles three questions before the planning meeting: how much to spend on ads next month, what a revenue goal will cost in spend and in profit, and where more budget starts taking profit back. It sizes the ad budget, meaning the money that goes to Meta, Google and TikTok.
The calculator does the arithmetic. The guide below covers which numbers to feed it, which answer to plan on and the mistakes that make a plan look better on paper than in the bank.
Free, no email, and it runs in your browser.
How to use the marketing budget calculator
Pick the question first. Each of the three buttons at the top answers one:
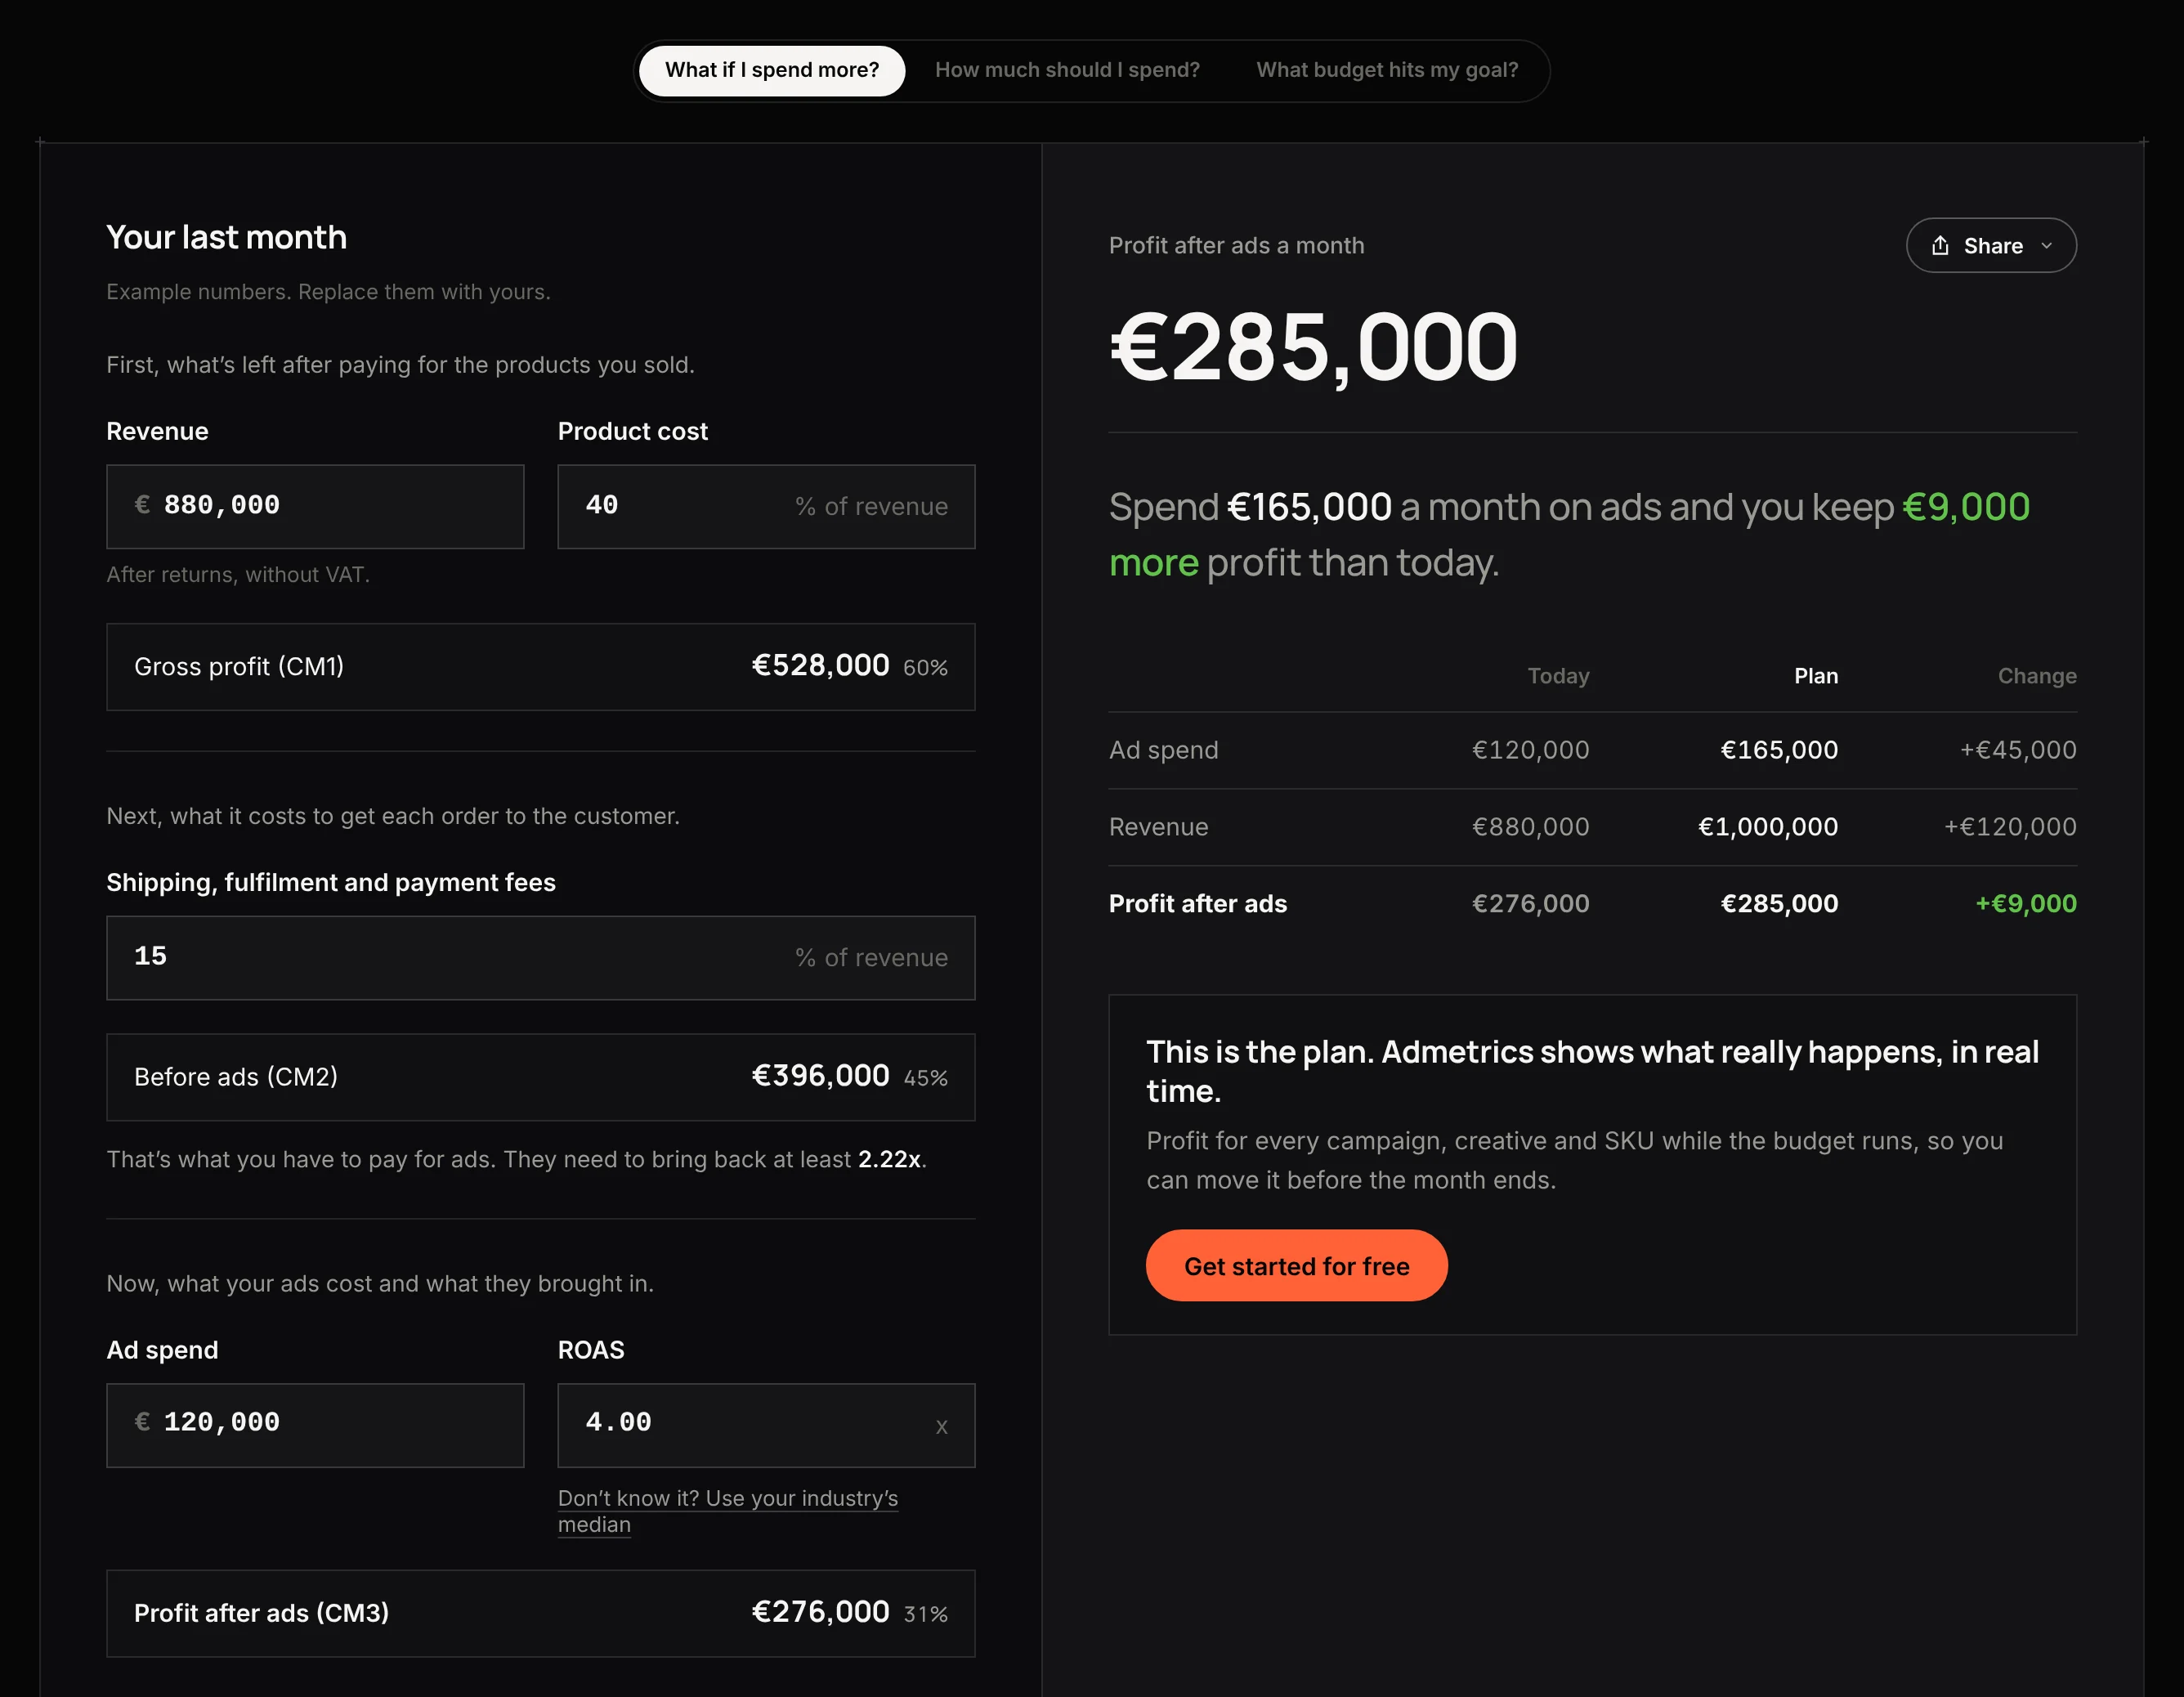
- What if I spend more? Type a planned monthly ad spend or tap a chip for a bigger budget. The big number is profit after ads a month, with a verdict and a Today | Plan | Change table.
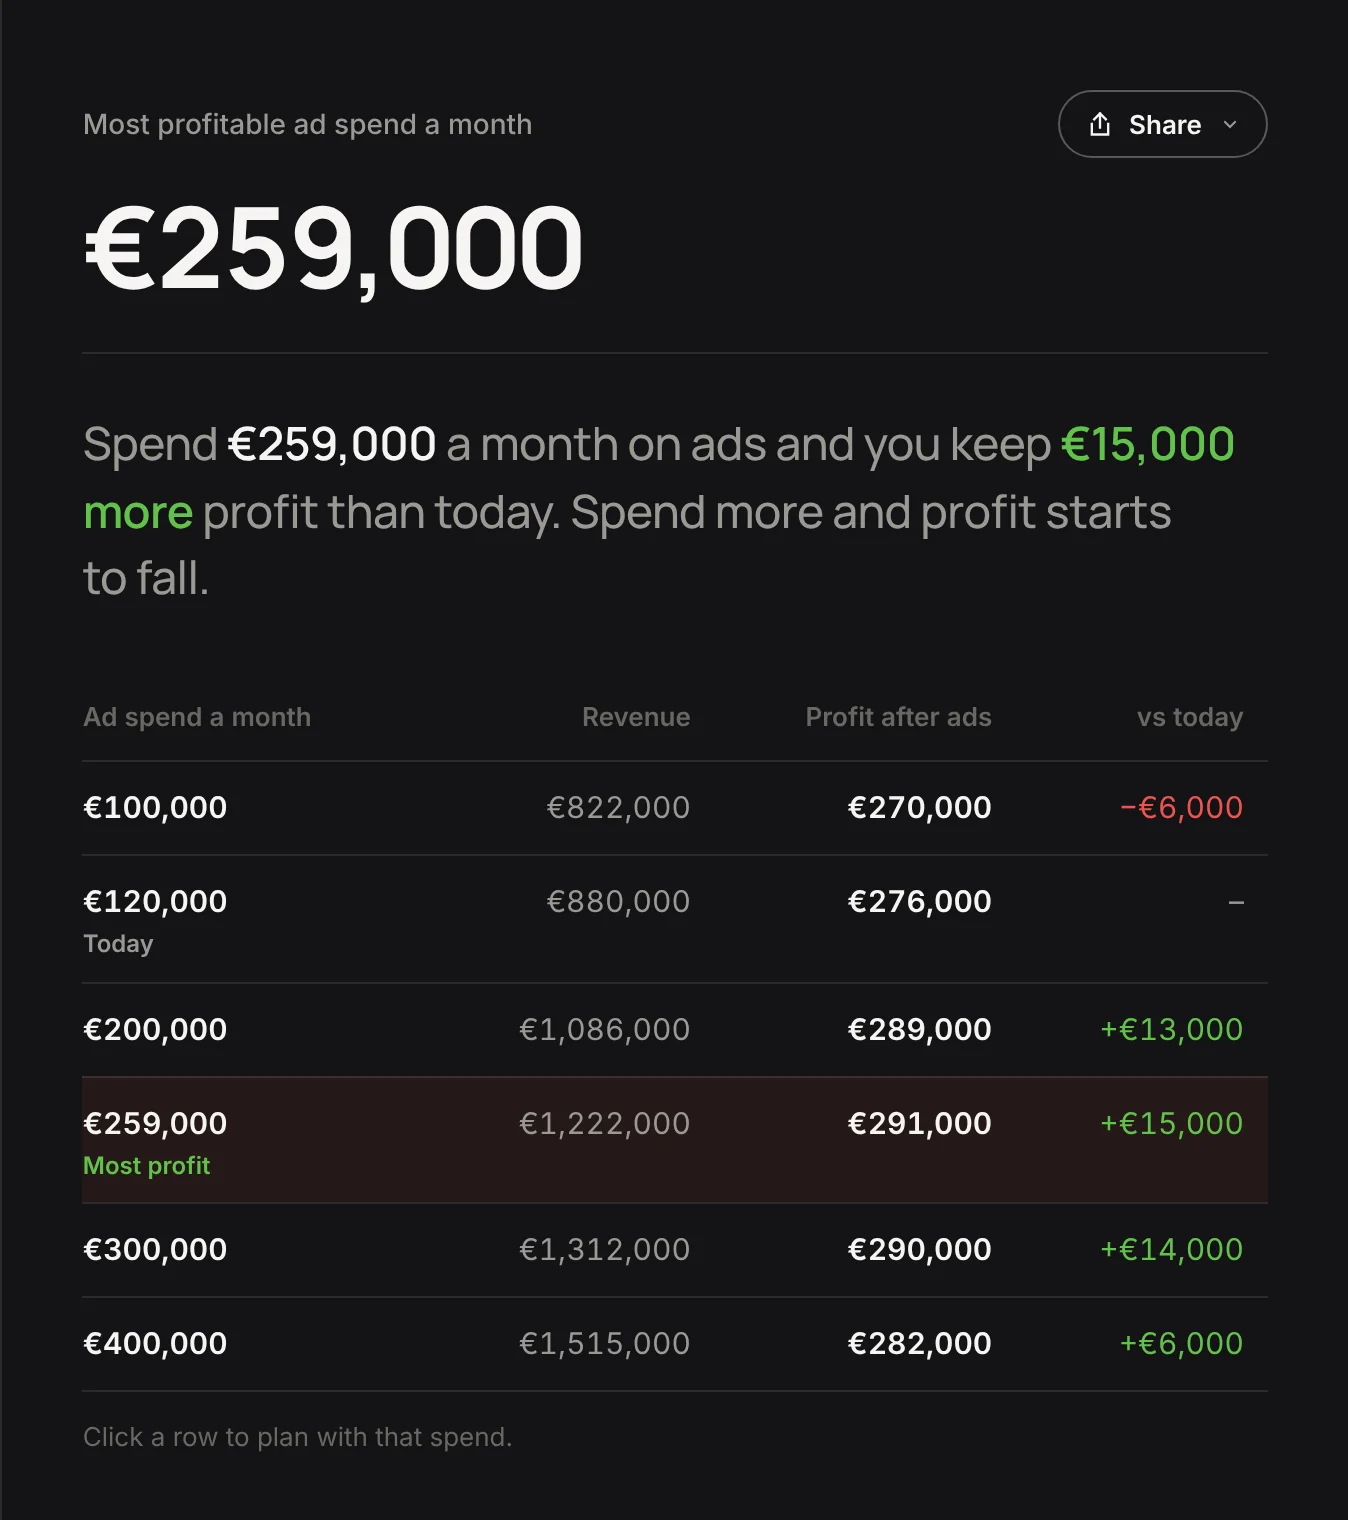
- How much should I spend? The big number is the most profitable ad spend a month, above a table of profit after ads at several spend levels. Click a row to plan with it.
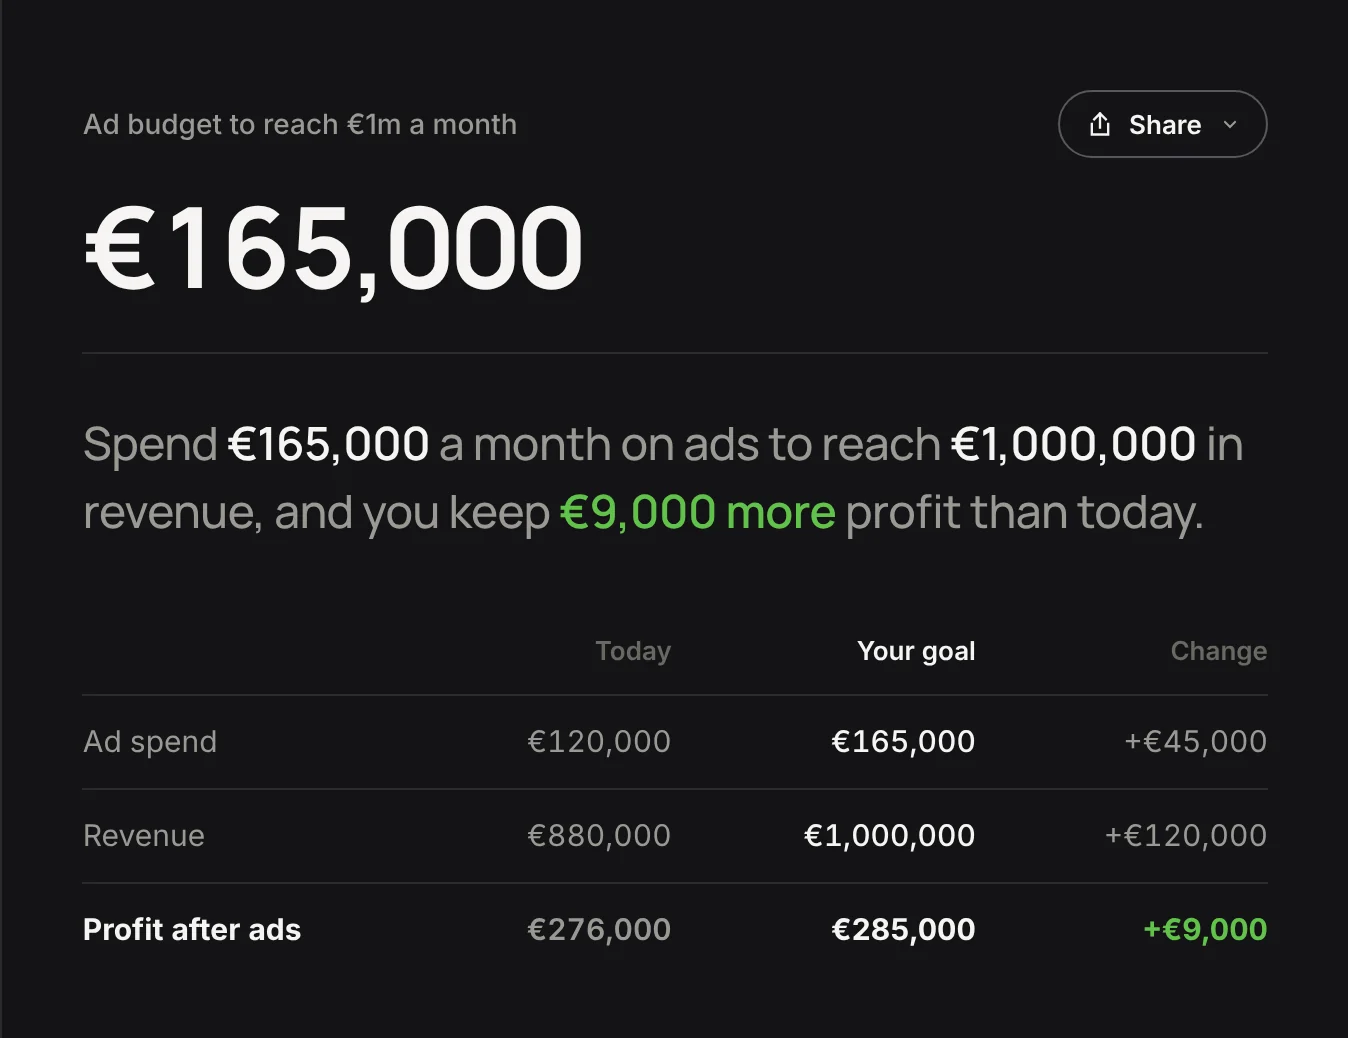
- What budget hits my goal? Type a revenue goal a month. The big number is the ad budget that reaches it.
All three read the card "Your last month," which comes loaded with an example store. Replace its five numbers with yours:
- Revenue, after returns and without VAT. Start from Shopify's sales report and take the VAT out if the report includes it.
- Product cost as a percentage of revenue, from the P&L.
- Shipping, fulfilment and payment fees as a percentage of revenue, from the 3PL invoice, carrier bills and the payment provider's statement.
- Ad spend for the month, added up across Meta Ads Manager, Google Ads, TikTok and anything else that ran.
- ROAS as the platforms report it: the revenue they claim, summed, divided by total ad spend.
Every platform goes into one total, which makes the tool an ad budget calculator, or a PPC budget calculator, for the whole account. Three strips add it up as you type: Gross profit (CM1), Before ads (CM2) and Profit after ads (CM3).
How to calculate a marketing budget
Eight steps, in the order a planning meeting needs them. The calculator reruns the arithmetic; the judgment calls are yours.
1. Size the ad budget and leave the department out
Agree before the meeting that the advertising budget is media spend and nothing else.
Salaries, agency retainers, creative production and software don't move when another euro goes to Meta. Mix them in and a bigger team starts to look like worse ads. If the plan has to end in net profit, enter them under fixed costs a month in More options, where they come off at the very end.
2. Start from what's left before ads
Ads are paid for out of what each sale leaves after the product, the parcel and the payment fee, so the budget starts there.
The calculator's example store sold €880,000 last month, spent €120,000 on ads at a platform ROAS of 4.0, and kept 45% of revenue once product, shipping and fees were paid. That 45% sets the floor: a euro of ads has to bring back at least 2.22x before it adds a cent of profit, and the Before ads (CM2) strip prints that line for your own numbers.
Gross margin doesn't show this. A store with fat product margins and expensive shipping can have less room for ads than one with thin margins and cheap parcels.
Watch the revenue line. Leave VAT in or forget the returns, and every plan the calculator gives looks better than it is.
3. Don't pay twice for revenue you'd get anyway
Returning customers, email, organic search and people who type the URL from memory buy whether the budget goes up or not. Divide the whole goal by ROAS and the plan pays the ads for sales the store would have made anyway.
We'd start every goal budget from the revenue the ads didn't bring, because it's the one part of next month that doesn't have to be bought.
The calculator does the split: ad spend times the platforms' ROAS is the revenue they credit to ads, and the rest of last month counts as revenue without ads. In "What budget hits my goal?", the big number covers only the gap.
For the example store, a €1m goal looks like this:
| Approach | What it assumes | Ad budget a month |
|---|---|---|
| Divide the whole goal by ROAS | All €1,000,000 has to come from ads | €250,000 |
| Take out the €400,000 that comes without ads | Ads bring the other €600,000 at an unchanged ROAS | €150,000 |
| Same, with returns falling as spend grows (Typical) | Each extra euro brings back a little less | €165,000 |
When we ran one store through 20 free budget calculators in October, none asked for revenue without ads, and the ad-spend ones mostly gave the first row.
4. Plan on the next euro, not the average
The ROAS in Ads Manager is an average over every euro spent last month, and the first of those euros found the people most ready to buy. Extra budget reaches colder audiences, and each added euro returns a bit less than the last while the average stays higher and flatters the plan.
The return on that next euro is called marginal ROAS, and no ad platform reports it. In the example store it's about 2.80, well under the platforms' average and still above break-even.
As long as the next euro beats the break-even ROAS, more spend adds profit.
The calculator models the drop with "How fast returns fall as you spend more" under More options: Fast, Typical (the default) or Slow. It's an assumption, and the tool can't measure it. Look for a month when spend jumped and check how much platform revenue came with it; without one, run all three before the meeting.
5. Bring two numbers to the meeting, and plan on the lower one
Take the budget that hits the revenue goal and the budget that makes the most profit. The CEO asks for the first, the CFO for the second, and both are usually in the room.
Run "What budget hits my goal?" for the first and "How much should I spend?" for the second. For the example store:
| Ad spend a month | Revenue | Profit after ads |
|---|---|---|
| €120,000 (today) | €880,000 | €276,000 |
| €165,000 (hits the €1m goal) | €1,000,000 | €285,000 |
| €259,000 (most profitable) | €1,222,000 | €291,000 |
| €300,000 (past the peak) | €1,312,000 | €290,000 |
Revenue keeps rising with every extra euro. Profit peaks at €259,000 of ad spend.
When the goal budget sits below the most profitable spend, as it does here, the goal pays for itself. When it sits above, every euro past the peak buys revenue with profit. A launch can justify that, as long as the meeting makes the trade on purpose.
We'd plan on the lower of the two numbers by default. The top of the profit curve is almost flat, the last stretch depends most on the curve setting nobody has measured, and a plan that stops short can always be raised in week two.
6. Give the agency a ROAS target the plan can hit
When the budget goes up, the ROAS target has to come down, and the brief should say so.
Hold a bigger budget to last month's average and the agency is being asked for something the curve rules out. They either miss the target or quietly underspend to protect it.
At the goal budget, the example store's ads average about 3.64x on the revenue the platforms credit them with, below today's 4.0 and still a good month. Copy plan for your agency writes the brief: spend a month, a week and a day, expected revenue, a target ROAS across all platforms and profit after ads.
7. Plan November on November
October is a poor guide to Black Friday. Returning customers come back for the sale and lift revenue without ads, CPMs climb as every brand bids for the same week, and conversion rates move with the discount.
Fill the card with last year's November, scaled to this year's size, or a recent peak week multiplied up to a month. The two forces pull in opposite directions. In an illustrative case where revenue without ads runs 20% higher, the example store reaches €1m on about €135,000. If CPMs push the platforms' ROAS down to 3.5 instead, the same goal needs about €172,000, while the most profitable spend drops to about €166,000.
That second case puts the goal just past the peak, and it's the one to rehearse before anyone agrees to double a channel for BFCM.
A discount also raises product cost as a share of revenue, and that field has to change with it.
8. Check the plan against the month
Rerun the numbers when the month closes, and sooner if prices, product costs or shipping rates change.
Then put the actual month into the card next to the plan. The gap shows whether the curve setting was right, the one input you picked rather than measured, and the next plan starts from a better guess.
What percentage of revenue should you spend on marketing?
Work out the plan first and read the percentage afterwards. For the example store, ad spend rises from 13.6% of revenue last month to 16.5% at the goal.
A percentage-of-revenue rule sizes a whole ecommerce marketing budget, with people, agencies, tools and media in one figure, and it knows nothing about your margin or your revenue without ads.
We'd never set the ad budget from a percentage, and we'd still track one. If the share creeps up month after month while profit after ads stays flat, the next euro has stopped paying.
What this calculator can't tell you
It plans on last month and on what the ad platforms say about it.
The split between ads and no ads is an estimate. Platforms over-credit: Meta counts view-through conversions, and Meta and Google often claim the same order, which means the real revenue from ads is lower than they claim and the real revenue without ads is higher than the calculator assumes. Blended ROAS is worse as an input: it turns every euro of the month into ad revenue, and the "most profitable" spend for the example store jumps to about €1.95m.
How fast returns fall is a setting you pick. The tool also plans one total, with no split between platforms and no line between new and returning customers.
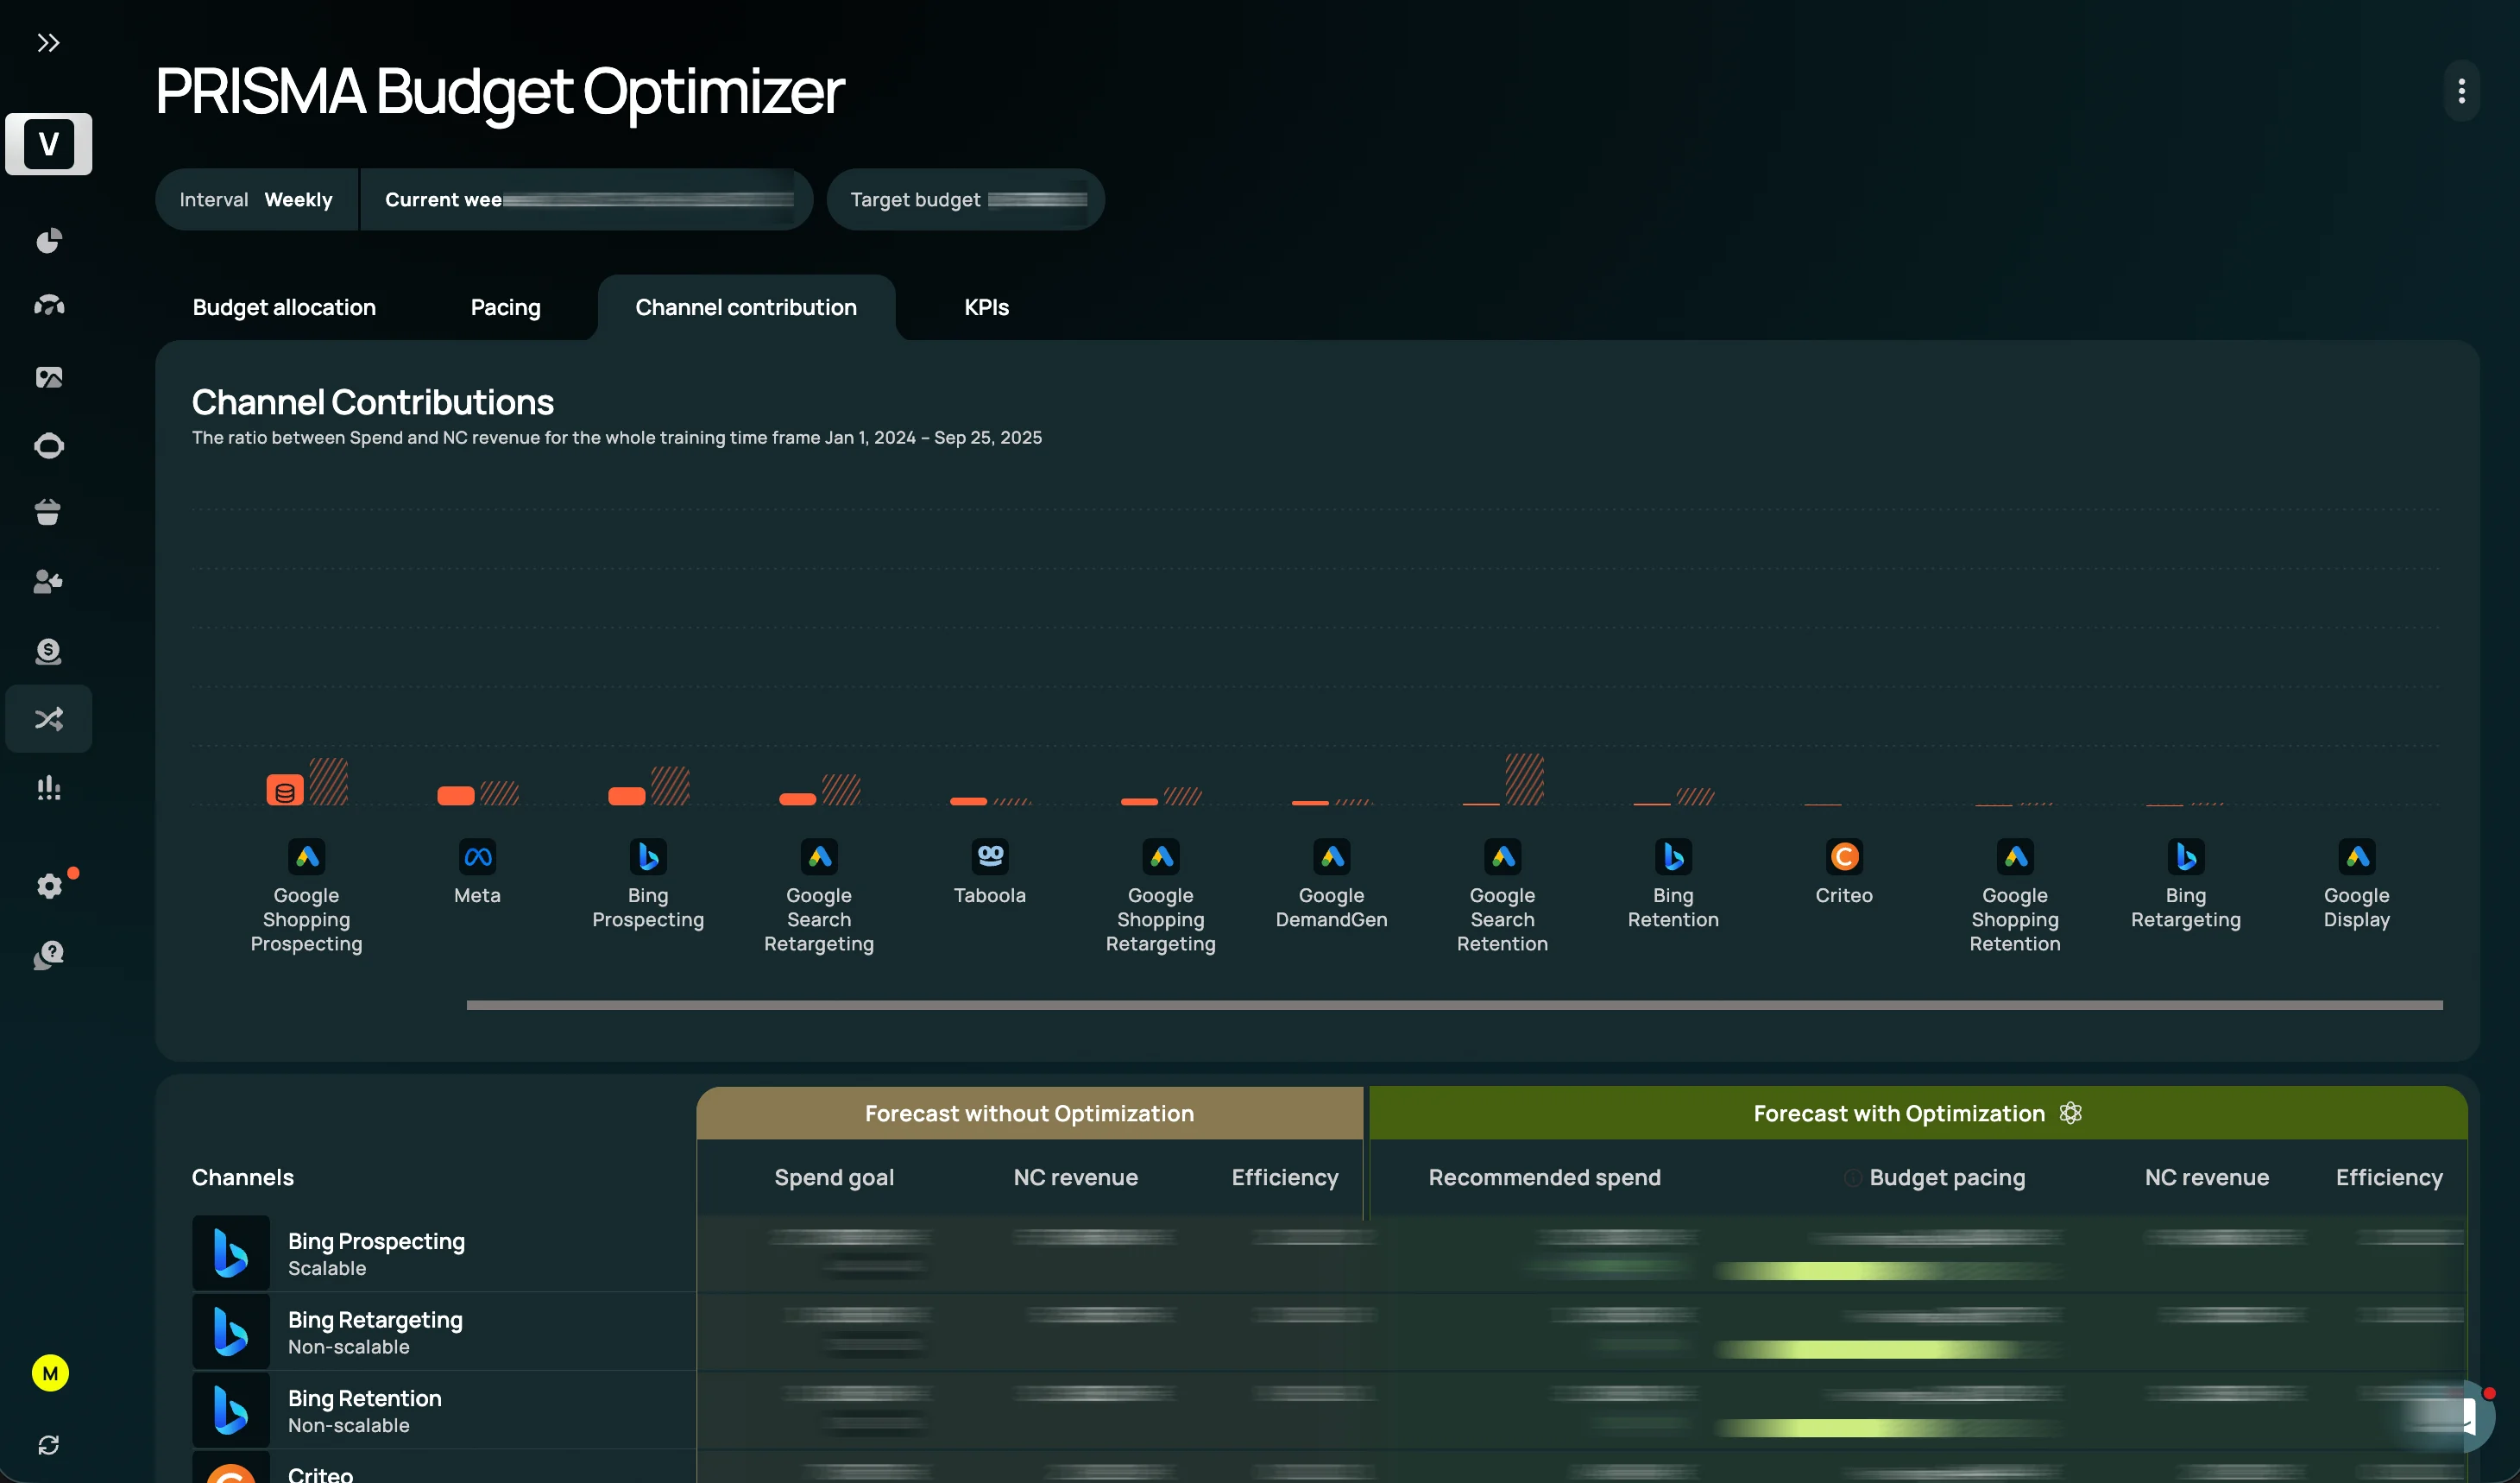
Admetrics answers those questions from your own data. Its marketing mix modeling learns a response curve for each channel, and the Budget Optimizer turns those curves and your profit goal into a budget split across channels, within the limits you set, then simulates the plan before any money moves. To see it on your own store, book a demo or check the pricing.
FAQ
How do you calculate a marketing budget?
Start from what revenue leaves after product, shipping and fees. Split last month's revenue into what the platforms credit to ads and what came without them. Ask the ads only for the gap to the goal, on a curve where each extra euro brings back less. Then check the result against the spend where profit after ads peaks.
How much should I spend on ads?
Up to the point where the next euro brings back your break-even ROAS, which is one divided by the share of revenue left before ads. Below it, more spend adds profit; above it, revenue keeps rising while profit falls. The "How much should I spend?" mode finds that point and shows profit after ads at the levels around it.
What is marginal ROAS?
Marginal ROAS is the revenue the next euro of ad spend brings back, as opposed to the average over all spend that Ads Manager reports. It falls as budgets grow, because extra spend reaches people less ready to buy. Profit after ads peaks where marginal ROAS drops to the break-even ROAS.
How do I calculate a PPC budget?
Treat paid search as part of the whole account's ad spend. Add up spend and platform-reported revenue across Google Ads, Meta Ads Manager and the rest, take revenue without ads out of the goal and size the remainder on a falling curve. Copy the plan with spend per week and per day, so pacing in each platform matches the monthly total.
Does a marketing budget include salaries and agency fees?
A department budget usually does. An ad budget shouldn't, because salaries and retainers don't change when another euro goes to Meta or Google. Keep media spend in the ad spend field and put salaries, rent and software under fixed costs a month in More options. They lower net profit without touching how much the ads should get.
Should I use blended ROAS or the ROAS in Ads Manager?
Use the ROAS the platforms report, summed across Meta Ads Manager, Google Ads and the rest. The calculator needs it to separate revenue from ads and revenue without ads. Blended ROAS divides all revenue by ad spend and treats every sale as bought. Platform ROAS over-credits too, but it leaves room for revenue that comes without ads.