Every order carries costs that do not care how much is in it. The pick and pack, the box, the shipping label and the fixed part of the payment fee cost roughly the same for a €40 order as for an €80 one. Spread over a bigger basket, they take a smaller share. That is why average order value is not a vanity metric: it is one of the few levers that raises profit per order without raising prices.
Black Friday puts that lever under pressure from both sides. Discounts pull the price of every item down. Free-shipping promises and gift wrapping push the cost per order up. A brand that goes into Black Week without a plan for basket size often ships more orders, each earning less, and finds out in December.
This guide covers what AOV is and what to include in it, how to segment it so it tells you something, how it connects to contribution margin, and nine ways to raise it, each with its effect on margin. It ends with a step-by-step method for setting a free-shipping threshold and a free AOV calculator.
Admetrics is a marketing measurement and budget platform for ecommerce and DTC brands. We measure what drove each order, work out the profit left after costs and returns, and help brands move budget toward what earns. The guide draws on what we see across more than 100 brands on the platform and on our BFCM playbook.
Key takeaways
- AOV is a profit lever, not just a revenue metric. In our worked example, raising AOV by a third raises contribution margin per order by more than half, because per-order costs stay flat.
- Calculate it on net revenue. Exclude VAT, shipping charges and cancelled orders, and decide how to treat refunds before you compare periods.
- One average hides the story. Segment AOV by new vs returning customers, channel, campaign and product, and look at the distribution, not only the mean.
- Track AOP beside AOV. Average order profit shows whether a bigger basket earns more or was bought with a discount.
- Set the free-shipping threshold slightly above current AOV, and make sure you sell items that bridge the gap.
- Bundles and thresholds protect margin; straight discounts erode it. A bundle at 15% off can still earn more per order than a single full-price item.
- Cross-selling pays. McKinsey estimates that cross-selling and category-penetration techniques can increase sales by 20% and profits by 30%.
What is average order value?
Average order value is the average amount a customer spends per order over a period.
AOV = revenue ÷ number of orders
If you took €52,000 from 1,000 orders last month, your AOV was €52. The formula is simple. The decisions behind it are where teams disagree, and where period-to-period comparisons go wrong.
What to include and exclude
Write the definition down. A team that changes it between October and December will believe AOV moved when only the formula did.
AOV, AOP and units per order
Three related numbers answer different questions:
AOV can rise while AOP falls, for example when a deep bundle discount buys a bigger basket. Watch them together. If you are new to contribution margin, our contribution margin guide explains CM1, CM2 and CM3.
Mean or median?
AOV is a mean, so a handful of very large orders can pull it up. Check the median order value too. If the mean is well above the median, a few big orders are carrying the average, and the typical customer spends less than your AOV suggests. That matters when you set a free-shipping threshold.
How to calculate and segment AOV
A single store-wide AOV tells you whether baskets grew. It does not tell you why, or where to act. Split it by the dimensions you can actually change.
A worked segmentation
An illustrative shop with an AOV of €52. The figures are made up, but the pattern of a split like this is common.
The store average hides a gap of more than €20 between a first order from paid social and a repeat order. Two conclusions follow. A free-shipping threshold set at €60 is close to what returning customers already spend, but a stretch for new ones. And paid social's lower conversion value per click may be partly a basket-size problem, which bundles on landing pages can fix.
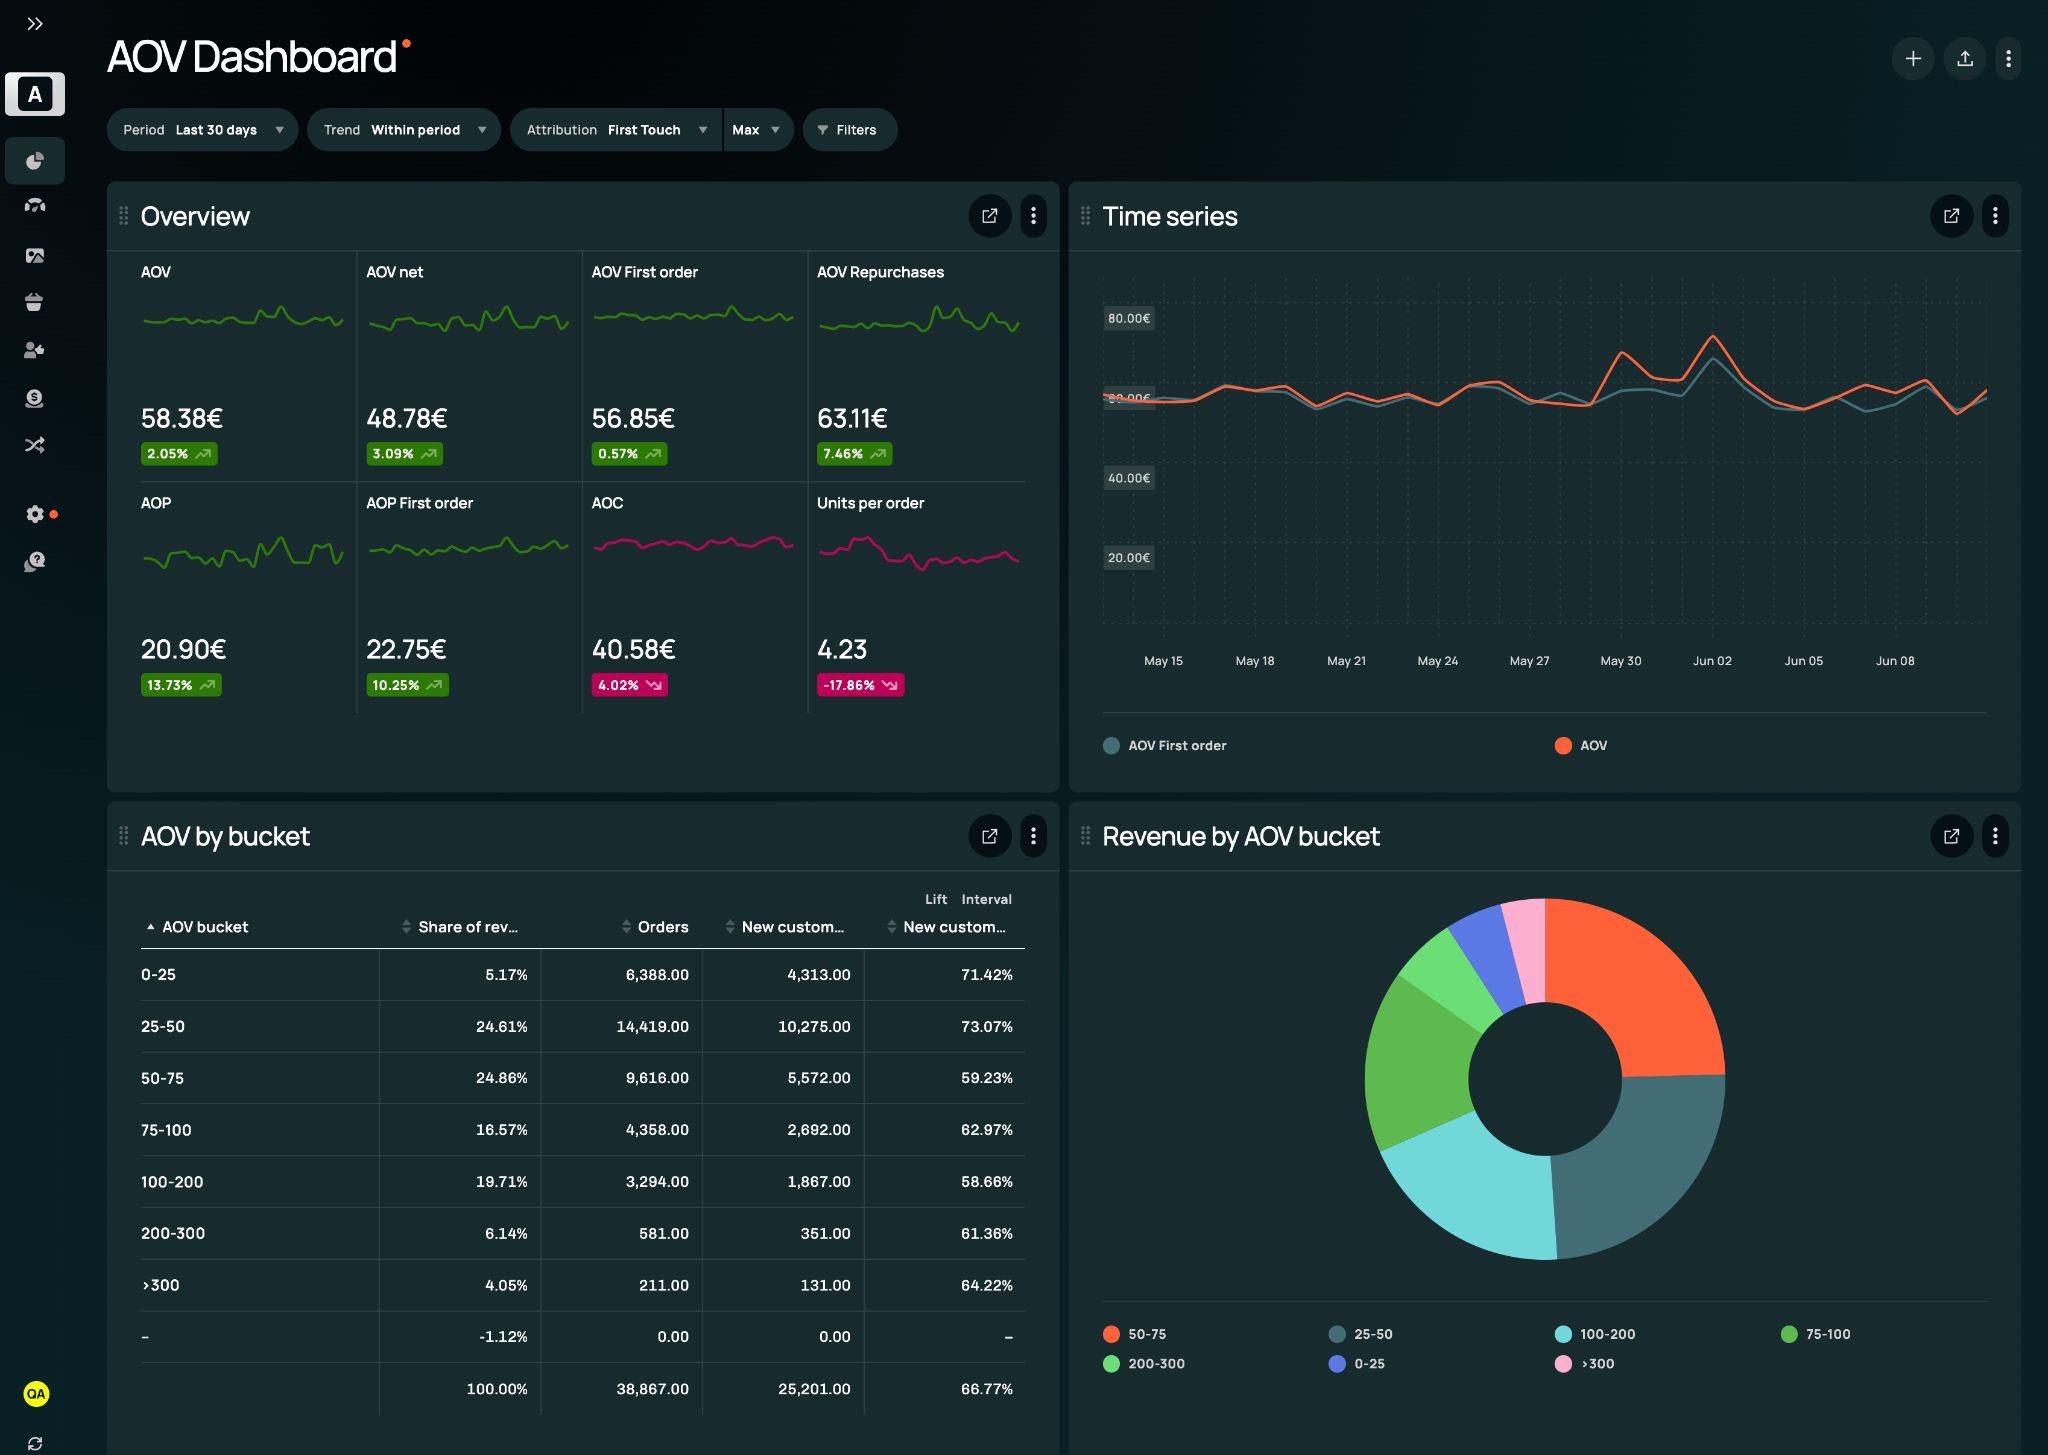
AOV dashboard showing AOV and average order profit for first and recurring orders, by order-value bucket.
The Admetrics AOV dashboard shows AOV and average order profit for first and recurring purchases, how they develop over time, and which order-value buckets bring the most revenue and profit. See Profit Intelligence.
Why AOV matters for profit
AOV matters because many costs are charged per order, not per euro. When the basket grows, those costs stay put, and more of each extra euro reaches contribution margin.
Worked example: three basket sizes, same costs
A shop with a 55% gross margin (CM1), €9 of fulfilment and shipping per order, payment fees of 2%, and €12 of ad spend per order. Illustrative numbers.
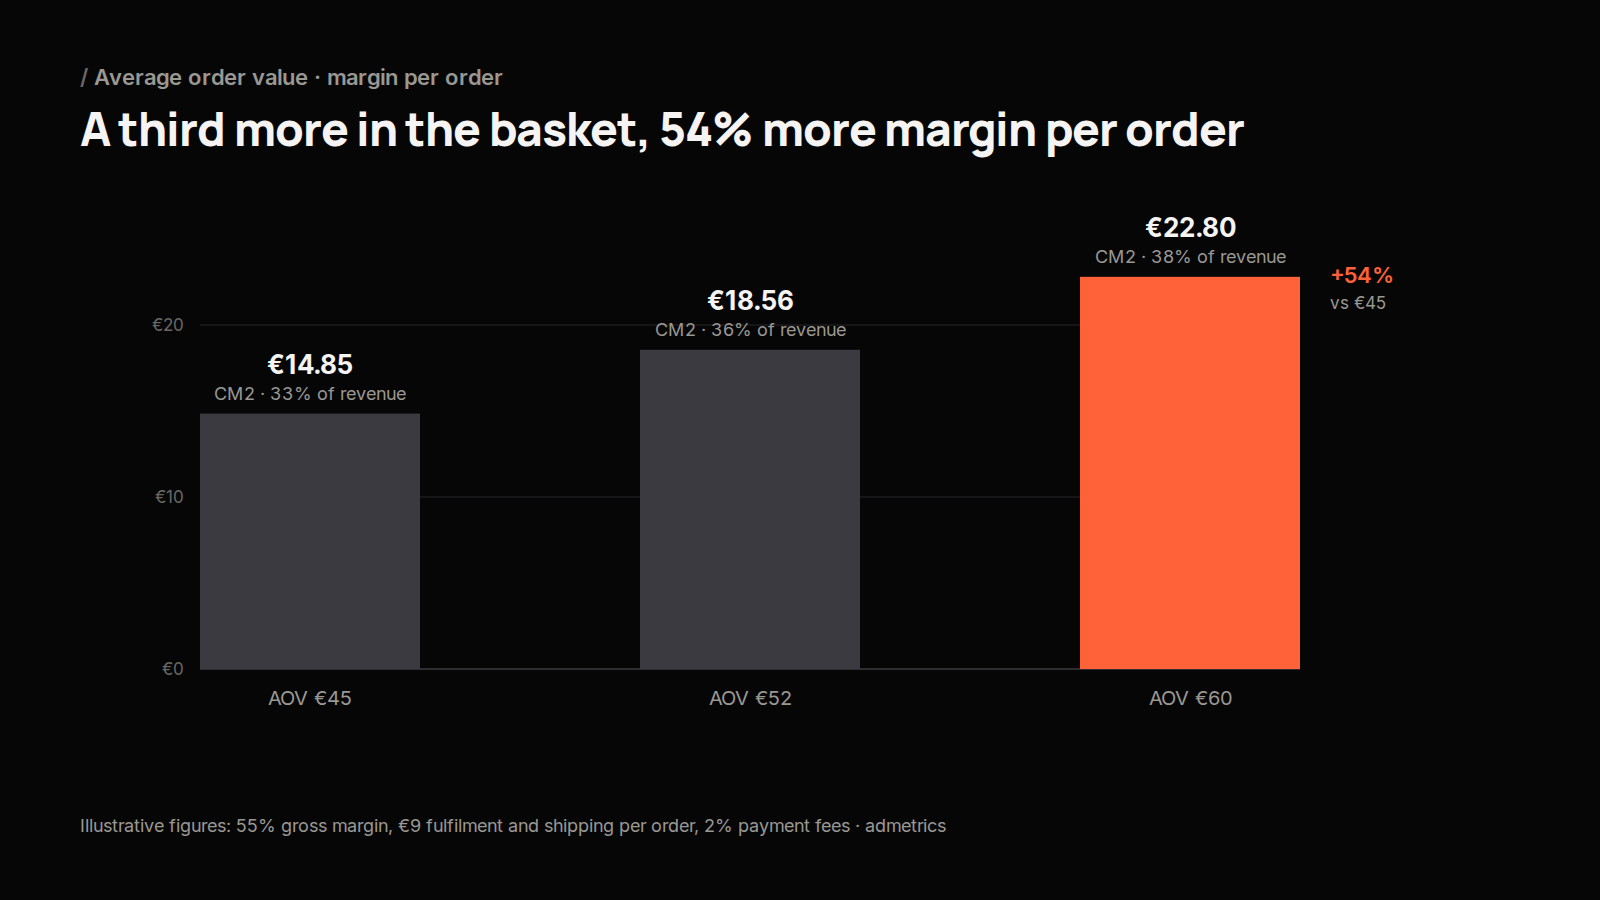
Raising AOV from €45 to €60, a third more, raises CM2 per order by 54% and CM3 per order almost fourfold. Nothing else changed: same products, same prices, same ads.
AOV also raises what you can pay for a customer
CM2 is the most you can pay to acquire an order and break even. At €45 AOV that ceiling is €14.85; at €60 it is €22.80. In Black Week, when the cost of reaching customers often rises, a bigger basket is what keeps campaigns above break-even. It also lets you bid for customers a competitor with smaller baskets cannot afford.
When a higher AOV is not better
A bigger basket only helps if the extra euros carry margin. Three ways AOV rises while profit falls:
- The basket grows through a deep discount, so revenue per order rises but AOP falls.
- The extra item is heavy or bulky, and shipping costs grow with it.
- The add-on drives returns, for example a second size "just in case" in fashion.
The guard is the same in every case: judge AOV changes by average order profit, not by AOV alone.
Nine ways to raise AOV in Black Week
The tactics below come from our BFCM playbook, ordered roughly from the safest for margin to the riskiest.
What the playbook examples show
- Decoy effect. Dollar Shave Club presents a third, less attractive pricing option so one of the others looks like the obvious choice. In Black Week, a product variant can play the same role for your hero product.
- Anchoring. Alpin Loacker, a sustainable outdoor equipment brand, shows its sale bundle next to a similar, more expensive one, so the offer reads as a bargain without a deeper discount.
- Reciprocity. Free samples or a small gift with a purchase make shoppers more willing to add to the basket.
- Scarcity. Paul Valentine signals limited stock on its advent calendar, which creates urgency to buy before it sells out.
Pick two or three tactics, not nine. Each one competes for attention on the product page and in the cart.
How to set a free-shipping threshold, step by step
Our BFCM playbook's rule of thumb: set the threshold slightly above your current AOV. Here is how to turn that into a number you can defend.
- Pull 90 days of orders on net revenue, excluding VAT and cancelled orders.
- Plot the distribution in order-value buckets and note the mean (your AOV) and the median.
- Pick a candidate just above AOV. With an AOV of €52, try €59 or €60. Check how many orders sit within €15 below it: those are the customers the threshold can move.
- Check you can bridge the gap. You need products or add-ons priced roughly at the gap (here €8–15) that fit what people already buy.
- Run the margin check below, including the orders that already qualify.
- Show progress in the cart: "€8 to free shipping" works better than a banner on the homepage.
- Measure AOV, conversion rate and AOP for two to four weeks before Black Week, and adjust.
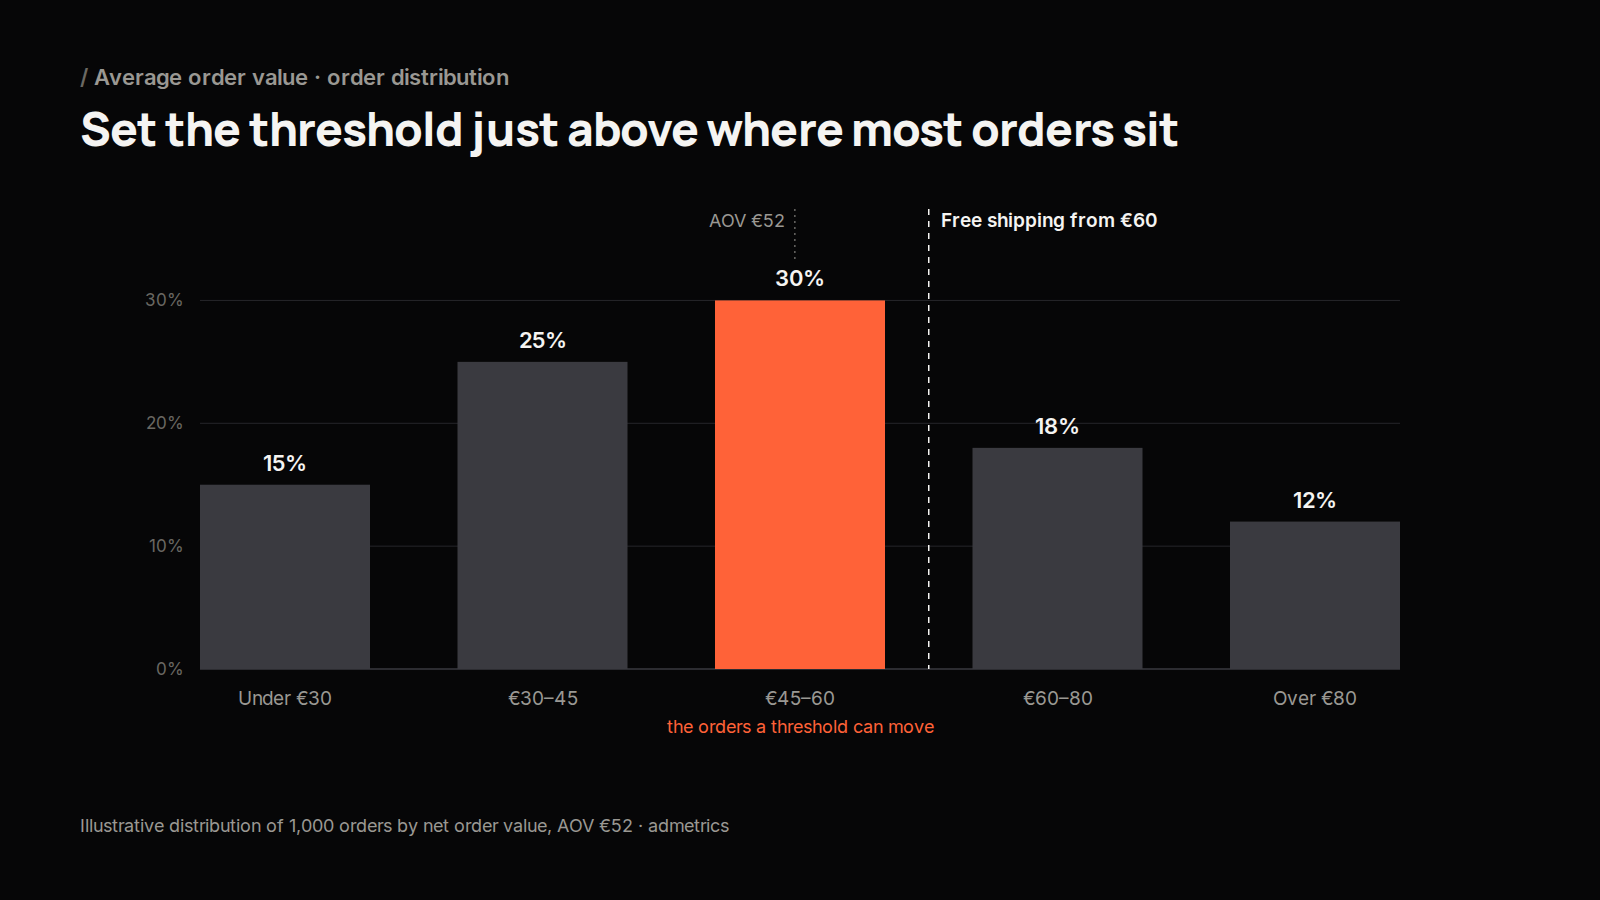
Order-value distribution for 1,000 orders with AOV €52 and a free-shipping threshold at €60; the €45–60 bucket holds 30% of orders
The margin check
An illustrative shop: 1,000 orders a month, AOV €52, standard shipping charged at €4.95, shipping cost €6. A free-shipping threshold at €60 is introduced.
In this example the threshold loses money, because the customers who already spent more than €60 now get free shipping too. It pays only if it lifts conversion rate, or if more orders move up. Two fixes: raise the threshold so fewer existing orders get the subsidy, or make the bridging items higher-margin. Run this check with your own distribution before you announce free shipping for Black Friday.
Free shipping also lowers cart abandonment, the playbook notes, so the conversion effect can tip the balance. Measure it rather than assume it.
Bundles that raise AOV without giving away margin
A bundle discount looks like a price cut, but it often earns more per order than selling one item at full price, because the per-order costs are only paid once.
Worked example: one item vs a bundle of two
Same shop: products at €45 net with a 55% gross margin, €9 fulfilment and shipping per order, 2% payment fees.
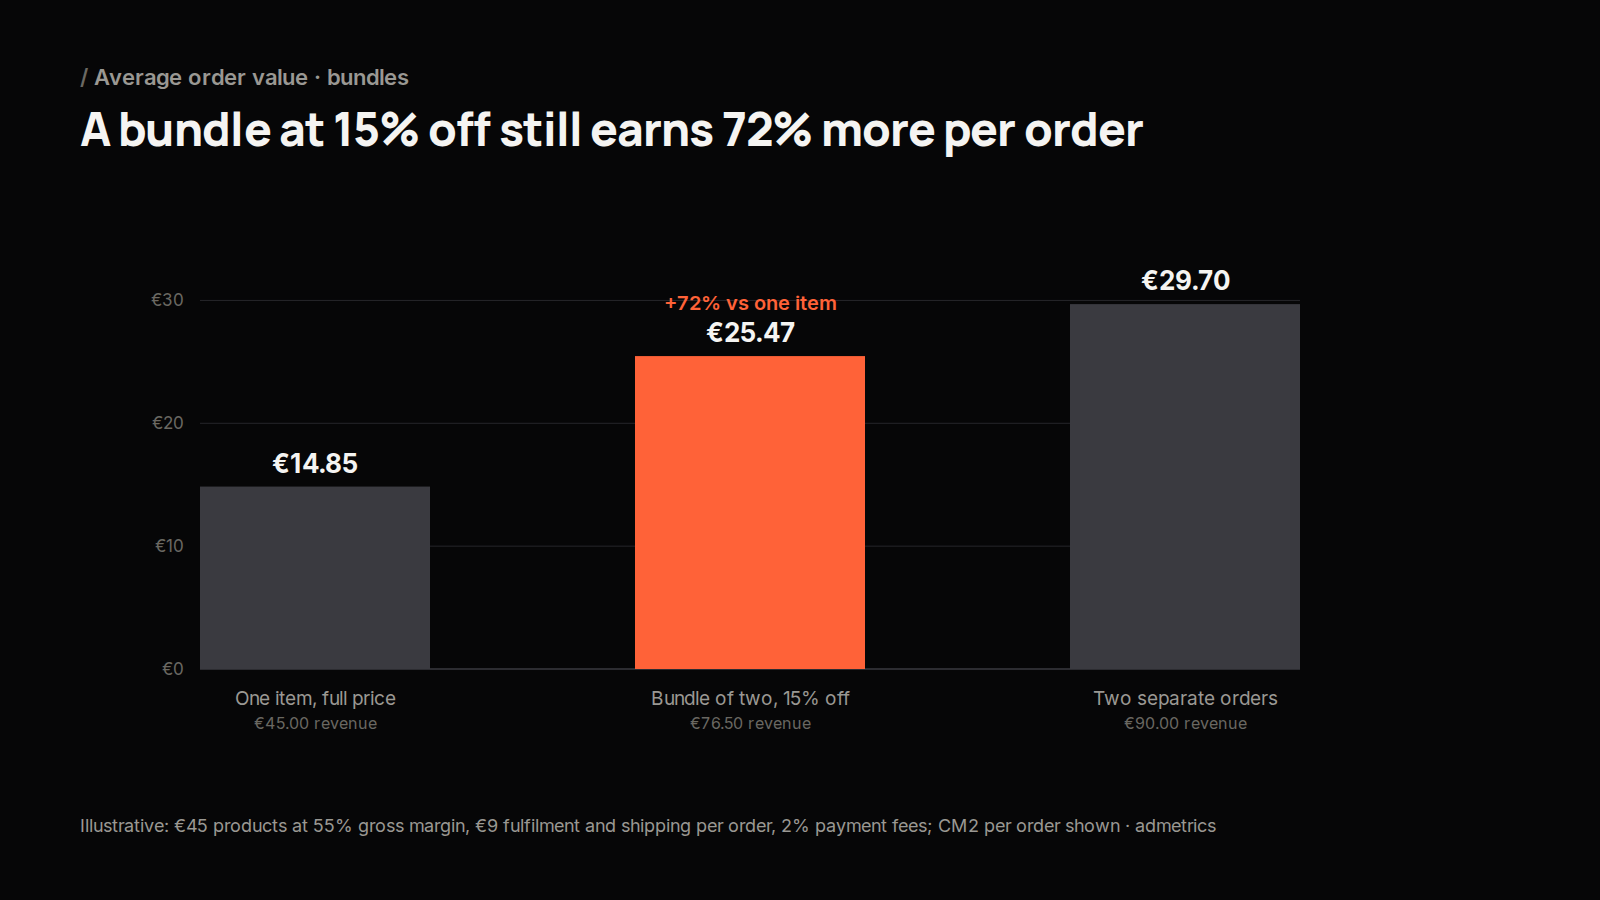
The bundle earns 72% more per order than a single item, despite the discount. It earns less than two separate orders, so it only pays if the customer would not have come back for the second item. That is the question to ask of every bundle.
Five rules for Black Friday bundles
- Pair a best-seller with a slower product. The playbook's advice: bundles help sell slow-moving inventory by pairing it with popular items. Two best-sellers in one bundle mostly discount sales you would have made anyway.
- Bundle what belongs together. A set customers would assemble themselves (a starter kit, a refill pack, a care product) converts better than a random pairing.
- Check CM2, not the discount percentage. A 20% bundle discount on high-margin items can earn more than 10% on low-margin ones.
- Keep the bundle price under a clear round number and close to your free-shipping threshold, so one decision unlocks both.
- Track bundles as their own product, with returns. A bundle that comes back half-used is a bigger loss than a single item.
AOV by channel and customer type
Value traffic by revenue per session, not conversion rate alone
Two campaigns with the same conversion rate are not worth the same if one brings €40 baskets and the other €70. Compare channels on revenue per session (conversion rate × AOV), and on contribution margin per session once costs are in. A campaign that looks expensive per order can be the better buy if its baskets are bigger.
Better conversion data can change who you reach
Ad platforms optimise toward the purchases they are told about. When the browser pixel misses a large share of them, the algorithm learns from a thinner, skewed sample. In a controlled Meta test, Ehrenkind's server-side pixel produced 60.3% higher ROAS, 25.2% lower cost per order and 19.8% higher order value than the shop's own pixel. With a fuller picture of who buys, the platform could find more buyers like them.
"With the Admetrics integration we achieved a remarkable 60% increase in ROAS, reduced our Cost per Order by 25%, and optimized our Meta ad spend with precision and confidence." Philip Richter, Performance Marketing, Ehrenkind
New vs returning customers
First orders and repeat orders often differ in basket size, and in which tactics move them. New customers respond to bundles, starter kits and a reachable threshold. Returning customers respond to cross-sells based on what they bought before and to quantity offers on what they reorder. At ESN and More Nutrition, separating new from existing customers in every budget decision was the largest single lever, and cost per new customer fell 70%. The same split belongs in every AOV report.
High-AOV products take longer to decide
The bigger the basket, the longer the journey. Heimplanet, which sells tents and packs at an average order value of €230, sees journeys of 7 to 14 days and longer, and uses a 120-day attribution window to capture them. For high-AOV brands, the Black Friday order is often the end of a journey that started in October, so the campaigns that started it deserve credit. Our marketing attribution guide covers how to set windows.
AOV before, during and after Black Week
Common mistakes
- Celebrating AOV while AOP falls. A bigger basket bought with a deeper discount is not a win.
- Comparing AOV across periods with different definitions, for example with and without VAT or shipping.
- Setting a threshold without the margin check, and subsidising shipping for customers who already spent enough.
- Letting discount codes stack with bundle prices and thresholds, so one order collects three discounts.
- Judging Black Week AOV by the first weekend. Gift and impulse orders come back in December and January.
AOV calculator
Try it with your own numbers: the free AOV calculator shows your average order value, what each order keeps and what a higher AOV adds.
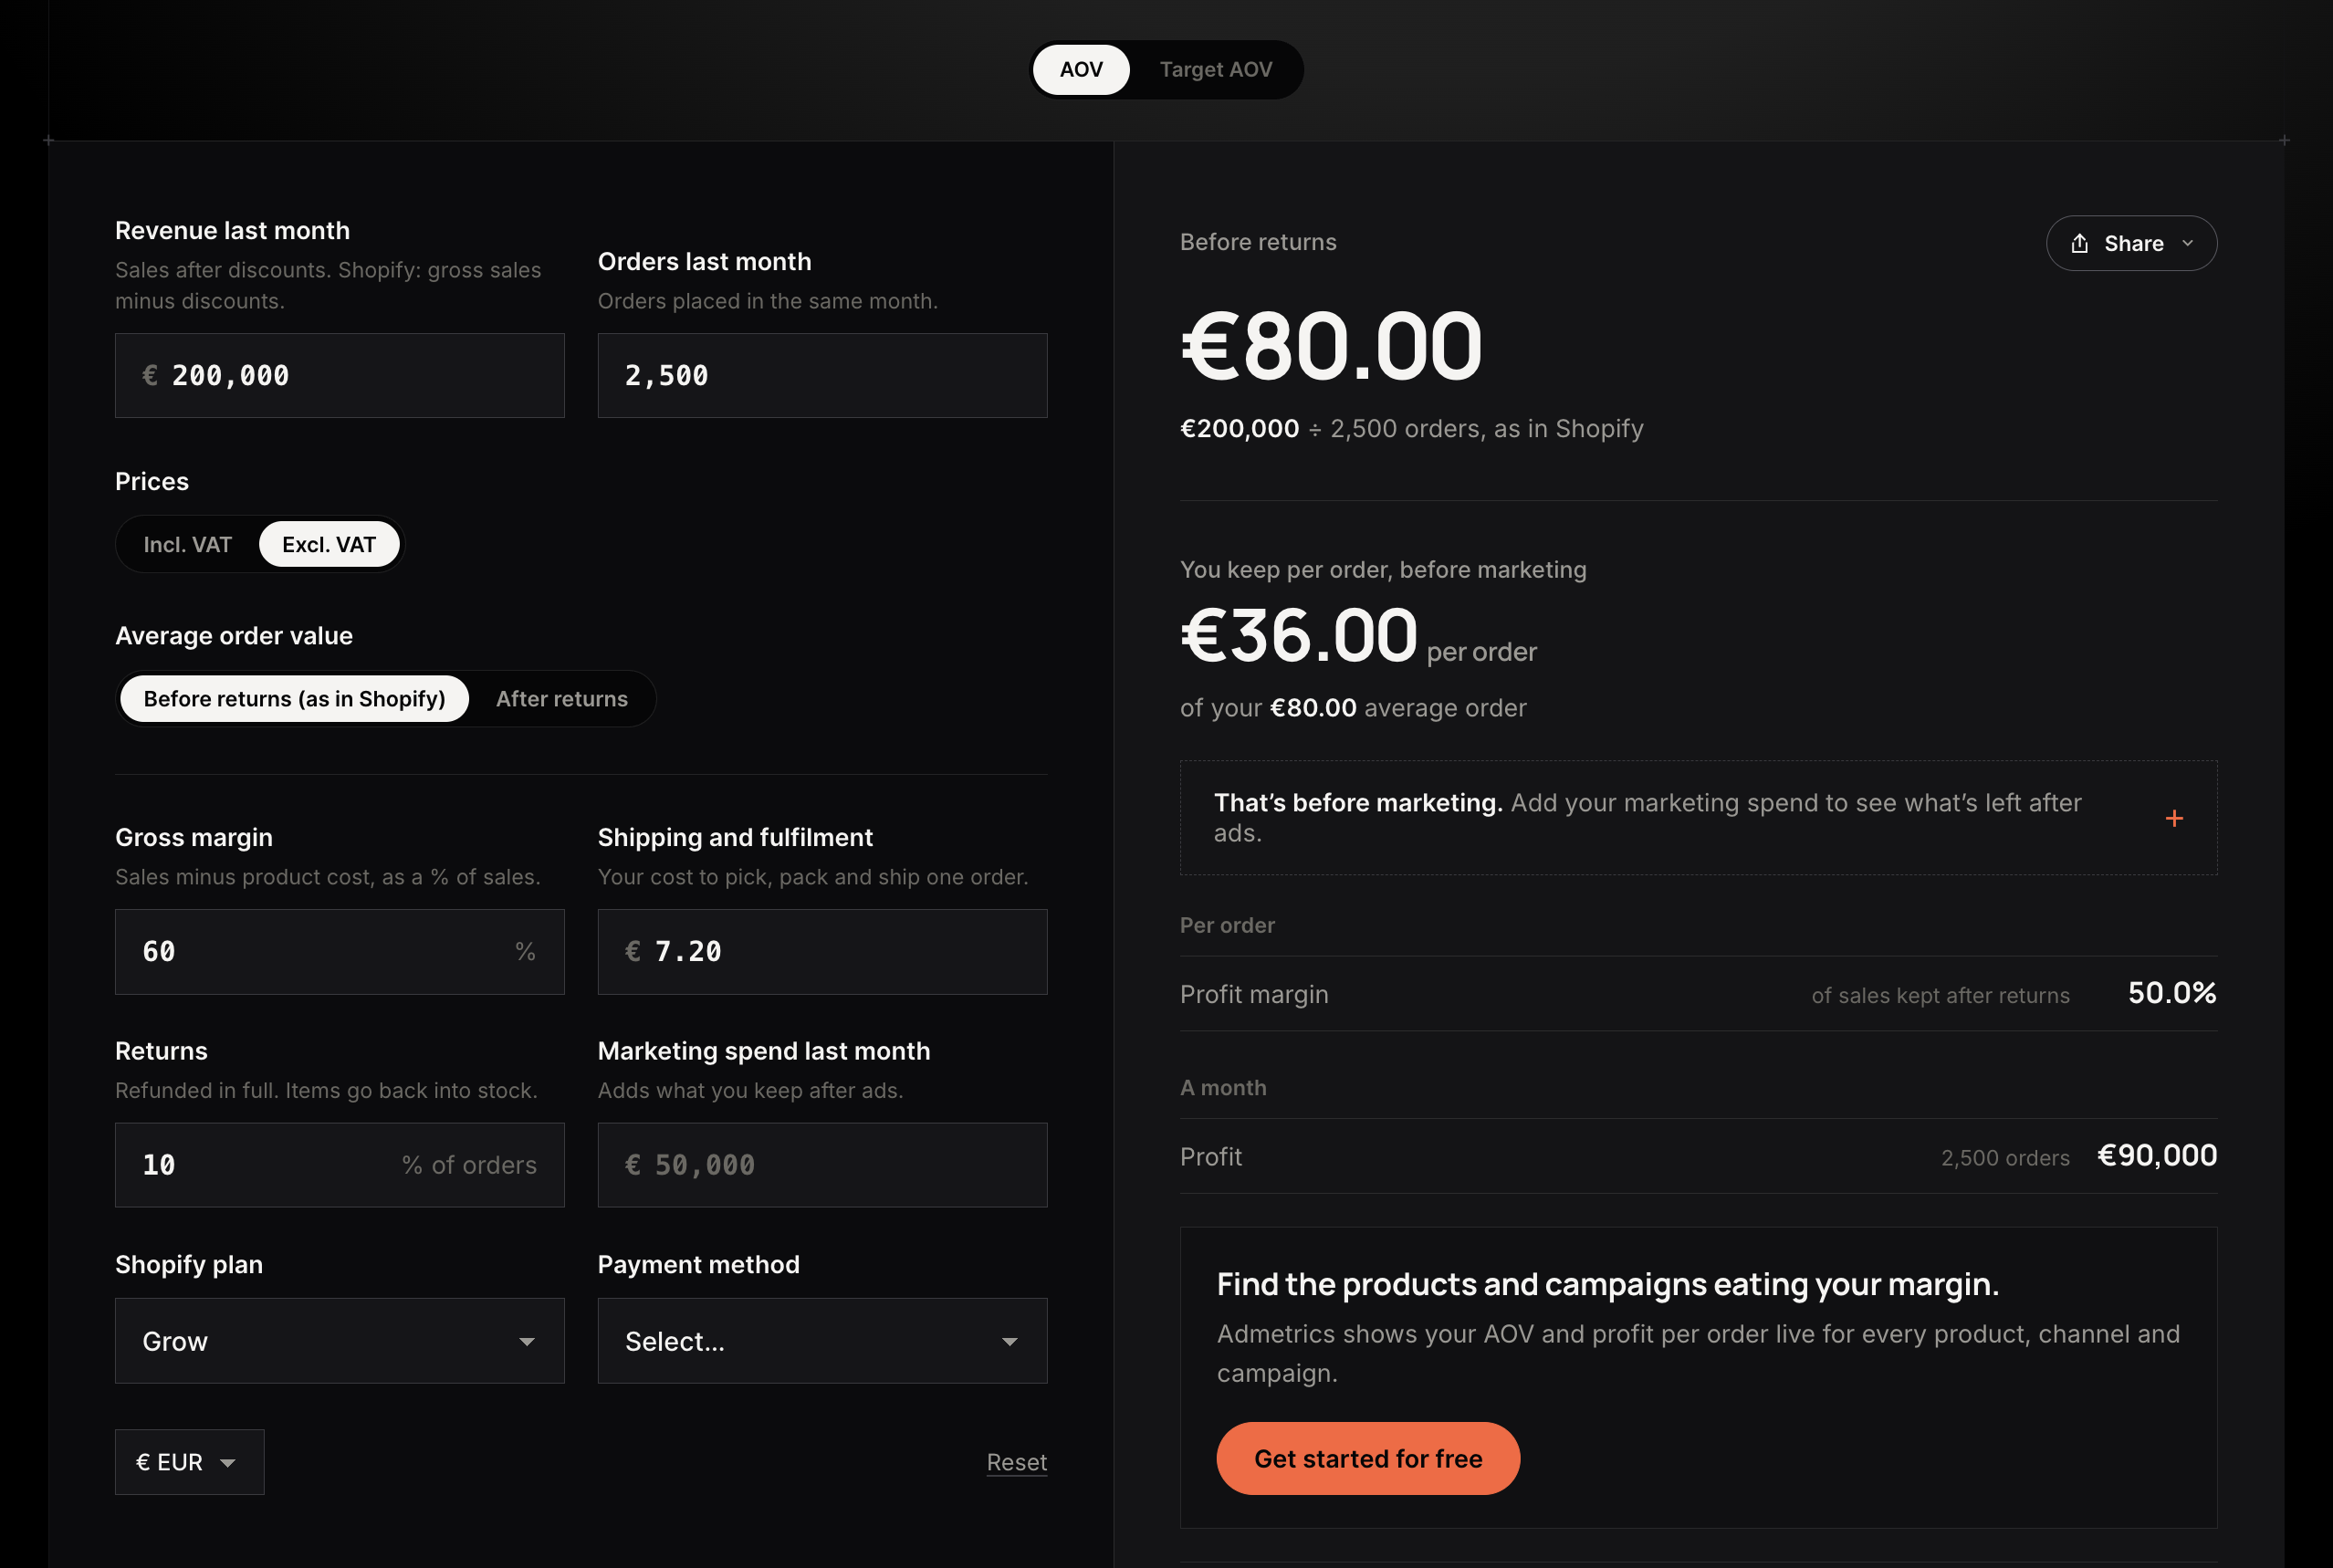
For the margin side of Black Friday offers, use the contribution margin calculator.
FAQ
What is average order value?
The average amount customers spend per order over a period: net revenue divided by the number of orders.
How do you calculate AOV?
Divide net revenue (after discounts, excluding VAT and shipping charges) by the number of orders in the same period. €52,000 from 1,000 orders is an AOV of €52.
What is a good average order value?
It depends on category and price point, so a cross-industry benchmark says little. Compare against your own history, by segment, and check whether contribution margin per order rises with it.
How do I increase average order value without discounting?
Use a free-shipping threshold slightly above your AOV, cross-sells and upsells, bundles of complementary products, a gift with purchase above a threshold, and pricing that anchors the offer against a pricier option.
Where should I set my free-shipping threshold?
Slightly above your current AOV, where enough orders sit just below it and you sell items that bridge the gap. Then check that the margin from moved orders exceeds the shipping you give away on orders that already qualified.
What is the difference between AOV and average order profit?
AOV measures revenue per order. Average order profit measures contribution margin per order. AOV can rise while AOP falls, for example when a deep discount buys a bigger basket.
Does AOV go up or down on Black Friday?
Both happen. Percentage discounts lower the price of each item, while thresholds, bundles and gift buying raise basket size. Check AOV and AOP by campaign and compare with your own previous Black Weeks.
See AOV and order profit live, on your real data
Admetrics shows AOV and average order profit for first and repeat orders, by channel, campaign and order-value bucket, with contribution margin and returns included. In Black Week you see which campaigns bring baskets that earn, while you can still move the budget.
Run your biggest week free: Admetrics is free until 1 December. No credit card, no commitment. Get started for free