Conversion rate is the number every ecommerce team watches and few translate into money. "We're at 2%" says little on its own. What matters is where the other 98% leave, and what moving the rate by half a point would add in profit, after product, shipping and the ads that brought the visitors in.
A better conversion rate is also the cheapest growth there is. Every extra order comes from traffic you've already paid for, so cost per order falls as the rate rises.
This guide covers how to calculate conversion rate, what counts as a good one in your category, how to find the step in the funnel where visitors drop out, what real brands changed to fix it, what a lift and recovered carts are worth in profit, how to work backwards from a revenue goal, and what changes in Black Week.
Admetrics is a marketing measurement and budget platform for ecommerce and DTC brands. We measure what drove each order independently of the ad platforms and work out the profit left after costs and returns.
Key takeaways
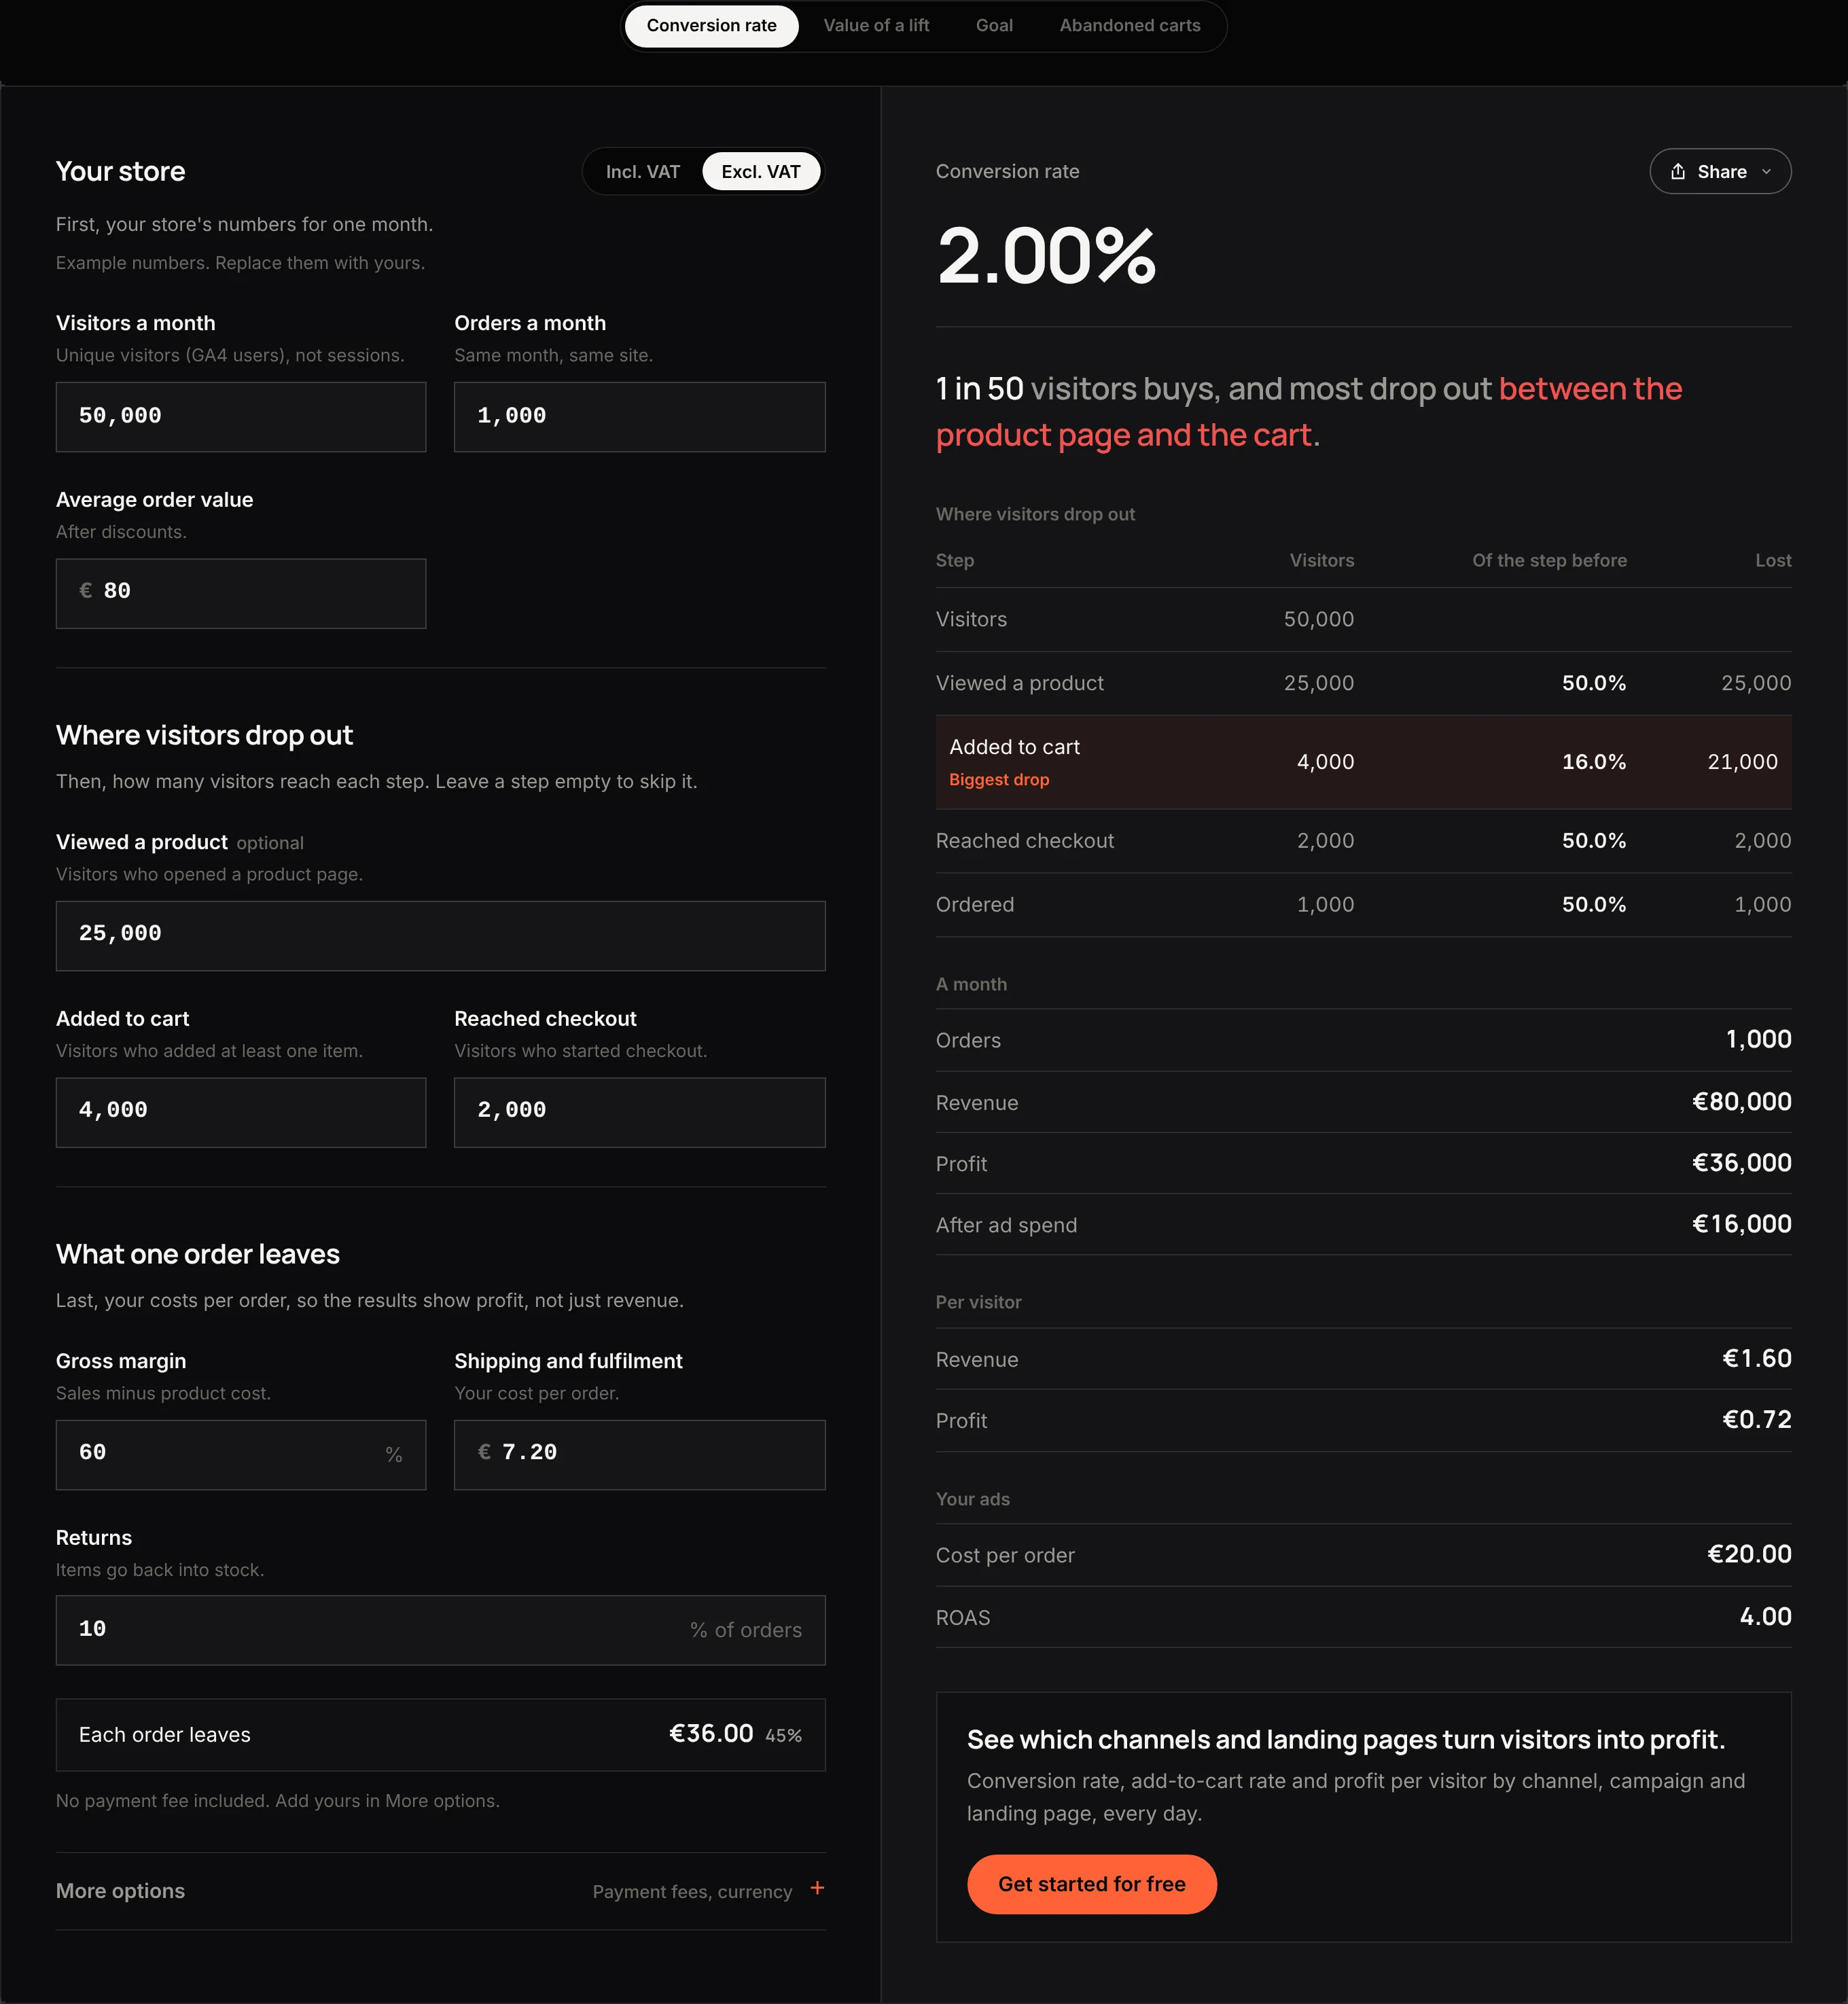
- Conversion rate = orders ÷ visitors. In our example, 1,000 orders from 50,000 visitors is 2.00%.
- "Good" depends on category. Food and beverage brands often convert at 5–6%; fashion and jewellery typically sit under 2%, with more browsing before a purchase.
- Find the biggest drop, not the average. In the example, only 16% of product viewers add to cart: that's the step to fix first.
- Put a profit number on a lift. Going from 2.00% to 2.50% adds 250 orders and €9,000 profit a month, and cuts cost per order from €20 to €16.
- Think per visitor. Each visitor brings €1.60 of revenue and €0.72 of profit before ads; that's the most a visit can cost.
- Count the carts. The global average cart abandonment rate is about 70% (Baymard Institute); in our example, winning back 1 in 10 abandoned carts adds €10,800 profit a month.
- In Black Week, a higher rate on discounted orders is worth less. Judge it on profit per visitor, not on the rate alone.
What is conversion rate?
Conversion rate = orders ÷ visitors (or sessions) × 100
Whether you divide by visitors or by sessions changes the number: a visitor who comes back three times before buying is one visitor but three sessions. Either works, as long as you use the same one every time and compare like with like.
What counts as a good conversion rate?
A single global average hides more than it shows, because categories convert very differently. Low-price, repeat-purchase products convert far more often than considered, high-price ones:
Figures vary by source, region and how "conversion" is counted, so treat them as a rough compass rather than a target (based on 2026 aggregated ecommerce benchmarks). The number that matters more than any benchmark is your own trend, and the funnel step costing you the most.
Find the step where visitors drop out
An overall rate hides where the problem is. Split it into the steps of the funnel and the weak one shows up.
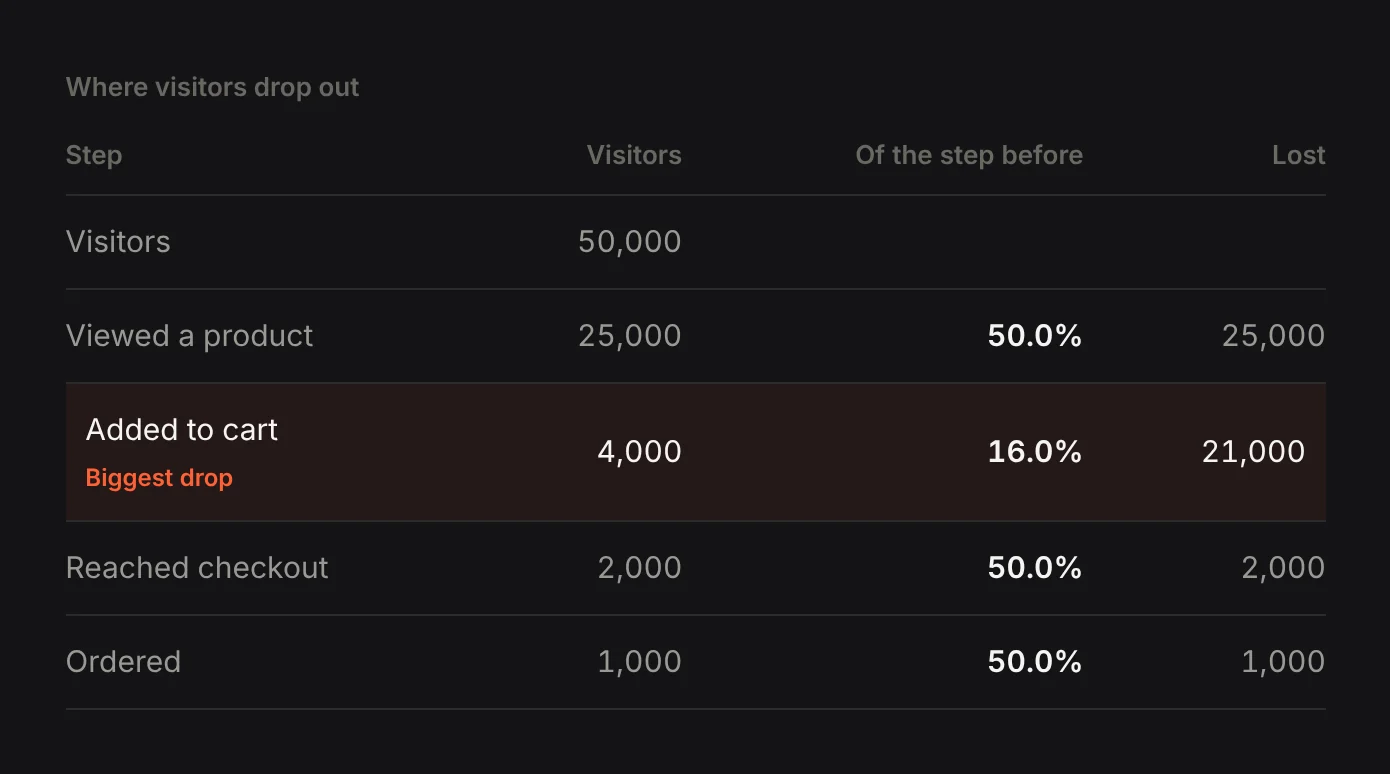
Here, the product page is the problem: 84% of people who look at a product leave without adding it to the cart. Typical fixes at that step are clearer prices and delivery times, better product images, reviews close to the button, and visible stock. A drop between cart and checkout points to surprise costs, such as shipping; a drop inside checkout points to forms, payment options or trust. Our conversion rate optimization guide lists fixes for each step.
What well-known brands do at each step
The fixes above are abstract until you see them applied. A few well-known approaches, by the step they target:
What a better conversion rate is worth
In the example store, each order leaves €36 after product, shipping and fees, and ad spend is €20,000 a month. A higher rate turns the same paid traffic into more orders:

Half a percentage point is worth €108,000 a year in this example, without a euro of extra ad spend. That's the number to weigh against the cost of a redesign, a new checkout or a CRO agency.
Profit per visitor
Another way to see the same thing: what each visitor is worth.
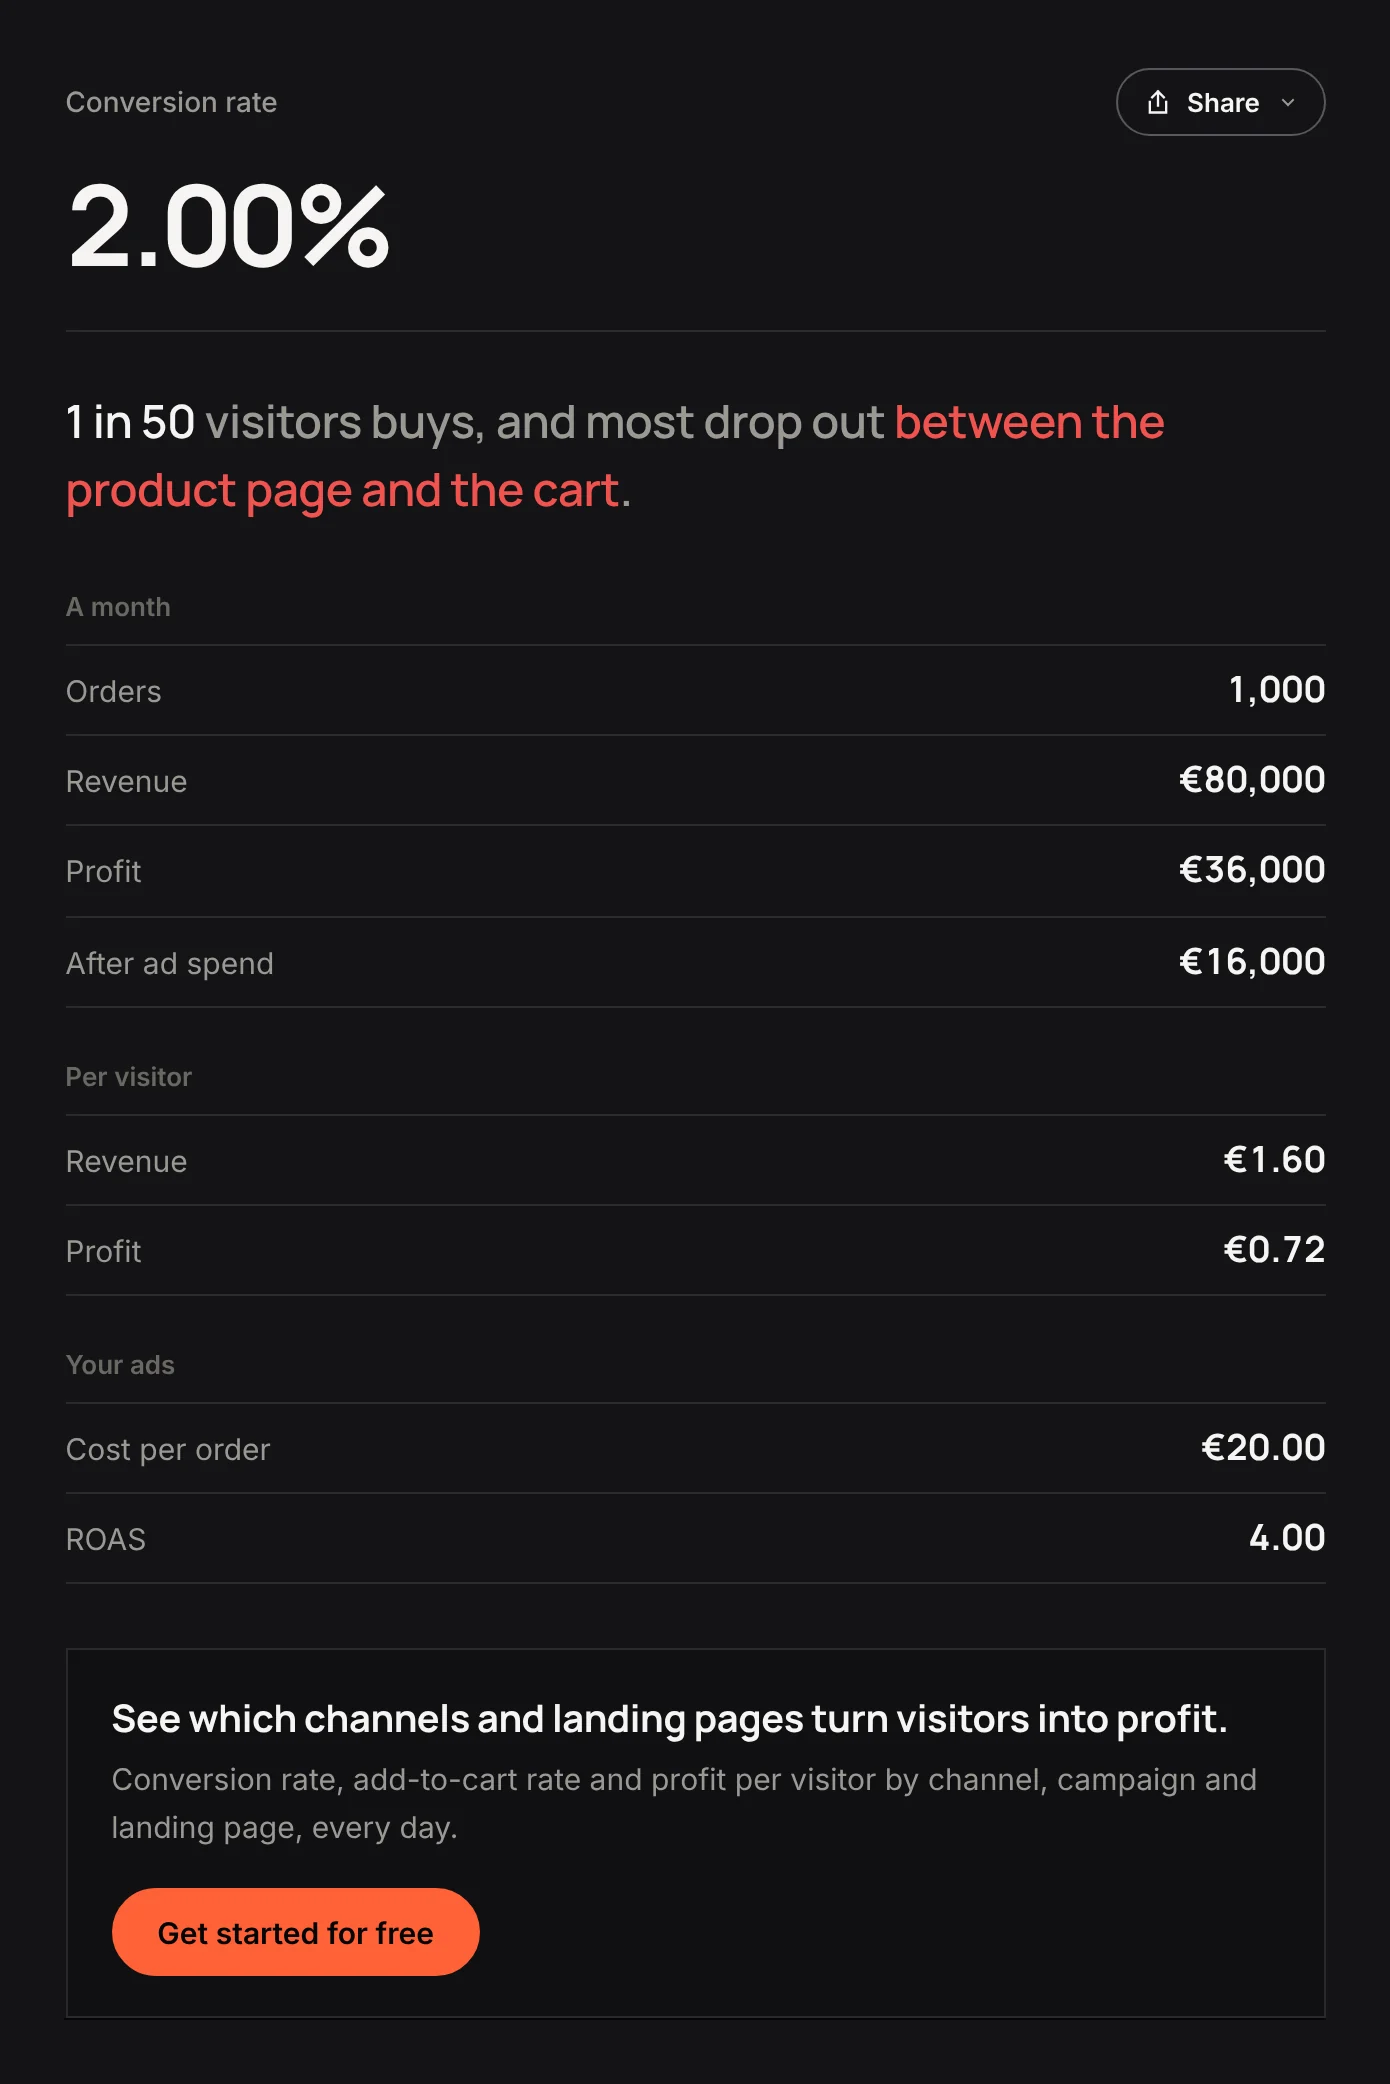
At €0.72 of profit per visitor before ads, a visit that costs more than €0.72 loses money. In the example, ads cost €0.40 per visitor (€20,000 ÷ 50,000), leaving €0.32. Raise the conversion rate and the same visit is worth more, so you can afford more traffic.
Abandoned carts
Carts are where the most valuable visitors leave: they've already chosen a product. Across ecommerce, the average cart abandonment rate is around 70%, give or take by device and category (Baymard Institute).
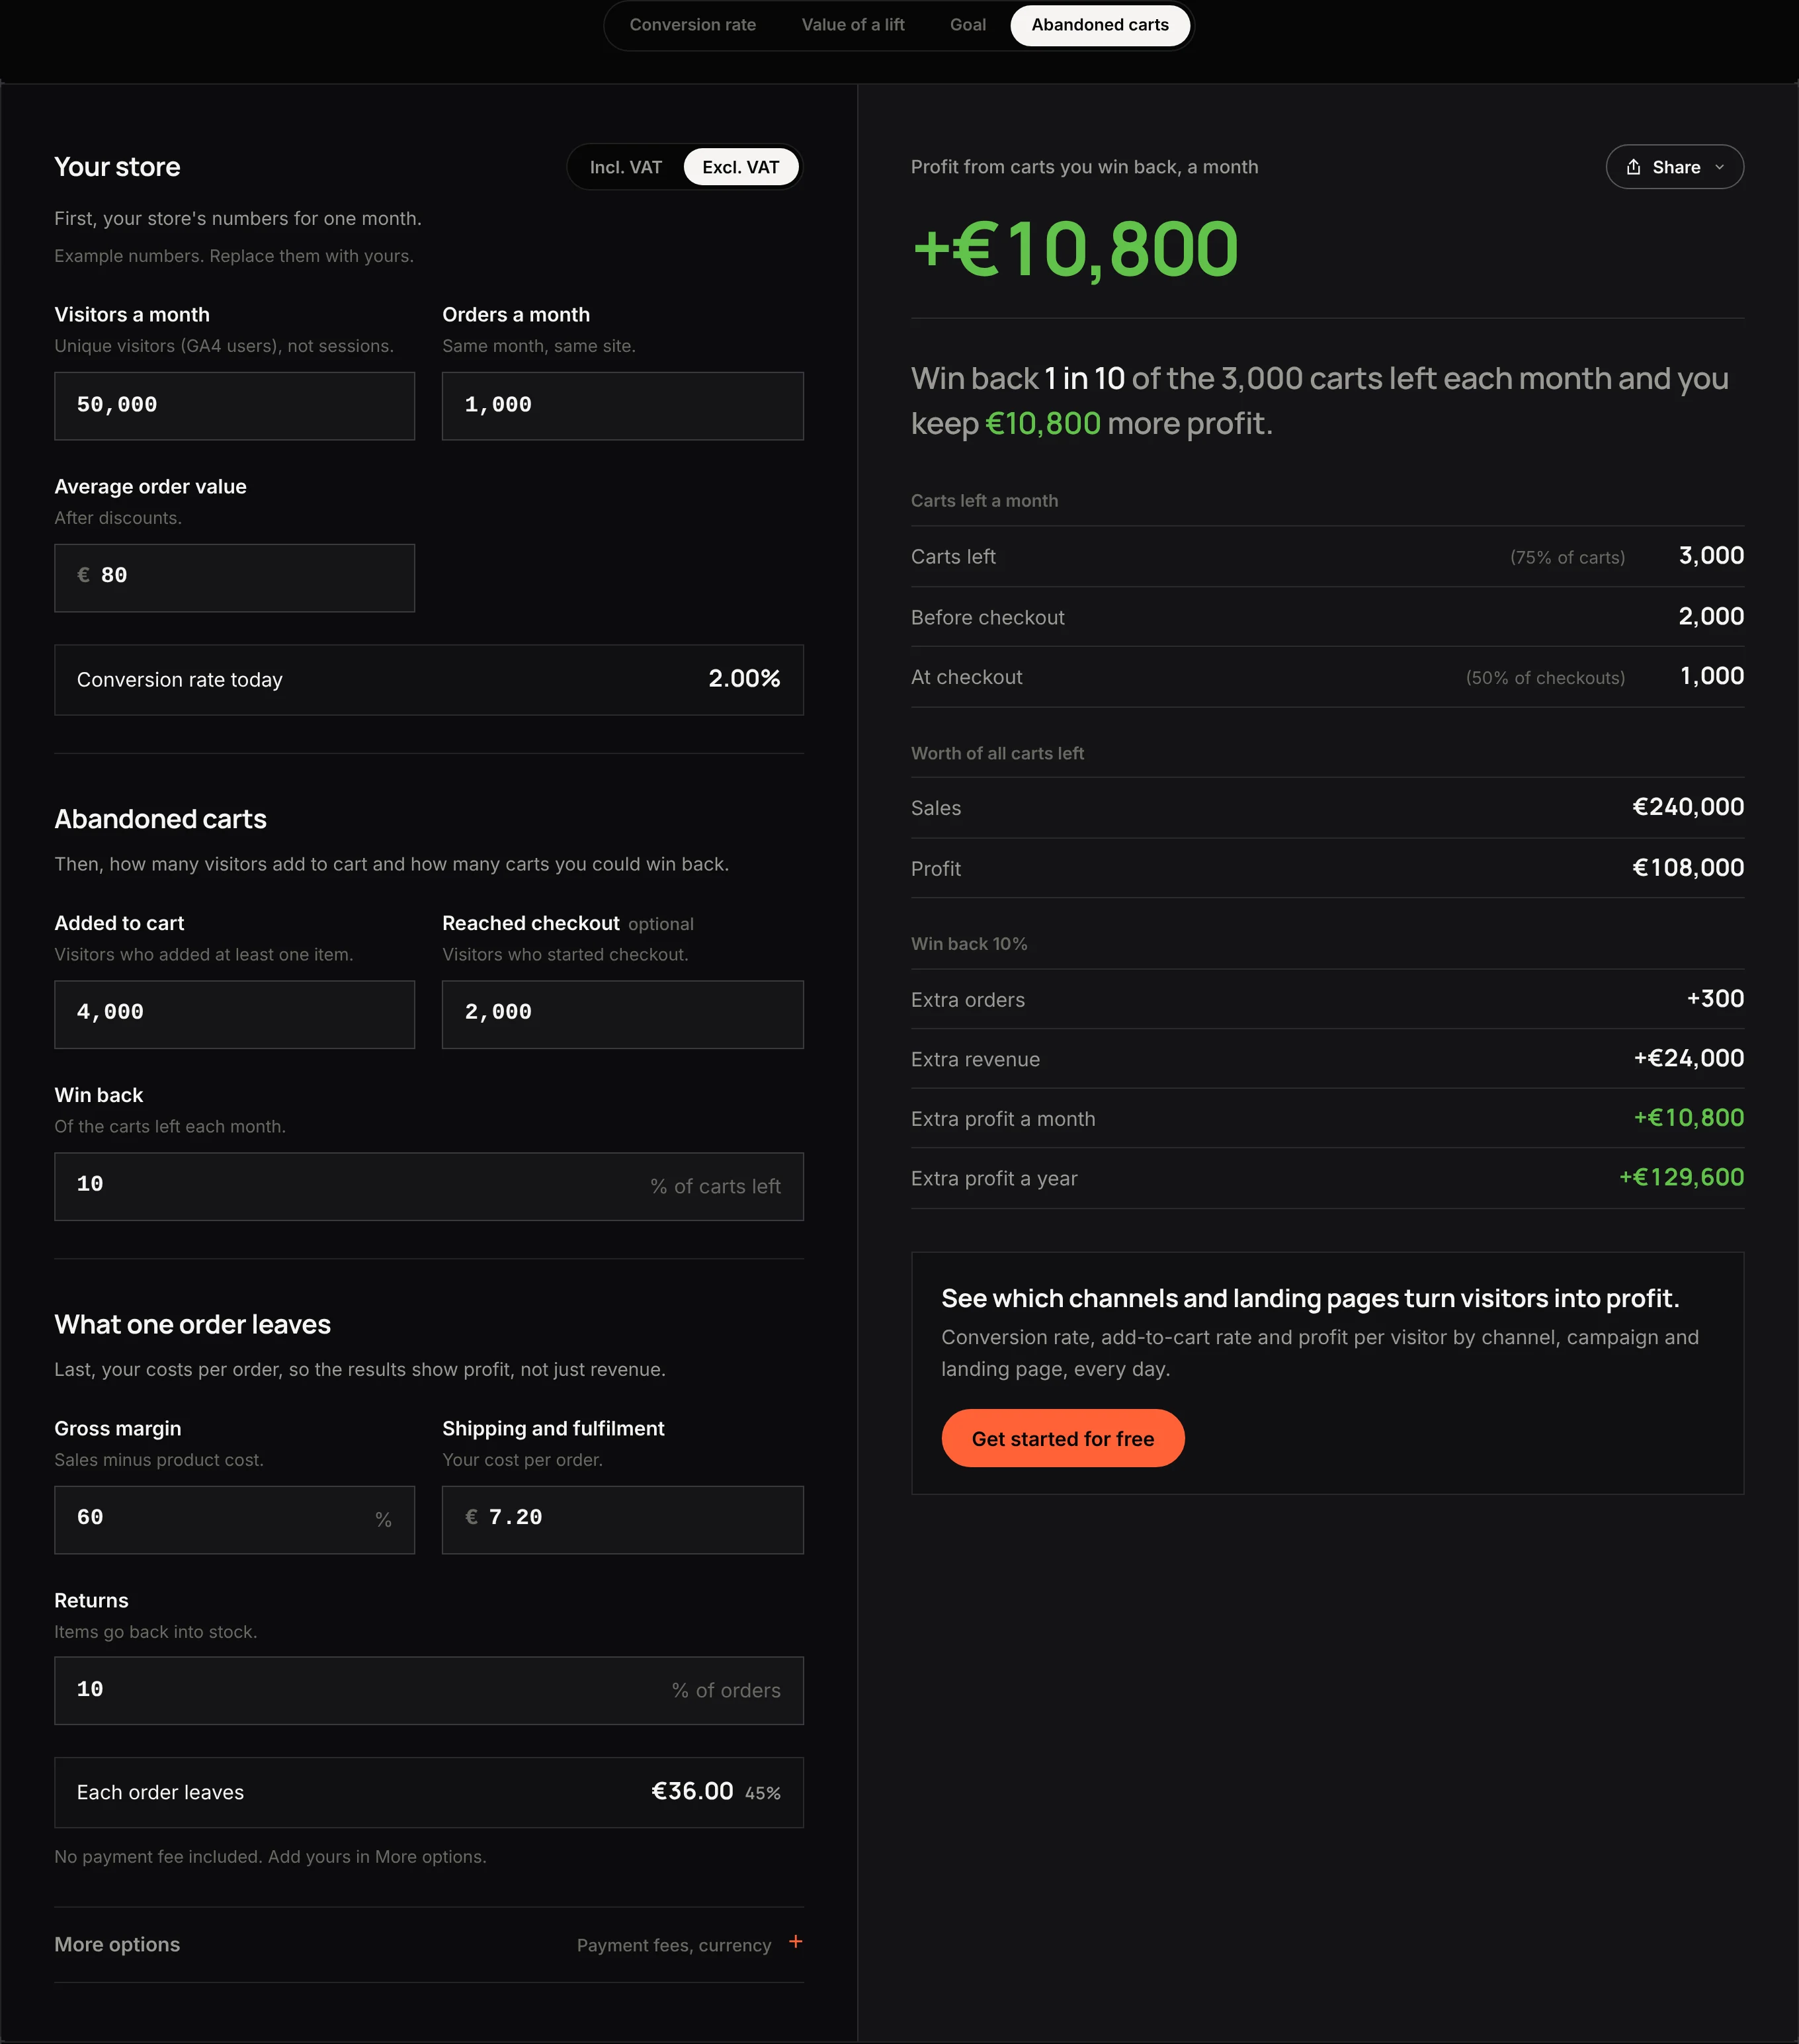
In the example, 3,000 of 4,000 carts are abandoned: 2,000 before checkout and 1,000 at checkout, in line with that wider pattern. Winning back one in ten, with cart reminders, clearer shipping costs or a faster checkout, adds 300 orders and €10,800 of profit a month. Carts left at checkout usually point to a cost or a payment problem; carts left before it, to doubts about the product or the delivery. Baymard's research on checkout usability consistently finds unexpected costs (shipping, fees, taxes shown only at the last step) as the single most common reason given for abandoning at checkout.
Work backwards from a revenue goal
The calculator also runs the other way: from a revenue goal to the conversion rate or traffic it needs.

A €100,000 month at an €80 order value needs 1,250 orders. That's either a 2.50% conversion rate on today's 50,000 visitors, or 62,500 visitors at today's 2.00%. The second route costs about €5,000 more in ads at today's cost per visitor; the first costs nothing per month once the fix is in.
Case study: when the conversion rate was never the real problem
Not every conversion gap is a UX problem. Sometimes the site is converting fine, and what's broken is the measurement of it.
Olivenzauber, a German olive oil and Mediterranean food brand, expanded from Google into Meta and native ads to reach new customers. Platform-reported numbers had to be stitched together by hand, and standard analytics captured at most half of the relevant signals: a visitor converted, but the system recorded it as if they hadn't. The brand's strongest native campaign became unmanageable overnight when the ad channel changed how it shared data, making every funnel number downstream of it unreliable.
Admetrics ran a four-week, head-to-head comparison to validate attribution accuracy, then set up server-to-server tracking to restore the signal the pixel alone was losing. With trustworthy data back in place, Olivenzauber folded Admetrics into daily MER controls and a single shop-plus-channel view for every budget decision.
Over the following 90 days, revenue doubled and new-customer ROAS rose 30%, while cost per new customer fell about 30%. None of that came from changing the product page or the checkout. It came from counting the conversions that were always happening, so the budget could follow what actually worked.
"Admetrics helped us overcome advertising challenges and set a new benchmark for native ads. The S2S integration solved attribution complexity, allowing us to double revenue in 90 days."
— Sven Güntner, CEO, Olivenzauber
The lesson for conversion rate specifically: before investing in a redesign, check how many conversions your current tracking actually sees. Across Admetrics customers, we track on average about 30% more purchases than the ad platforms report, which means a channel that looks like it converts poorly may simply be measured poorly.
Conversion rate in Black Week
Conversion rates usually rise in Black Week: shoppers arrive ready to buy, and discounts tip the undecided. impact.com found that Cyber Monday 2025 had the highest conversion rates of Cyber Week, while Black Friday brought the most revenue (impact.com). Three things to plan for:
- Judge the rate on profit, not on its own. A higher rate on discounted orders can still earn less. At 20% off, the example order leaves €20 instead of €36, so 1,250 discounted orders leave less than 1,000 full-price ones. Check with the discount profit calculator.
- Fix the funnel before the traffic arrives. 57.5% of US online sales on Cyber Monday 2025 came from phones (Adobe), and Shopify merchants' sales peaked at $5.1 million per minute at 12:01 pm EST on Black Friday (Shopify). Test the mobile checkout and the site under load in early November.
- Watch the rate by hour, not by day. A sudden drop on Black Friday is more often a broken checkout or a sold-out product than a change in demand.
Our Black Friday preparation guide covers the full plan.
Conversion rate in Admetrics
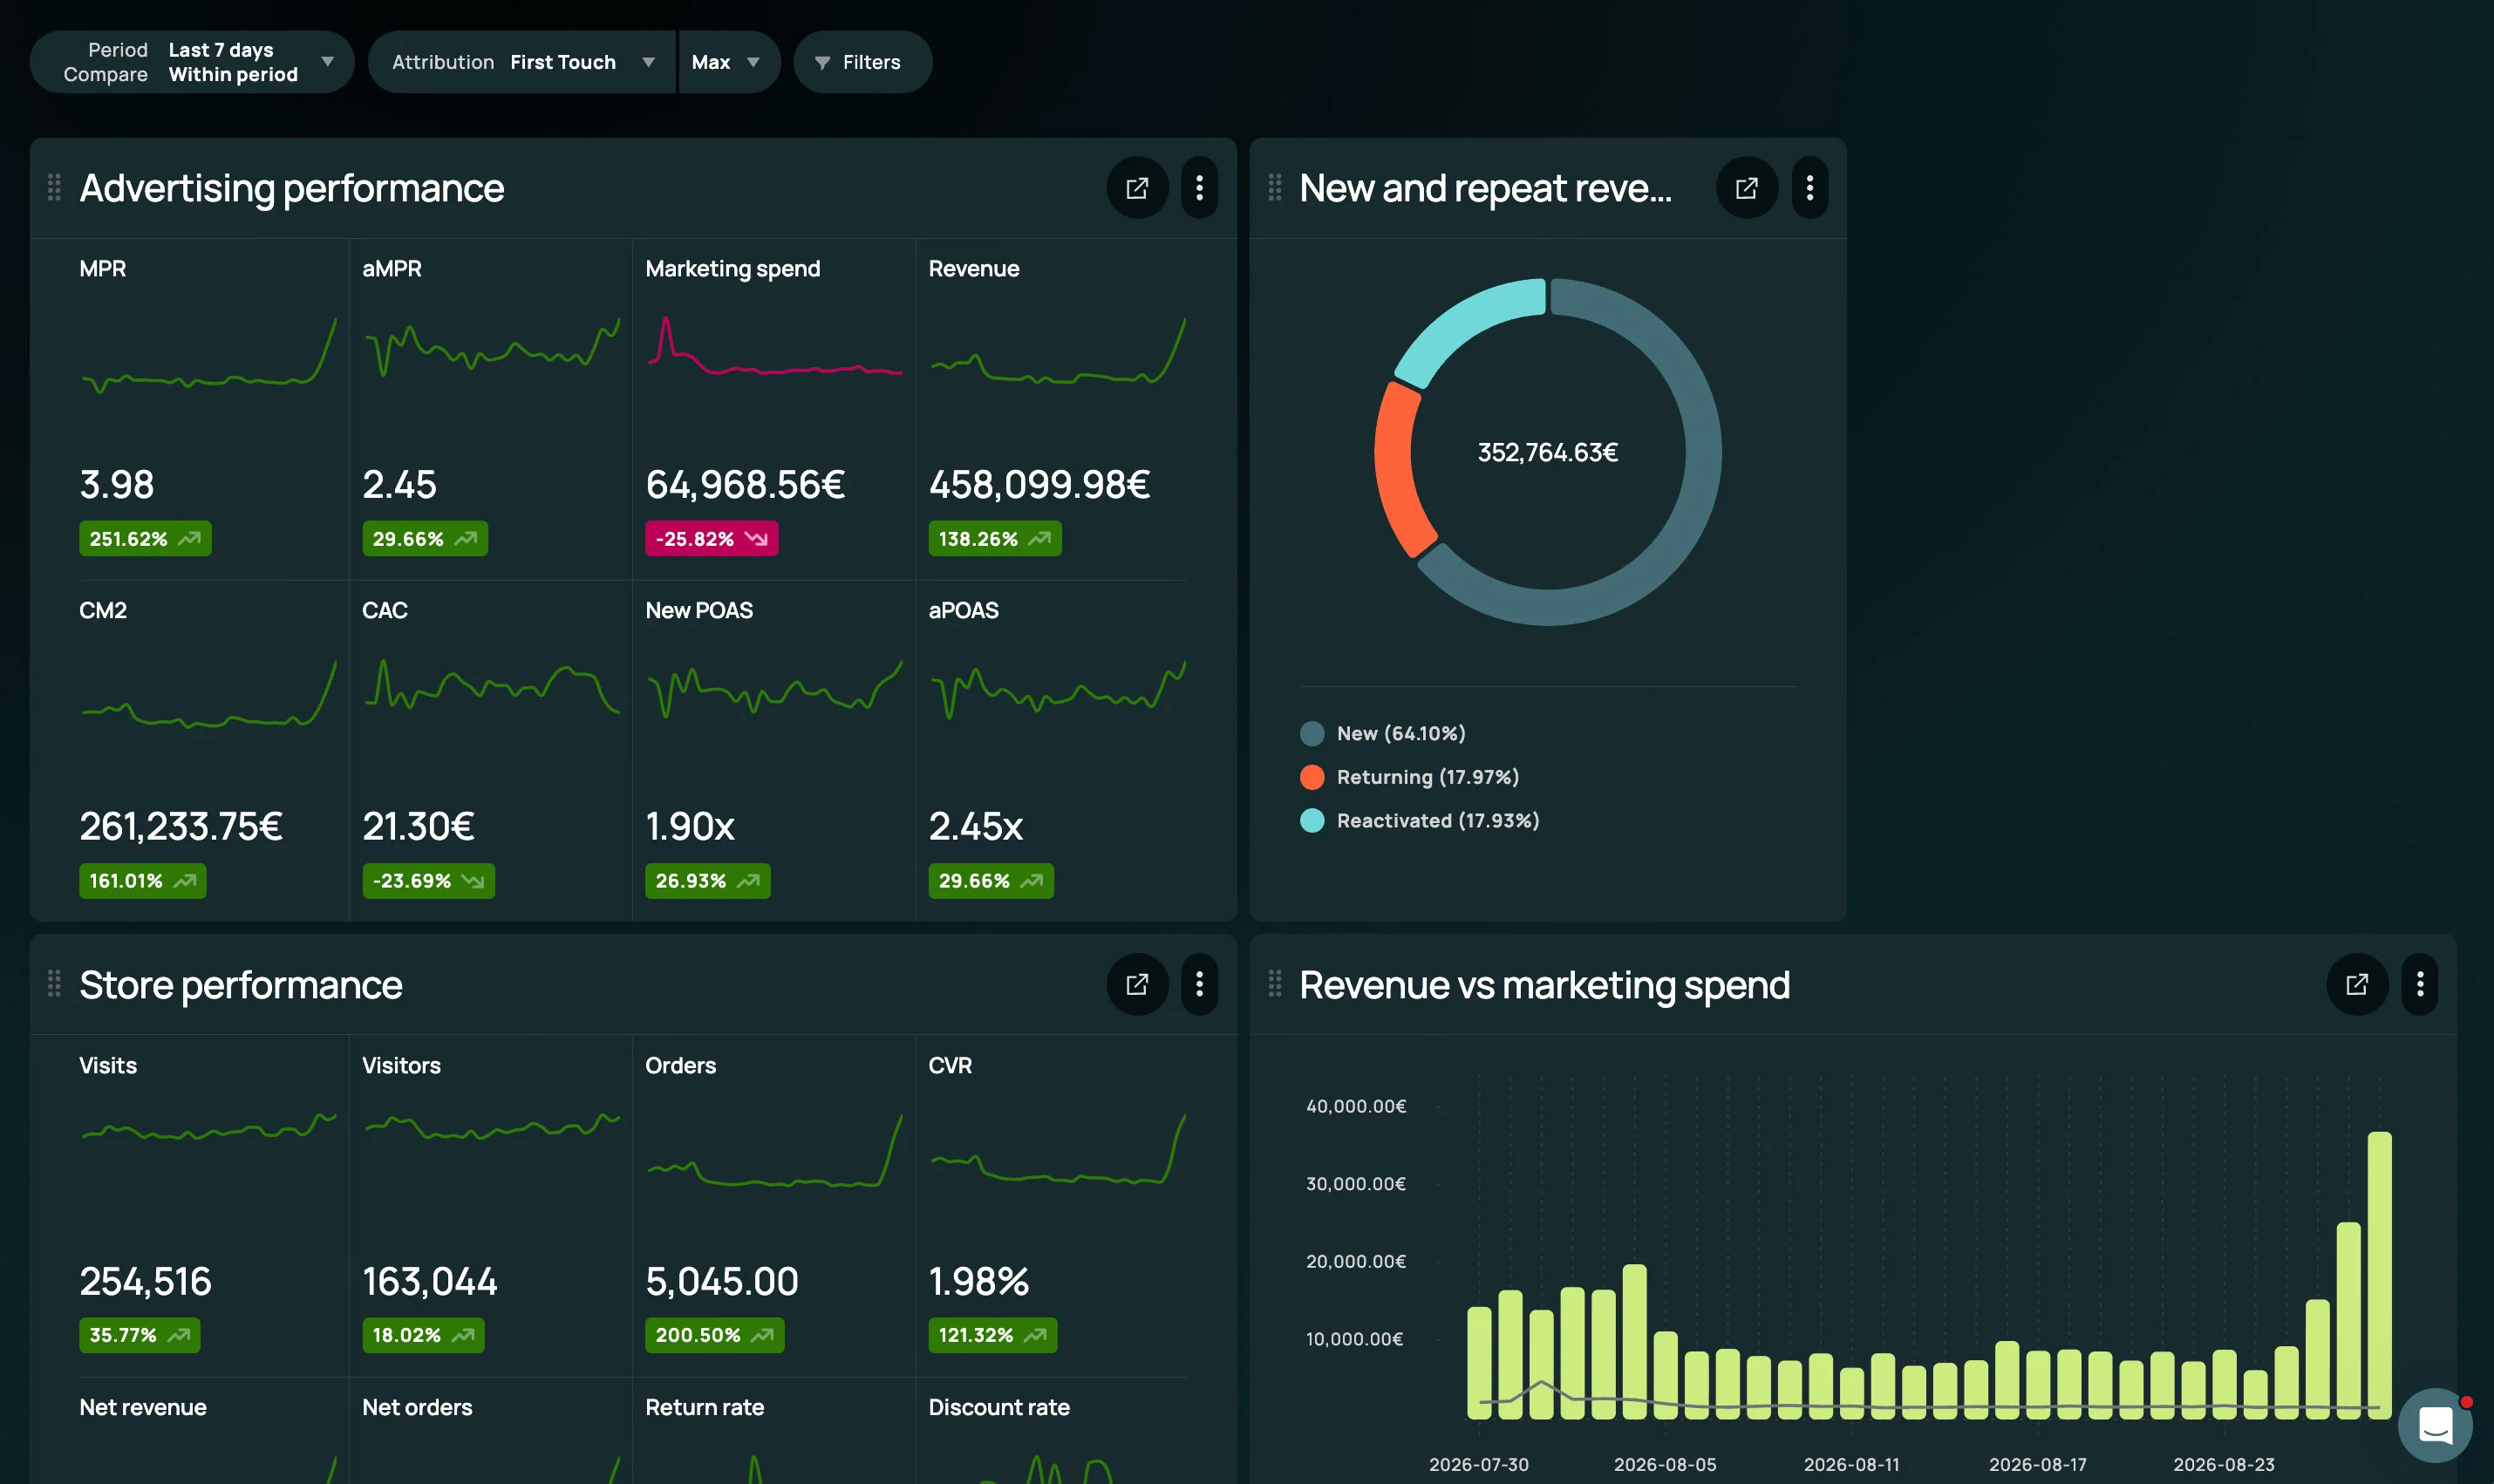
In Admetrics, store performance (visits, visitors, orders and conversion rate) sits next to advertising performance, with contribution margin, CAC and POAS per channel, so you see whether a change in conversion rate came from the shop or from the traffic.
Common mistakes
- Mixing visitors and sessions. Pick one and keep it.
- Comparing against the wrong category benchmark. A 2% rate is weak for food and beverage, strong for fashion.
- Fixing the average instead of the biggest drop. Split the funnel first.
- Comparing rates across very different traffic. Retargeting and email convert far better than prospecting; a falling rate can simply mean more new visitors.
- Blaming the funnel for a tracking problem. Check how many conversions your attribution actually sees before redesigning anything, as Olivenzauber's case shows.
- Celebrating a higher rate on discounted orders. Check profit per visitor.
- Ignoring mobile. Most Black Week traffic is on phones.
Conversion rate calculator
Try it with your own numbers: the free conversion rate calculator shows your conversion rate, the step where visitors drop out, and what a better rate or won-back carts are worth in profit. To see what each order leaves, use the contribution margin calculator; to raise the value of each order, the AOV calculator.
FAQ
How do you calculate conversion rate?
Divide orders by visitors (or sessions) and multiply by 100. 1,000 orders from 50,000 visitors is a 2.00% conversion rate.
What is a good ecommerce conversion rate?
It depends heavily on category: food and beverage brands often convert around 5–6%, while fashion and jewellery typically sit under 2% because of more browsing and sizing doubt. A benchmark says less than your own trend; more useful is finding the funnel step with the biggest drop and working out what fixing it is worth in profit.
What is a 0.5 percentage point higher conversion rate worth?
In our example, going from 2.00% to 2.50% adds 250 orders and €9,000 of profit a month from the same traffic, and cuts cost per order from €20 to €16.
How do I reduce abandoned carts?
Show shipping costs and delivery times before checkout, keep the checkout short with the payment methods your customers use, and send cart reminders. The average cart abandonment rate is around 70% (Baymard Institute), and unexpected costs shown late in checkout are consistently the top reason given. Winning back one in ten abandoned carts adds €10,800 of profit a month in our example.
Why does my conversion rate rise in Black Week but profit doesn't?
Because each discounted order leaves less. Compare profit per visitor, not conversion rate, across the week.
Could a low conversion rate actually be a tracking problem?
Yes. If the platforms or analytics miss conversions, a channel can look like it converts poorly when it's really being under-measured. Olivenzauber's native ad channel looked broken until server-to-server tracking restored the missing signal; revenue then doubled in 90 days without a site redesign.
See conversion rate next to profit
Admetrics shows conversion rate and store performance next to contribution margin, CAC and POAS by channel, with returns included, so you can tell a shop problem from a traffic problem while you can still fix it.
Run your biggest week free: Admetrics is free until 1 December. No credit card, no commitment. Get started for free