Conversion rate is the number everyone in the store has an opinion about, and the one that's easiest to quote wrong. Shopify shows one figure, GA4 another, and the agency deck a third, and a lift of "half a point" gets sold as if it were money in the bank.
The rate itself is simple division. What makes it useful is everything around it: which visitors you count, where they leave, and what a better rate is worth once each order has paid for its products, shipping and returns.
This conversion rate calculator does all three. It works out your rate and the step where most visitors drop out, then puts a profit figure on a better rate, on a monthly goal and on the carts people leave behind.
The guide below shows where each number comes from in Shopify and GA4, and how to read the result before it goes into a plan.
The calculator is free and needs no email.
How to use the conversion rate calculator
The calculator has four tabs, and all of them share the same store numbers:
- Your store: visitors and orders for one month, and the average order value after discounts. The Incl. VAT / Excl. VAT switch tells the calculator which order value you typed.
- Where visitors drop out (Conversion rate tab): how many visitors viewed a product, added to cart and reached checkout. Leave a step empty to skip it.
- What one order leaves: gross margin, shipping and fulfillment per order, and the share of orders returned. Payment fees sit under More options, with the currency and Reset.
Conversion rate gives the rate and the funnel. Value of a lift takes the rate you want to reach and, optionally, your monthly ad spend. Goal works backwards from an orders, revenue or profit target. Abandoned carts shows what the carts people leave are worth and what winning some back adds. Share copies any result as text for Slack or email, or as an image.
How to calculate conversion rate
Steps 1 and 2 give you a rate you can trust. Steps 3 to 8 turn it into decisions: where to work on the site, what a lift is worth, and whether it beats buying more traffic.
1. Pick one way of counting visitors and keep it
Every conversion rate divides orders by something, and the something decides the answer. Shopify divides by sessions. GA4 can count users or sessions. Ad platforms divide by clicks. A shopper who visits three times before buying is three sessions and one user, so a session rate comes out lower than a user rate for the same orders whenever people visit more than once.
For planning, we'd count unique visitors, which GA4 reports as users. A person buys, a session doesn't, and a user rate isn't diluted when a campaign brings the same people back for a second look. The calculator asks for unique visitors for that reason.
Conversion rate = orders ÷ unique visitors × 100
Sessions are fine too, as long as every rate you compare uses them. What breaks a report is a Shopify session rate next to a GA4 user rate, with nobody saying which is which.
2. Take orders and visitors from the same month and the same place
Orders come from Shopify, because it counts every order, including those that analytics tools miss when a visitor blocks tracking. Visitors come from GA4 or your analytics tool, for the same dates and the same storefront.
Before dividing, check three things: the date range matches to the day, internal traffic and bots are filtered out of the visitor count, and test orders and cancelled orders aren't in the order count. Each one can move the rate by more than most site changes do.
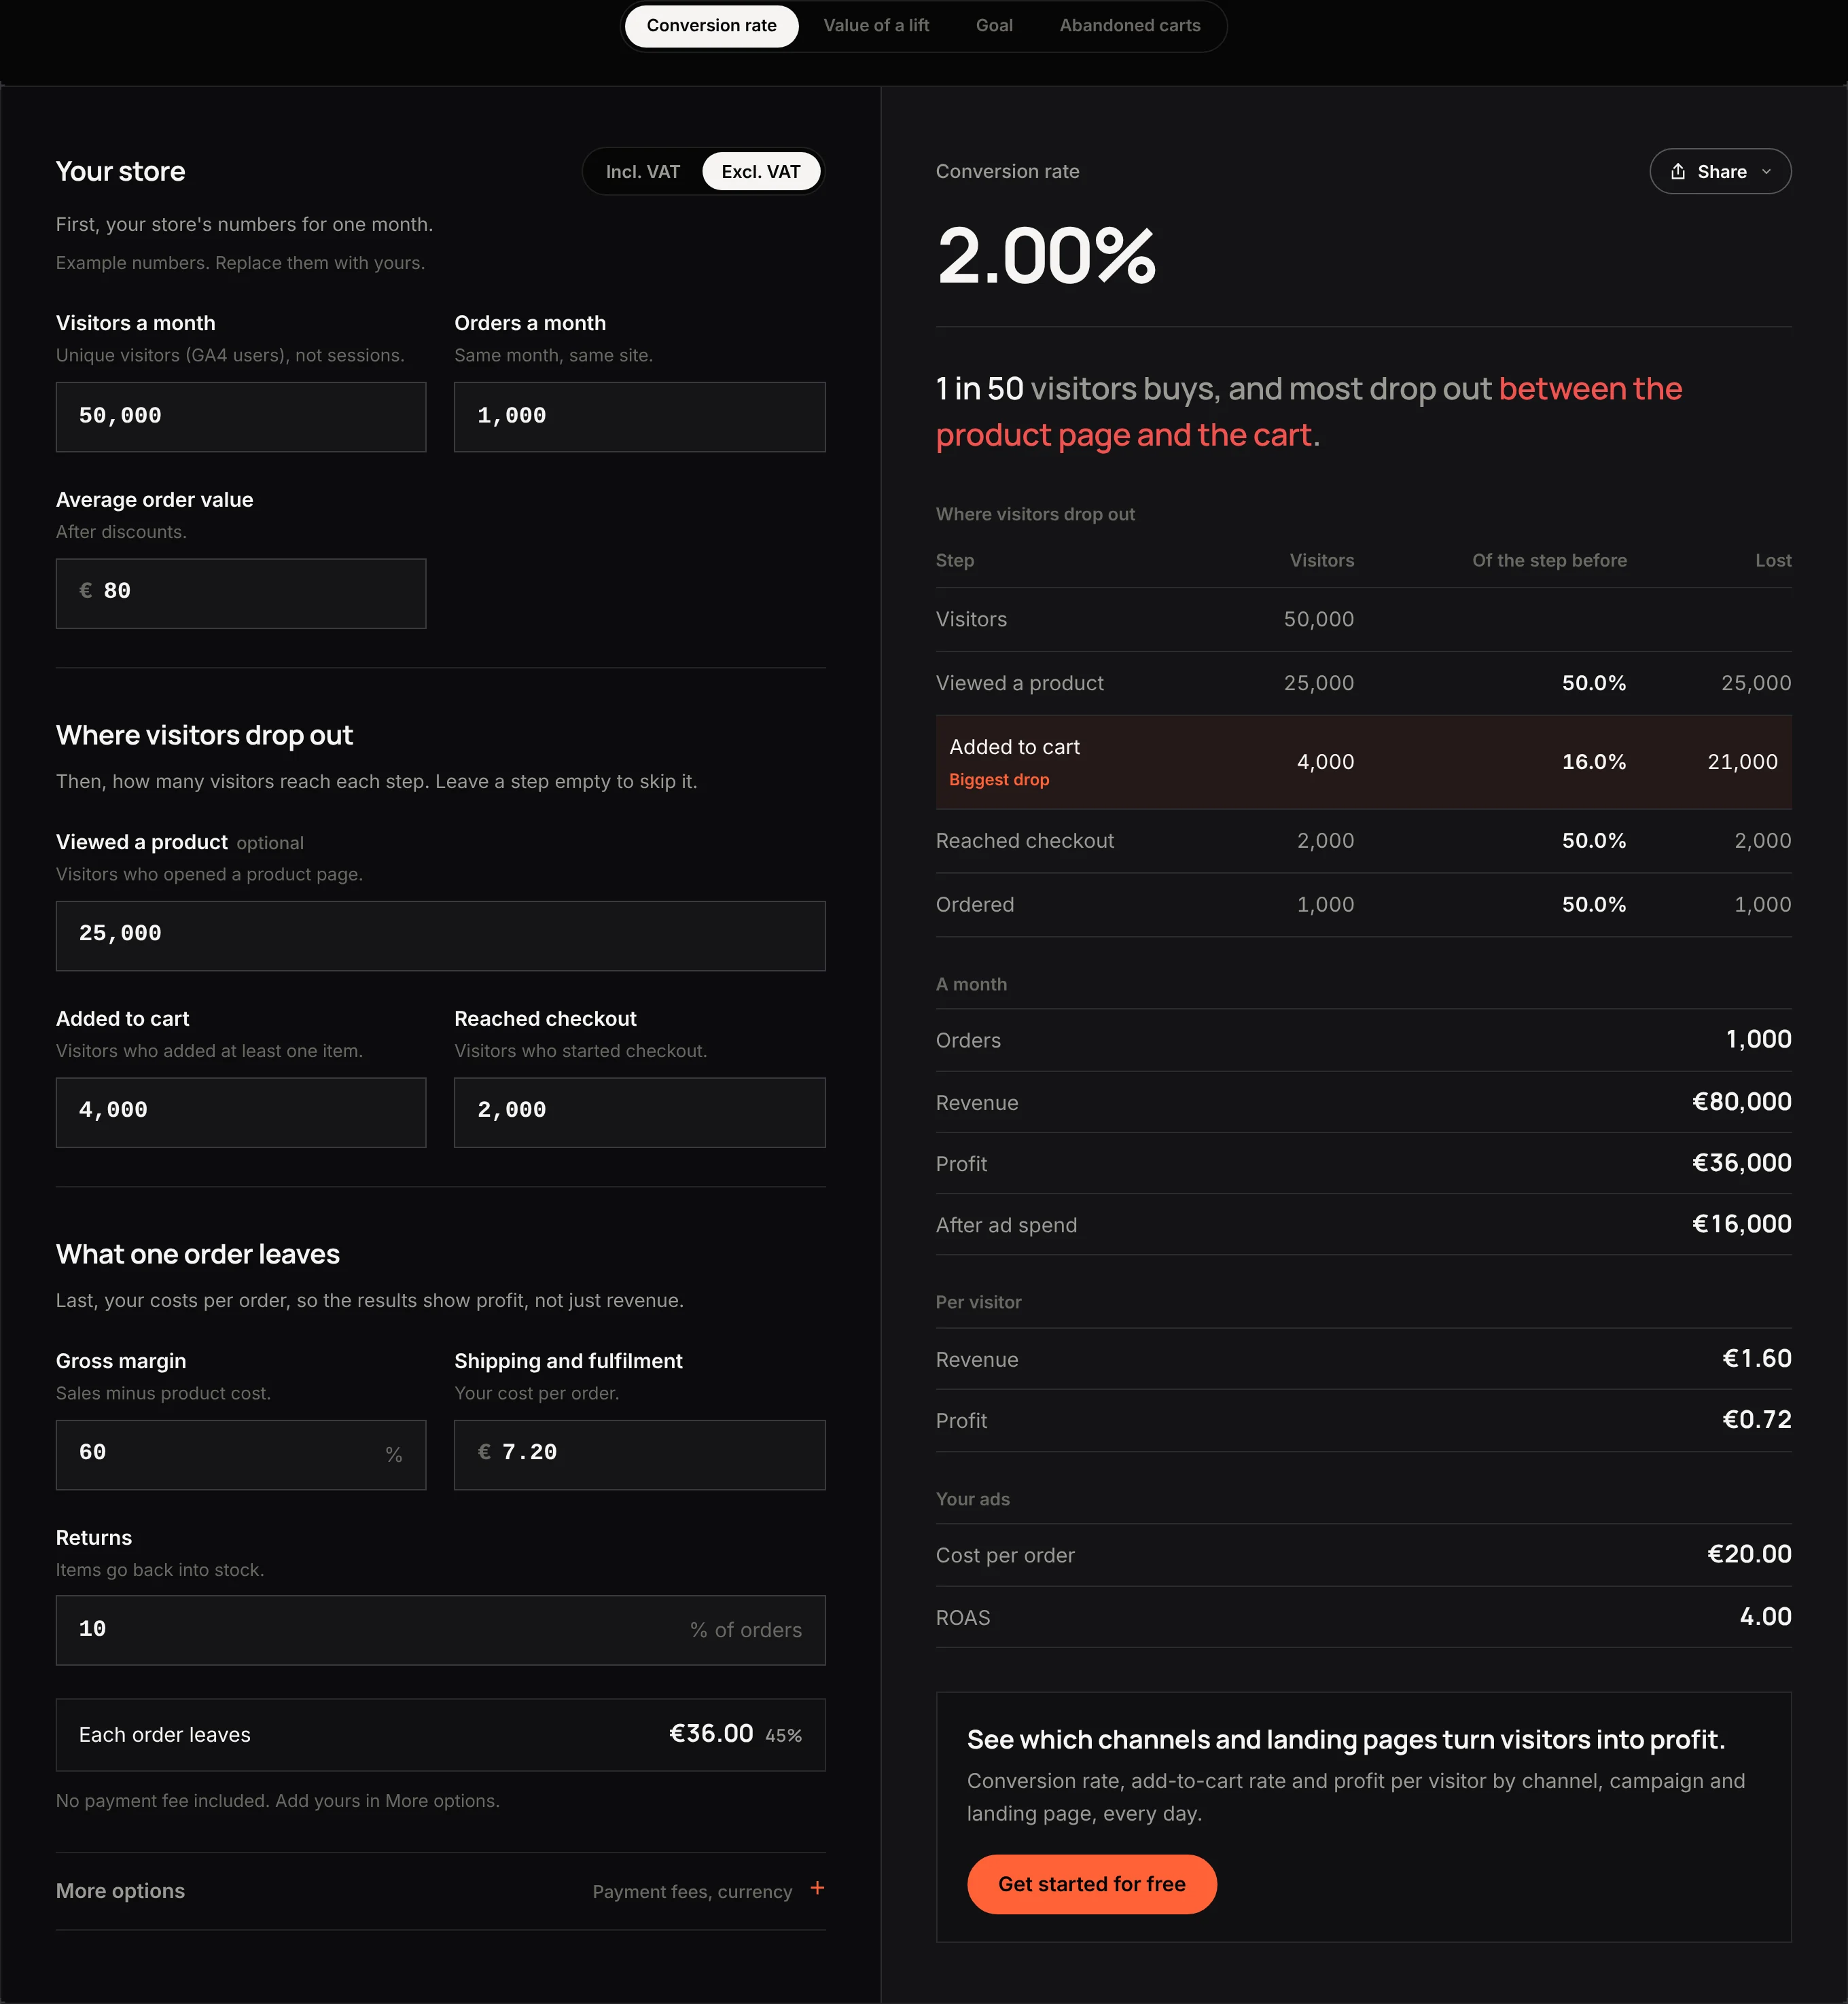
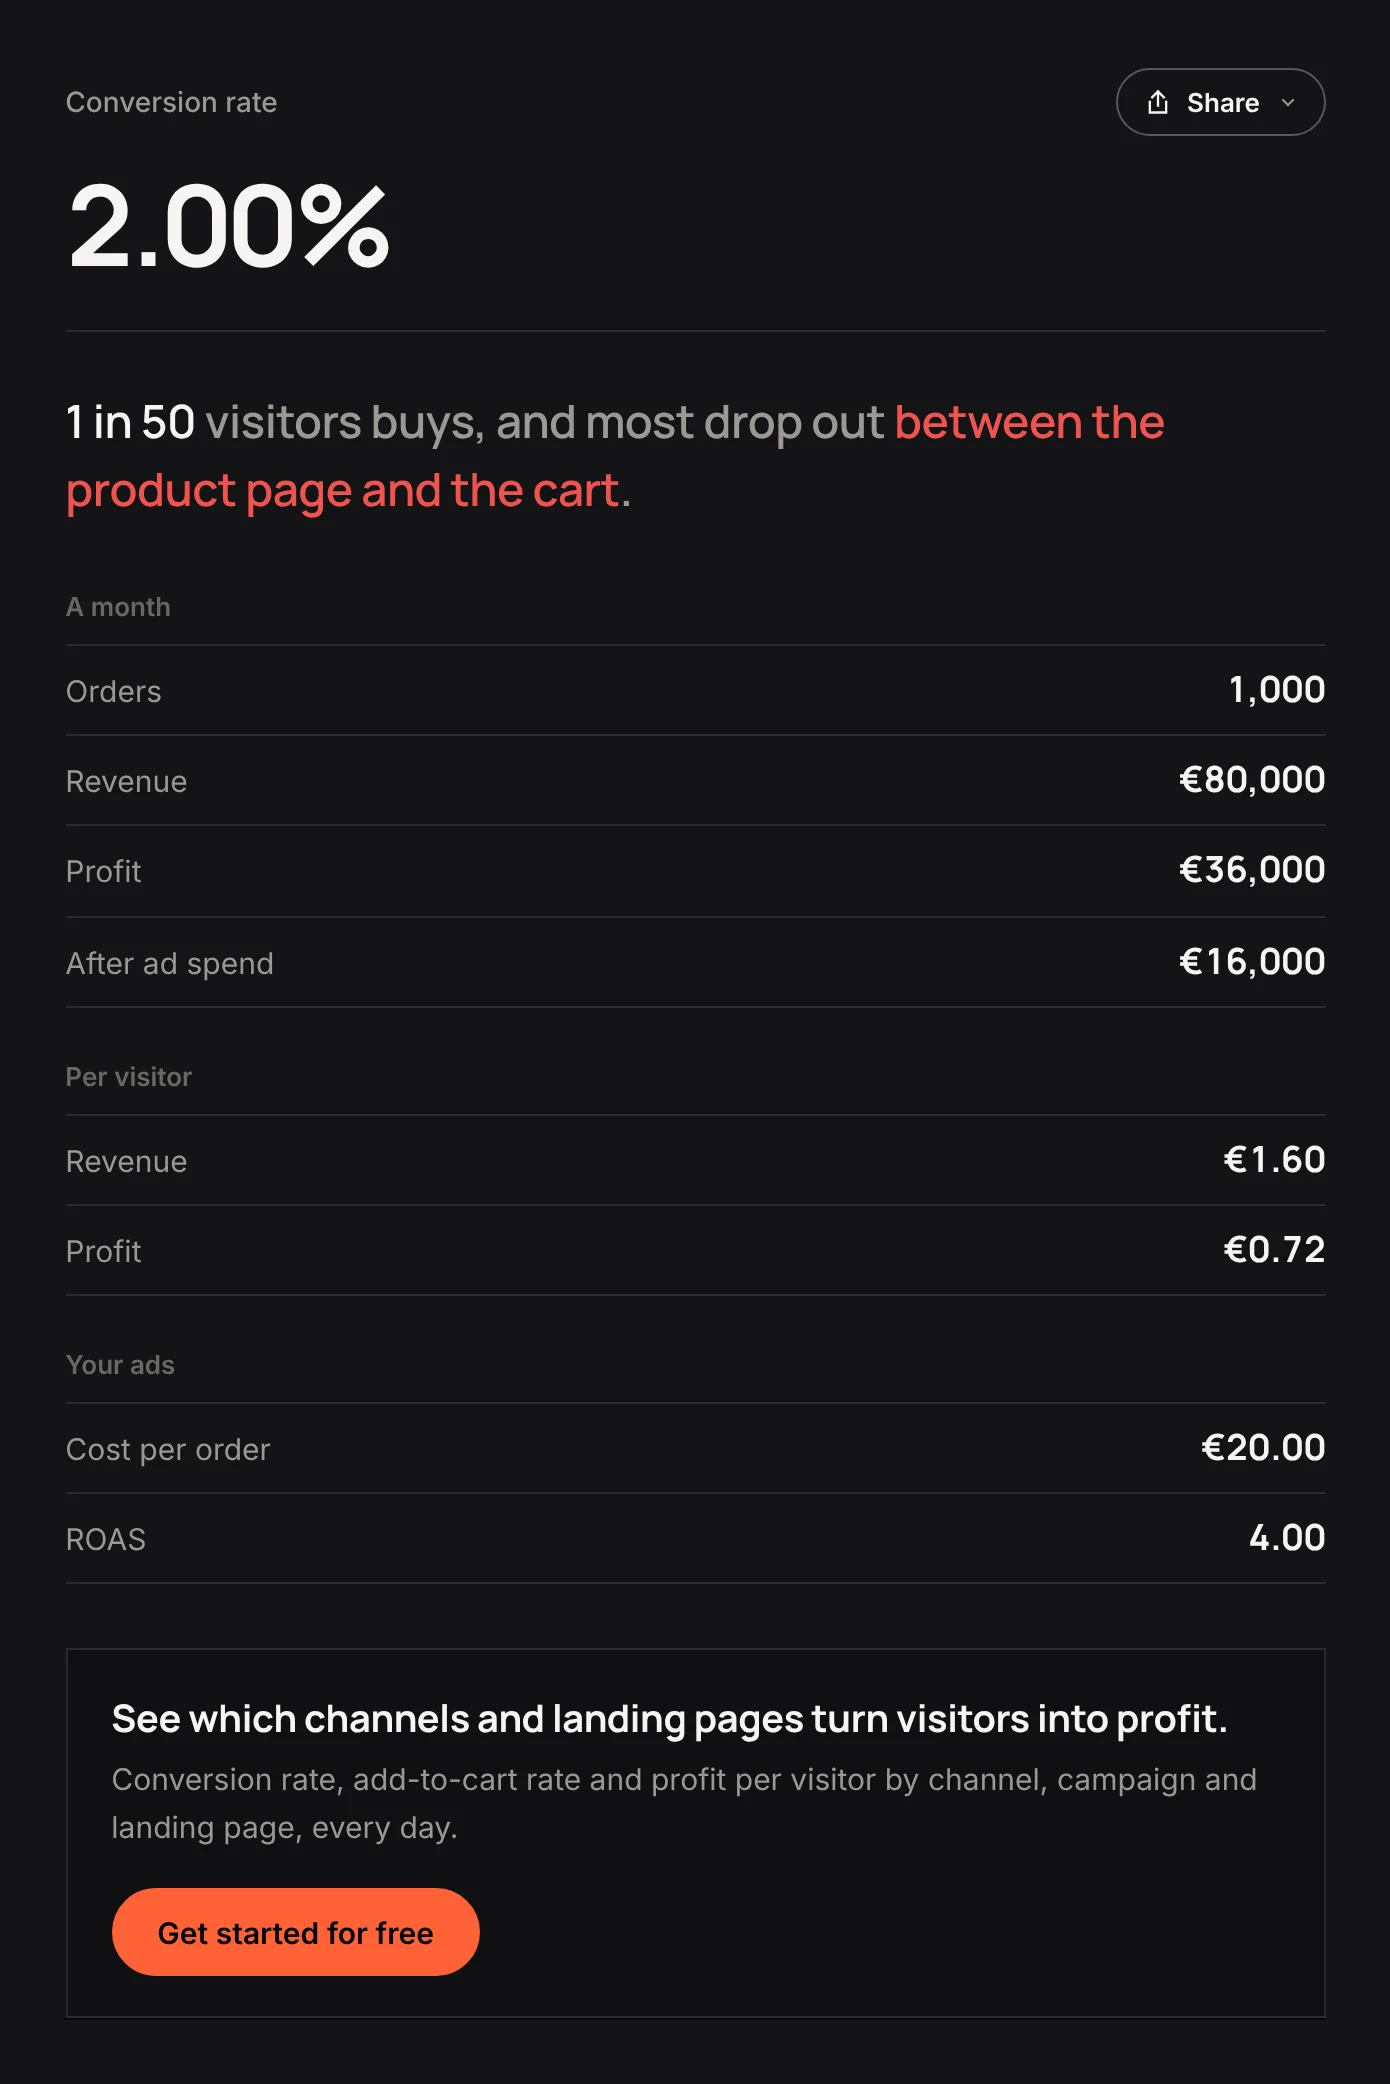
In the calculator's example store, 50,000 unique visitors placed 1,000 orders in a month, at an average order value of €80 before VAT, which makes a rate of 2.00%: one visitor in 50 buys, and revenue per visitor is €1.60.
3. Find the step where visitors drop out
A single rate says how many visitors buy. It doesn't say where the others stop, and that's the part you can act on.
Count four steps for the same month: visitors who viewed a product, added to cart, reached checkout and ordered. Shopify reports sessions with cart additions and sessions that reached checkout. A GA4 funnel exploration with the view_item, add_to_cart, begin_checkout and purchase events counts users at each step, in order. Take the whole conversion funnel from one tool, even if its order count sits a little below Shopify's, so every step is divided by a number counted the same way.
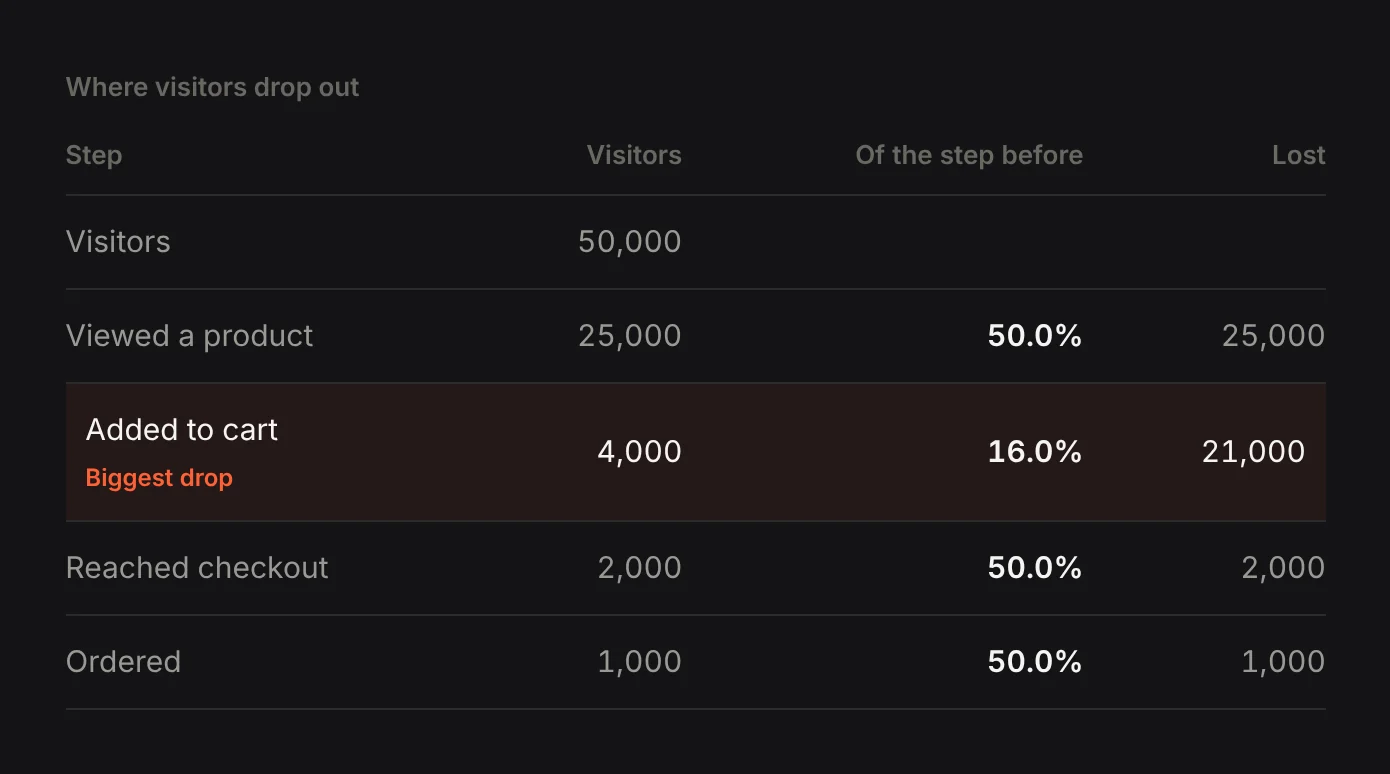
Then divide each step by the one before. The calculator marks the step with the lowest rate as the biggest drop:
| Example store, one month | Visitors | Of the step before |
|---|---|---|
| Visited the store | 50,000 | |
| Viewed a product | 25,000 | 50% |
| Added to cart | 4,000 | 16% |
| Reached checkout | 2,000 | 50% |
| Ordered | 1,000 | 50% |
Here the biggest drop is between the product page and the cart, which points at the product page (price, photos, delivery time, reviews) before the checkout.
4. Put a profit figure on each order before you value a lift
A better conversion rate brings more orders, and each of them is worth what it leaves after product cost, shipping, returns and payment fees.
Gross margin comes from the P&L or the product costs in Shopify. Shipping and fulfillment per order is the 3PL invoice divided by orders shipped. Returns are the share of orders sent back; returned items go back into stock, while the shipping and the payment fee are lost. Enter them under What one order leaves, and pick your payment method under More options if you want fees in.
The example order is worth €80 before VAT. On gross margin it leaves €48. After returns and shipping it leaves €36, and that's the figure every later step multiplies.
5. Value a better rate in profit
Value of a lift asks for the rate you want to reach and adds the extra orders, revenue and profit, a month and a year.
Read the lift both ways before you quote it. Going from 2.00% to 2.50% is half a percentage point, and a 25% lift on today's rate. Both are correct, and they sound like very different results in a meeting.
| Example store, 2.00% → 2.50% | A month | A year |
|---|---|---|
| Extra orders | +250 | +3,000 |
| Extra revenue | +€20,000 | +€240,000 |
| Extra profit after costs | +€9,000 | +€108,000 |
We ran the example store through 18 conversion rate calculators that rank for this search. Every one returned 2.00%, and the ones that valued the lift stopped at the revenue line. The profit line is less than half of it, and it's the one that should be weighed against what a redesign, an app or an agency costs.
The calculator also gives the value of each extra tenth of a point (€1,800 a month in the example), which is the unit most site changes move.

6. Compare the lift with buying the same profit through ads
A better rate is worth most when traffic is expensive. Enter your monthly ad spend and the calculator shows what the lift does to the ad numbers: the same spend now buys more orders.
In the example, €20,000 of ads at 2.00% costs €20 per order at a ROAS of 4.00. At 2.50% the same spend costs €16 per order at a ROAS of 5.00. Earning the same €9,000 extra profit through ads instead, at today's €20 per order, would take €11,250 more ad spend every month.
The ads route earns the extra €9,000 too, but only while €11,250 more goes out every month, and in practice cost per order rises as spend grows. The site route earns it from a one-off cost: divide what the project costs by €9,000 and you have its payback in months, as long as the lift holds once the test is over. If your ads cost more per order than an order leaves, more spend loses money, and the calculator says so.
7. Plan a goal from the orders it needs
Monthly targets are usually set in revenue or profit, and a conversion rate only becomes a target when you know the orders behind it.
The Goal tab works backwards. Pick orders, revenue or profit, enter the target, and choose how to reach it: A better rate on today's visitors or More visitors at today's rate. A profit goal counts what orders leave after costs, before ad spend.
The example store's €100,000 revenue goal needs 1,250 orders: either 2.50% on today's 50,000 visitors or 62,500 visitors at today's 2.00%. The calculator shows the profit at the goal (€45,000) for both. Most plans need some of each, and seeing the two extremes side by side shows which one the target is quietly relying on.

8. Count abandoned carts before and at checkout separately
Carts left behind are the visitors closest to buying, and they leave for different reasons depending on where they stop.
Count carts and checkouts for the same month as your orders. Carts left before checkout usually point at the cart itself: a total with no delivery cost on it, no express payment button, a code field that sends people looking for discounts. Carts left at checkout point at the checkout: shipping costs revealed for the first time, forms, payment errors, delivery options.
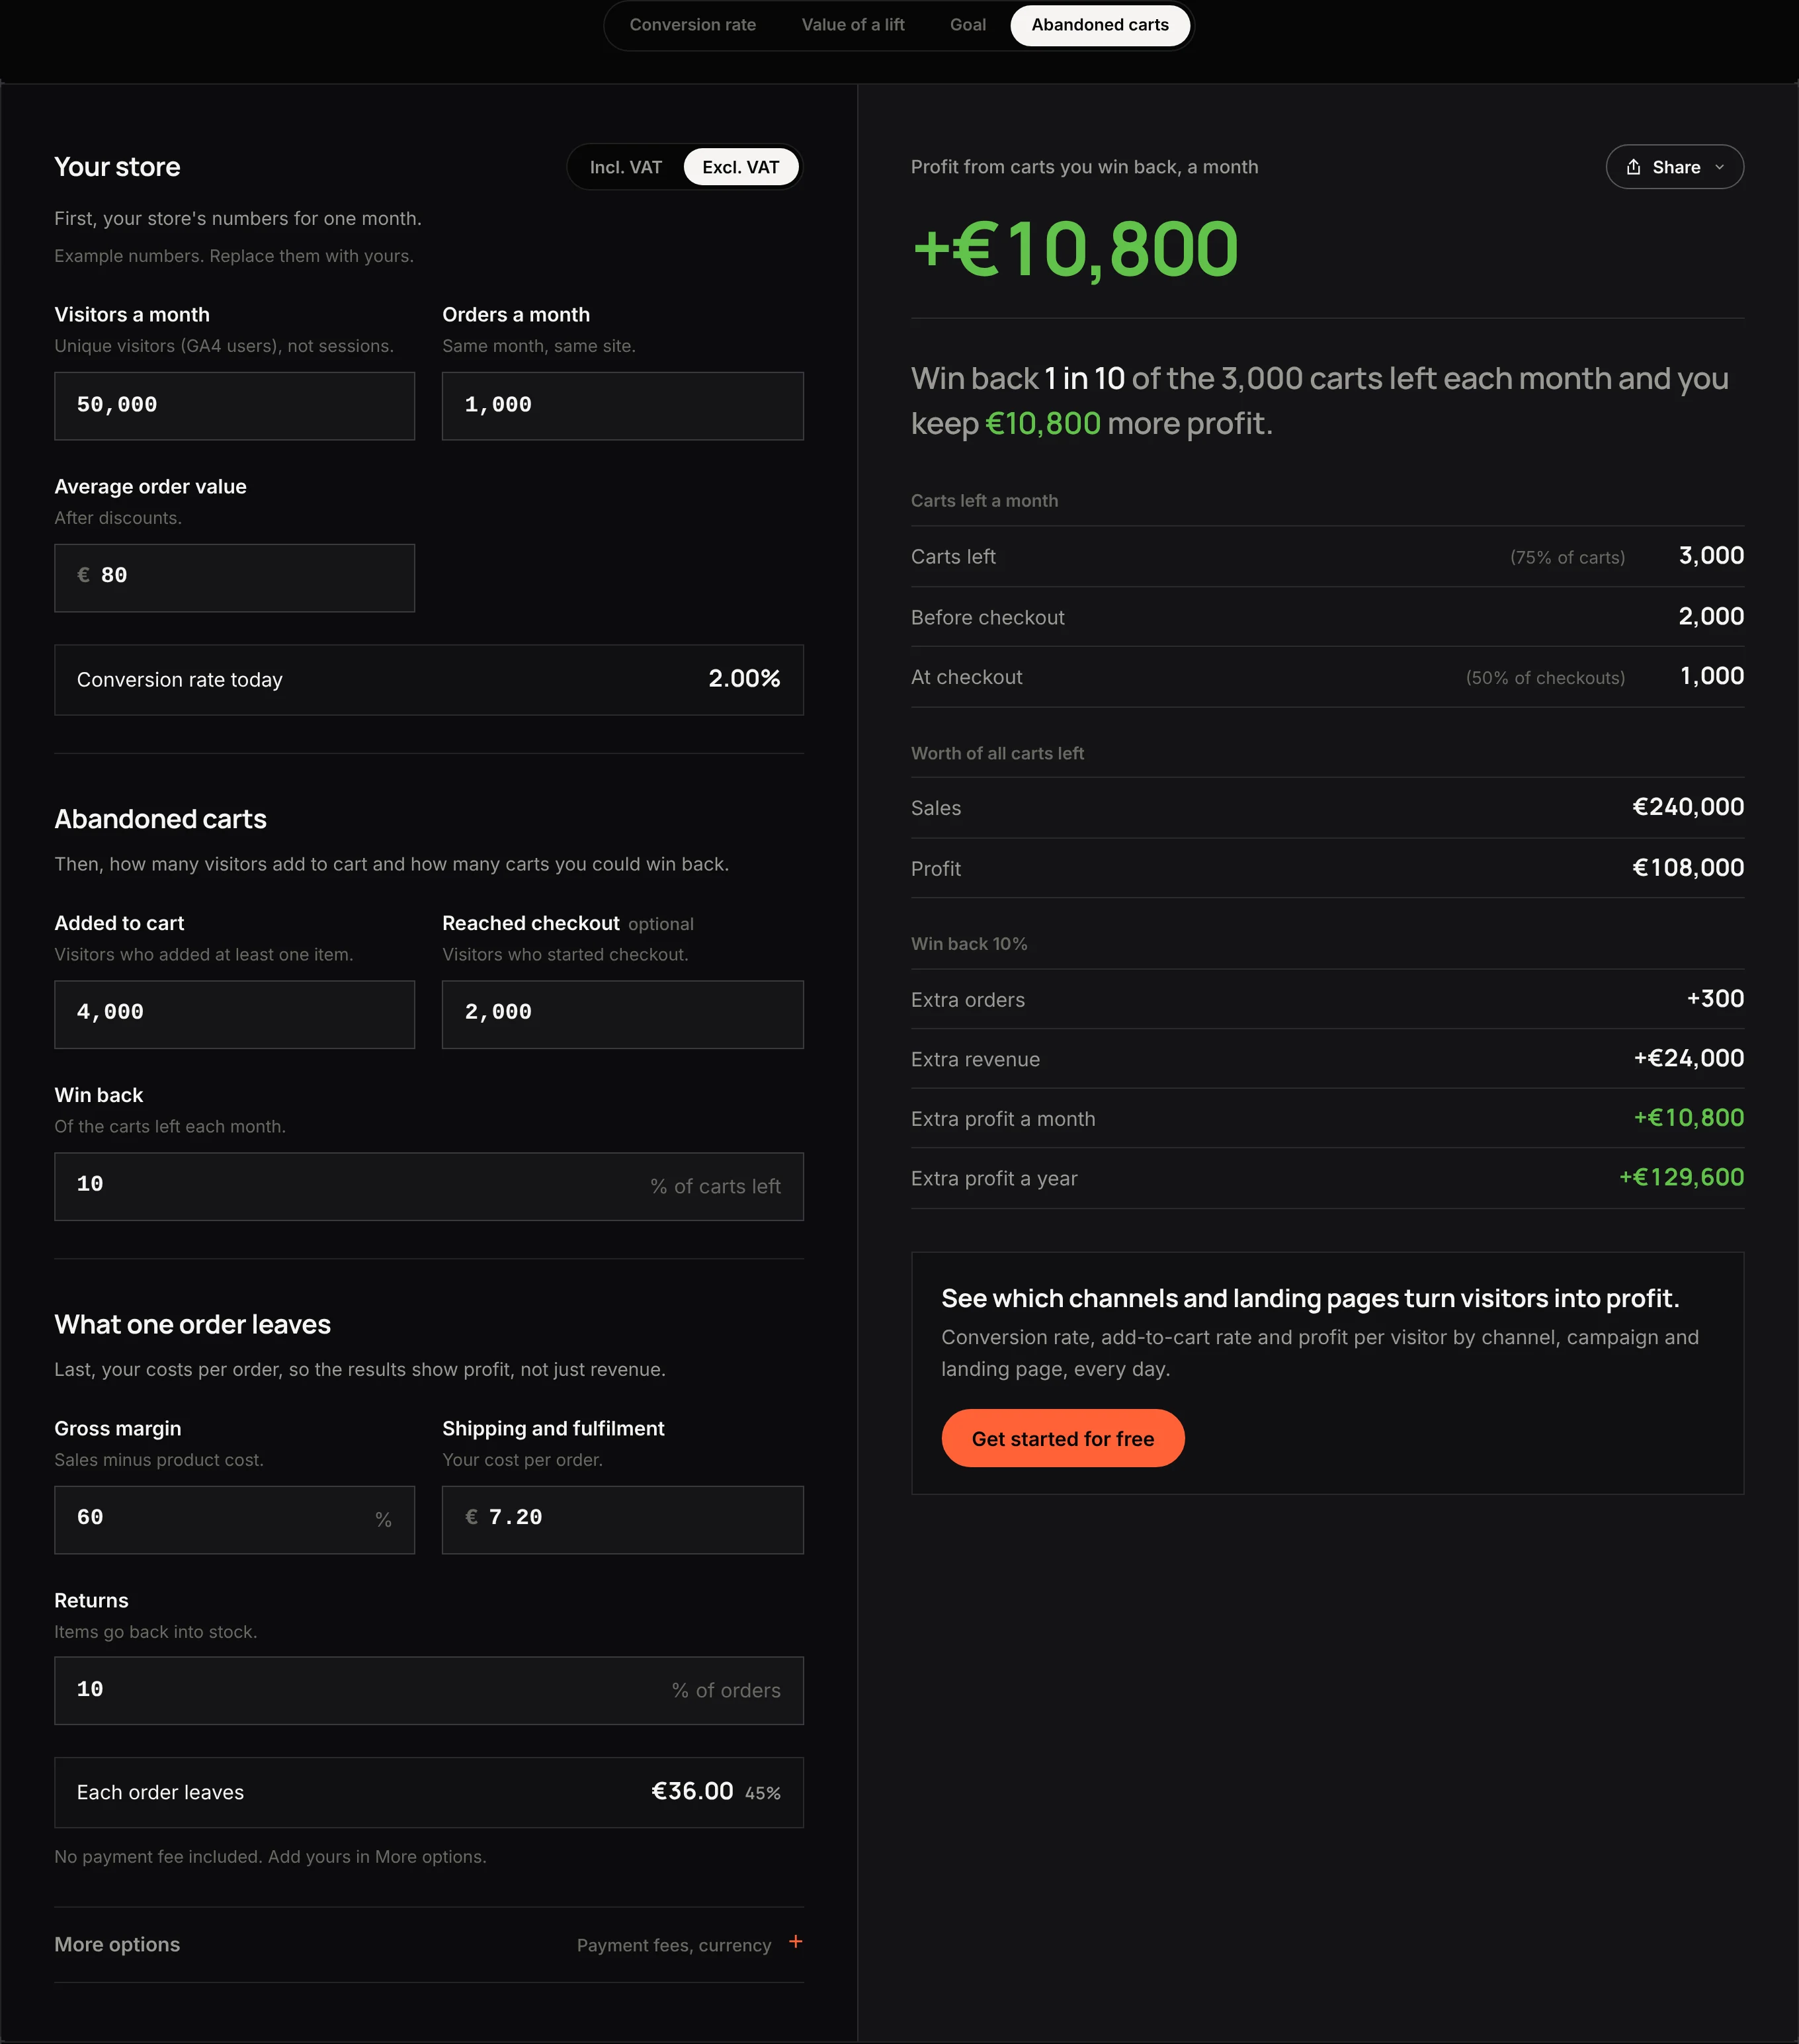
In the example store, 3,000 of 4,000 carts are left: 2,000 before checkout and 1,000 at checkout, half of everyone who starts it. All 3,000 together hold €240,000 in sales and €108,000 in profit, valued at one average order each. Winning back one in ten adds €10,800 profit a month. Put that number against the cost of an email flow or a checkout change; the €240,000 is what the carts hold, and no flow wins them all back.
How to increase conversion rate
Start with the step that has the lowest rate, because a few points there move the most orders. In a funnel where each step multiplies the one before, a 10% relative improvement at any step adds the same orders. Measured in percentage points, the weakest step is worth far more:
| Example store, one step 4 points better | Step rate | Extra orders a month | Extra profit a month |
|---|---|---|---|
| Product page → cart | 16% → 20% | +250 | +€9,000 |
| Store → product page | 50% → 54% | +80 | +€2,880 |
| Cart → checkout | 50% → 54% | +80 | +€2,880 |
| Checkout → order | 50% → 54% | +80 | +€2,880 |
Four points on the product page take the example store to the same 2.50% as step 5.
Discounts deserve their own check, because they lift the rate and cut what every order leaves at the same time. A 10% discount takes the example order from €36 to €28.80, and the store then needs 1,250 orders, a 2.50% rate, just to keep the profit it made at 2.00% without the discount.
Change one field at a time in the calculator and the profit row shows whether a lever pays before you spend on it.
What is a good conversion rate?
One at which the visitors you pay for earn back what they cost. Every part of that answer comes from your own numbers. Published figures for the average ecommerce conversion rate mix sessions and users, stores and lead-generation sites, cheap and expensive products, so the same 2.00% is "below average" on one calculator and "average" on the next.
To find the line for a paid channel, divide what one of its visitors costs by what one order leaves. If every visitor to the example store came from ads, €20,000 for 50,000 visitors is €0.40 each, and at €36 per order the break-even rate is 1.11%. The store's 2.00% clears it, and a channel whose visitors convert below that line loses money on every click, whatever its ROAS looks like.
Beyond that line, a good rate is a higher one than last quarter's, counted the same way.
What this calculator can't tell you
- Which channel or page converts. It works on store totals; the rate of paid social visitors and of email visitors can be several times apart.
- Why visitors drop out. It finds the step where they leave; the reason takes session recordings, surveys or a test.
- Whether a lift will hold. It values the rate you type in; a test tells you whether you can reach it.
- Changes in order value. It keeps the average order value fixed while the rate moves.
- Incrementality. Some of the extra orders after a site change would have come anyway.
Admetrics shows conversion rate, add-to-cart rate and profit per visitor by channel, campaign and landing page, every day, and follows visitors from click to session to cart to purchase. You see which traffic pays for itself, and on which page the rest of it leaves. To see it on your own store, book a demo; Admetrics pricing shows what each plan includes.
FAQ
How do you calculate conversion rate?
Divide orders by unique visitors for the same month and the same store, then multiply by 100. 1,000 orders from 50,000 visitors is 2.00%, one visitor in 50. Take orders from your store platform and visitors from your analytics tool, and use the same count of visitors (users or sessions) every time you compare.
What is the conversion rate formula?
Conversion rate = conversions ÷ visitors × 100. For an online store a conversion is usually an order, and visitors are either unique visitors (users) or sessions. Shopify uses sessions that completed checkout ÷ sessions, which usually gives a lower rate than orders ÷ unique visitors for the same store.
Should I use sessions or users for conversion rate?
Either works if you never mix them. Sessions count every visit, so a shopper who comes back three times counts three times and the rate comes out lower. Users count people, which is closer to how a store wins customers. We'd plan on users and keep the session rate for comparing with Shopify's own reports.
How do I find my Shopify conversion rate?
Shopify Analytics shows an online store conversion rate: sessions that completed checkout divided by all sessions. It also reports sessions with cart additions and sessions that reached checkout, which give the cart and checkout steps of your funnel. For a rate per unique visitor, take the orders from Shopify and the users from GA4.
What is cart abandonment rate?
The share of carts that don't become orders: (carts − orders) ÷ carts × 100. In the example store, 3,000 of 4,000 carts are left, a cart abandonment rate of 75%. The checkout abandonment rate counts only the people who started checkout: (checkouts − orders) ÷ checkouts, 50% in the example.
What is a good add-to-cart rate?
There's no figure that holds across stores, because it depends on price, product type and traffic. Read it as a step in your own funnel instead: if the share of product viewers who add to cart is your lowest step rate, the product page is where a few points move the most orders.