You probably know roughly what a new customer costs. What that customer is worth is harder to pin down, and it's the number that decides how much you can pay for the next one.
Ask around and the answer is usually revenue: order value times orders, sometimes times a margin. That makes every customer look worth more than the orders they leave behind, and every CAC look more affordable than it is.
This customer lifetime value calculator works it out in profit: what a new customer is worth over 12, 24 or 36 months, and the month they pay back what you paid to win them. A second tab compares two channels.
The guide below shows where each number comes from in Shopify and your invoices.
It's free and needs no email.
How to use the customer lifetime value calculator
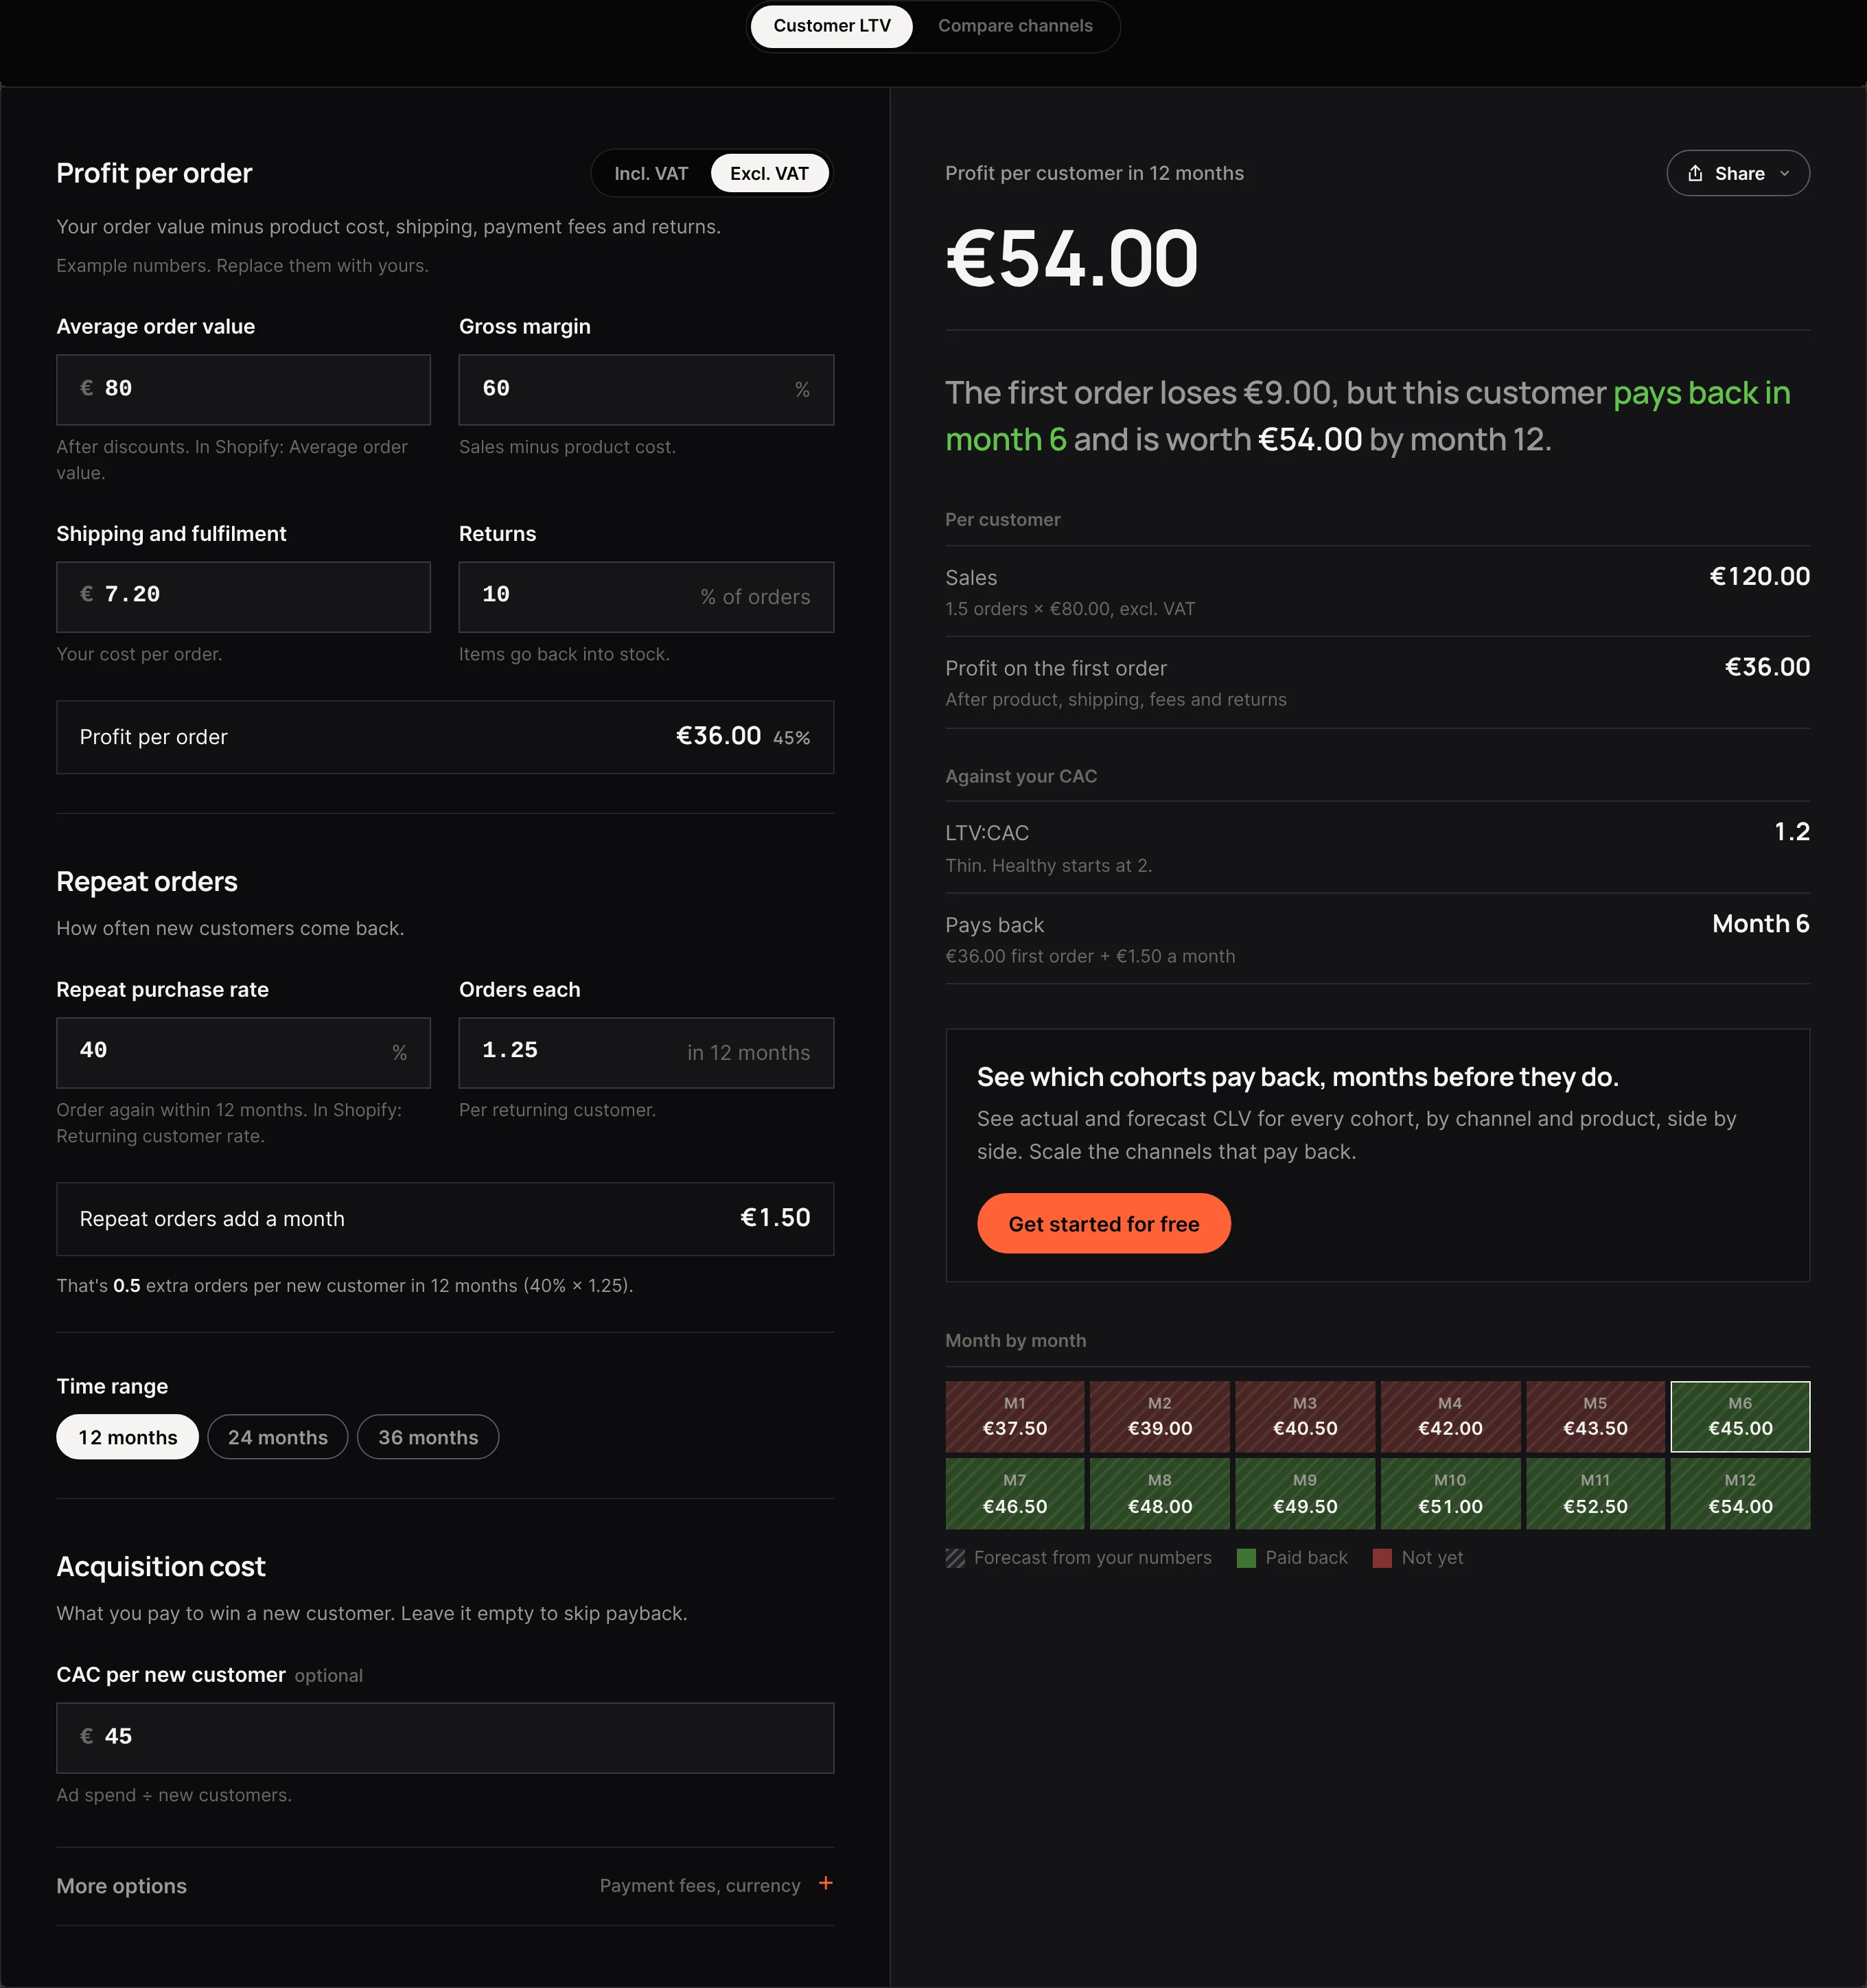
The calculator has two tabs. Customer LTV works out one new customer, and Compare channels puts two channels side by side. Both open on example numbers for you to replace:
- Average order value, after discounts, from Shopify Analytics. The Incl. VAT / Excl. VAT switch tells the calculator which one you typed; with Incl. VAT on, pick the country.
- Gross margin, sales minus product cost, from your P&L or the product costs in Shopify.
- Shipping and fulfilment, your cost per order from the 3PL invoice, with packaging and return labels in.
- Returns, the share of orders sent back.
- Repeat purchase rate and Orders each, from a cohort of first-time customers (step 3 below says how).
- CAC per new customer, optional: acquisition costs divided by first-time customers for the same dates. Leave it empty and the calculator skips payback.
The Time range chips switch between 12, 24 and 36 months, and past 12 months a Still buying next year field appears. More options holds the Shopify plan, the payment method (it fills in the fee, which you can edit), the currency and Reset. Share copies the result as text for Slack or email, or as an image.
The result gives profit per customer, LTV:CAC and the payback month, above a month-by-month row that stays red until the customer has paid back their CAC.
How to calculate customer lifetime value
Steps 1 to 4 produce the figure. Steps 5 to 8 turn it into a CAC limit, a payback month and a channel decision.
1. Agree what lifetime value counts
Every LTV figure hides three choices: revenue or profit, which customers, and over how long. Two people can quote numbers twice apart for the same customer, and neither has made an arithmetic mistake.
For budgets, we'd settle all three the same way every time. Profit after every cost an order carries, because that's the money that pays for acquisition. First-time customers only, grouped by the month of their first order, because returning customers were paid for long ago. And a fixed time range, because a lifetime with no end date can't be checked against anything.
That gives the customer lifetime value formula the calculator uses:
Customer lifetime value = what one order leaves × orders per new customer in the time range
Most free LTV calculators stop earlier. We entered the example store from step 2 into 19 of them. Most returned its sales or its gross profit, and the one that matched what its customer actually leaves only got there after we typed in a lower margin, with shipping and returns folded in by hand.
2. Work out what one order leaves
Gross margin is the usual shortcut, and it leaves out two costs: the margin lost on orders that are refunded, and shipping, which every order pays whether it's kept or not.
Order value after discounts and without VAT is in Shopify Analytics. Product cost sits in the P&L, and the 3PL invoice divided by orders shipped gives shipping and fulfillment per order. Payment fees are charged on the price including VAT and usually aren't refunded when an order comes back; pick your payment method under More options and the calculator adds them.
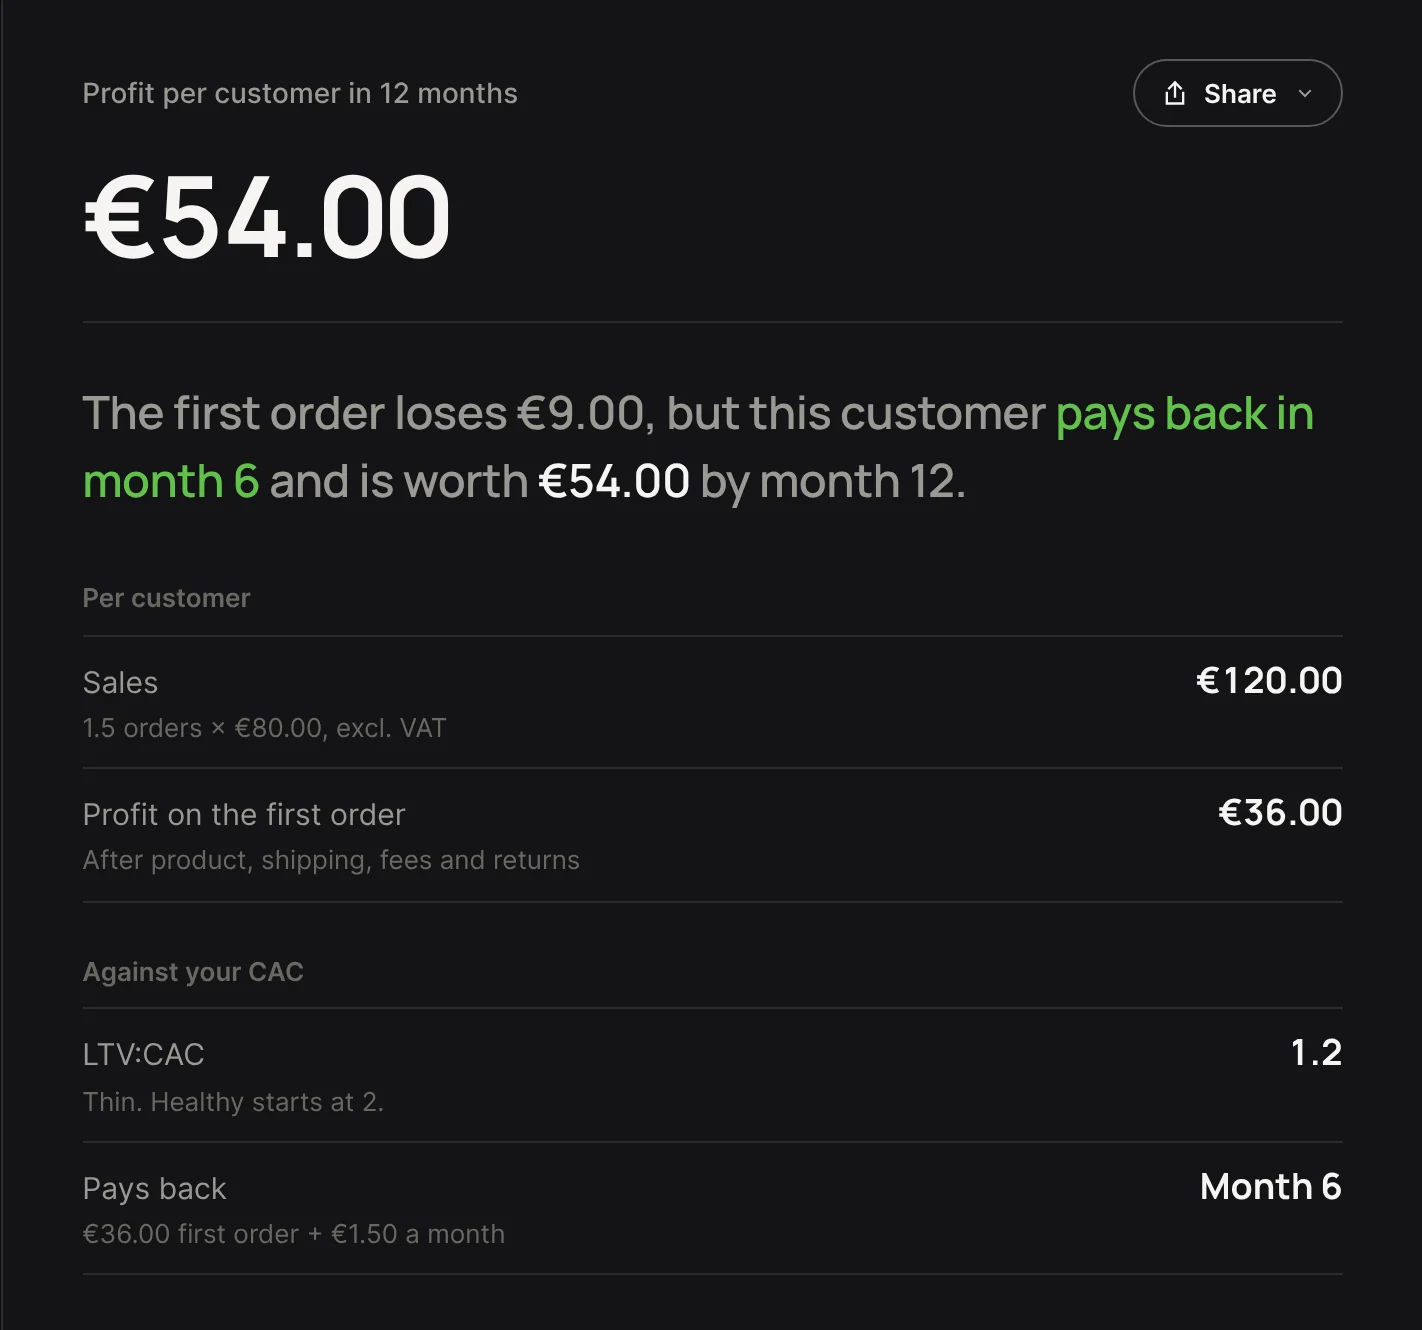
In the calculator's example, an order is worth €80 before VAT, product cost is 40% of that, shipping and fulfillment cost €7.20 and one order in ten comes back. On gross margin the order leaves €48. After returns and shipping it leaves €36 (the example has no payment fee set), and every later step multiplies that figure.
If your order value includes VAT, switch to Incl. VAT rather than typing it as net, or every figure the calculator gives comes out too high.

3. Measure repeat orders on a cohort of first-time customers
Repeat purchase rate is where LTV figures go wrong quietly. Shopify's returning customer rate looks at every customer in a period, and a store with a large, loyal base can show a healthy rate while this year's new customers barely come back.
The calculator needs two numbers from one group of customers:
- Repeat purchase rate: export the customers whose first order fell in one month at least a year ago, and count the share with a second order within 365 days.
- Orders each: those customers' repeat orders in that year, divided by the customers who came back.
Shopify's customer cohort analysis report groups customers by the month of their first order and shows how many come back month by month, a quick check on the export. Average a few cohorts, since a single month can carry a sale or a stock-out. The store-wide rate is fine for a first run, and we'd replace it before the result goes into a plan.
In the example store, 40% of new customers order again, 1.25 times each, which adds half an extra order per new customer in the first year.
4. Choose the time range before you read the number
Pick the range first: as long as orders make a profit, a longer one never gives a smaller number.
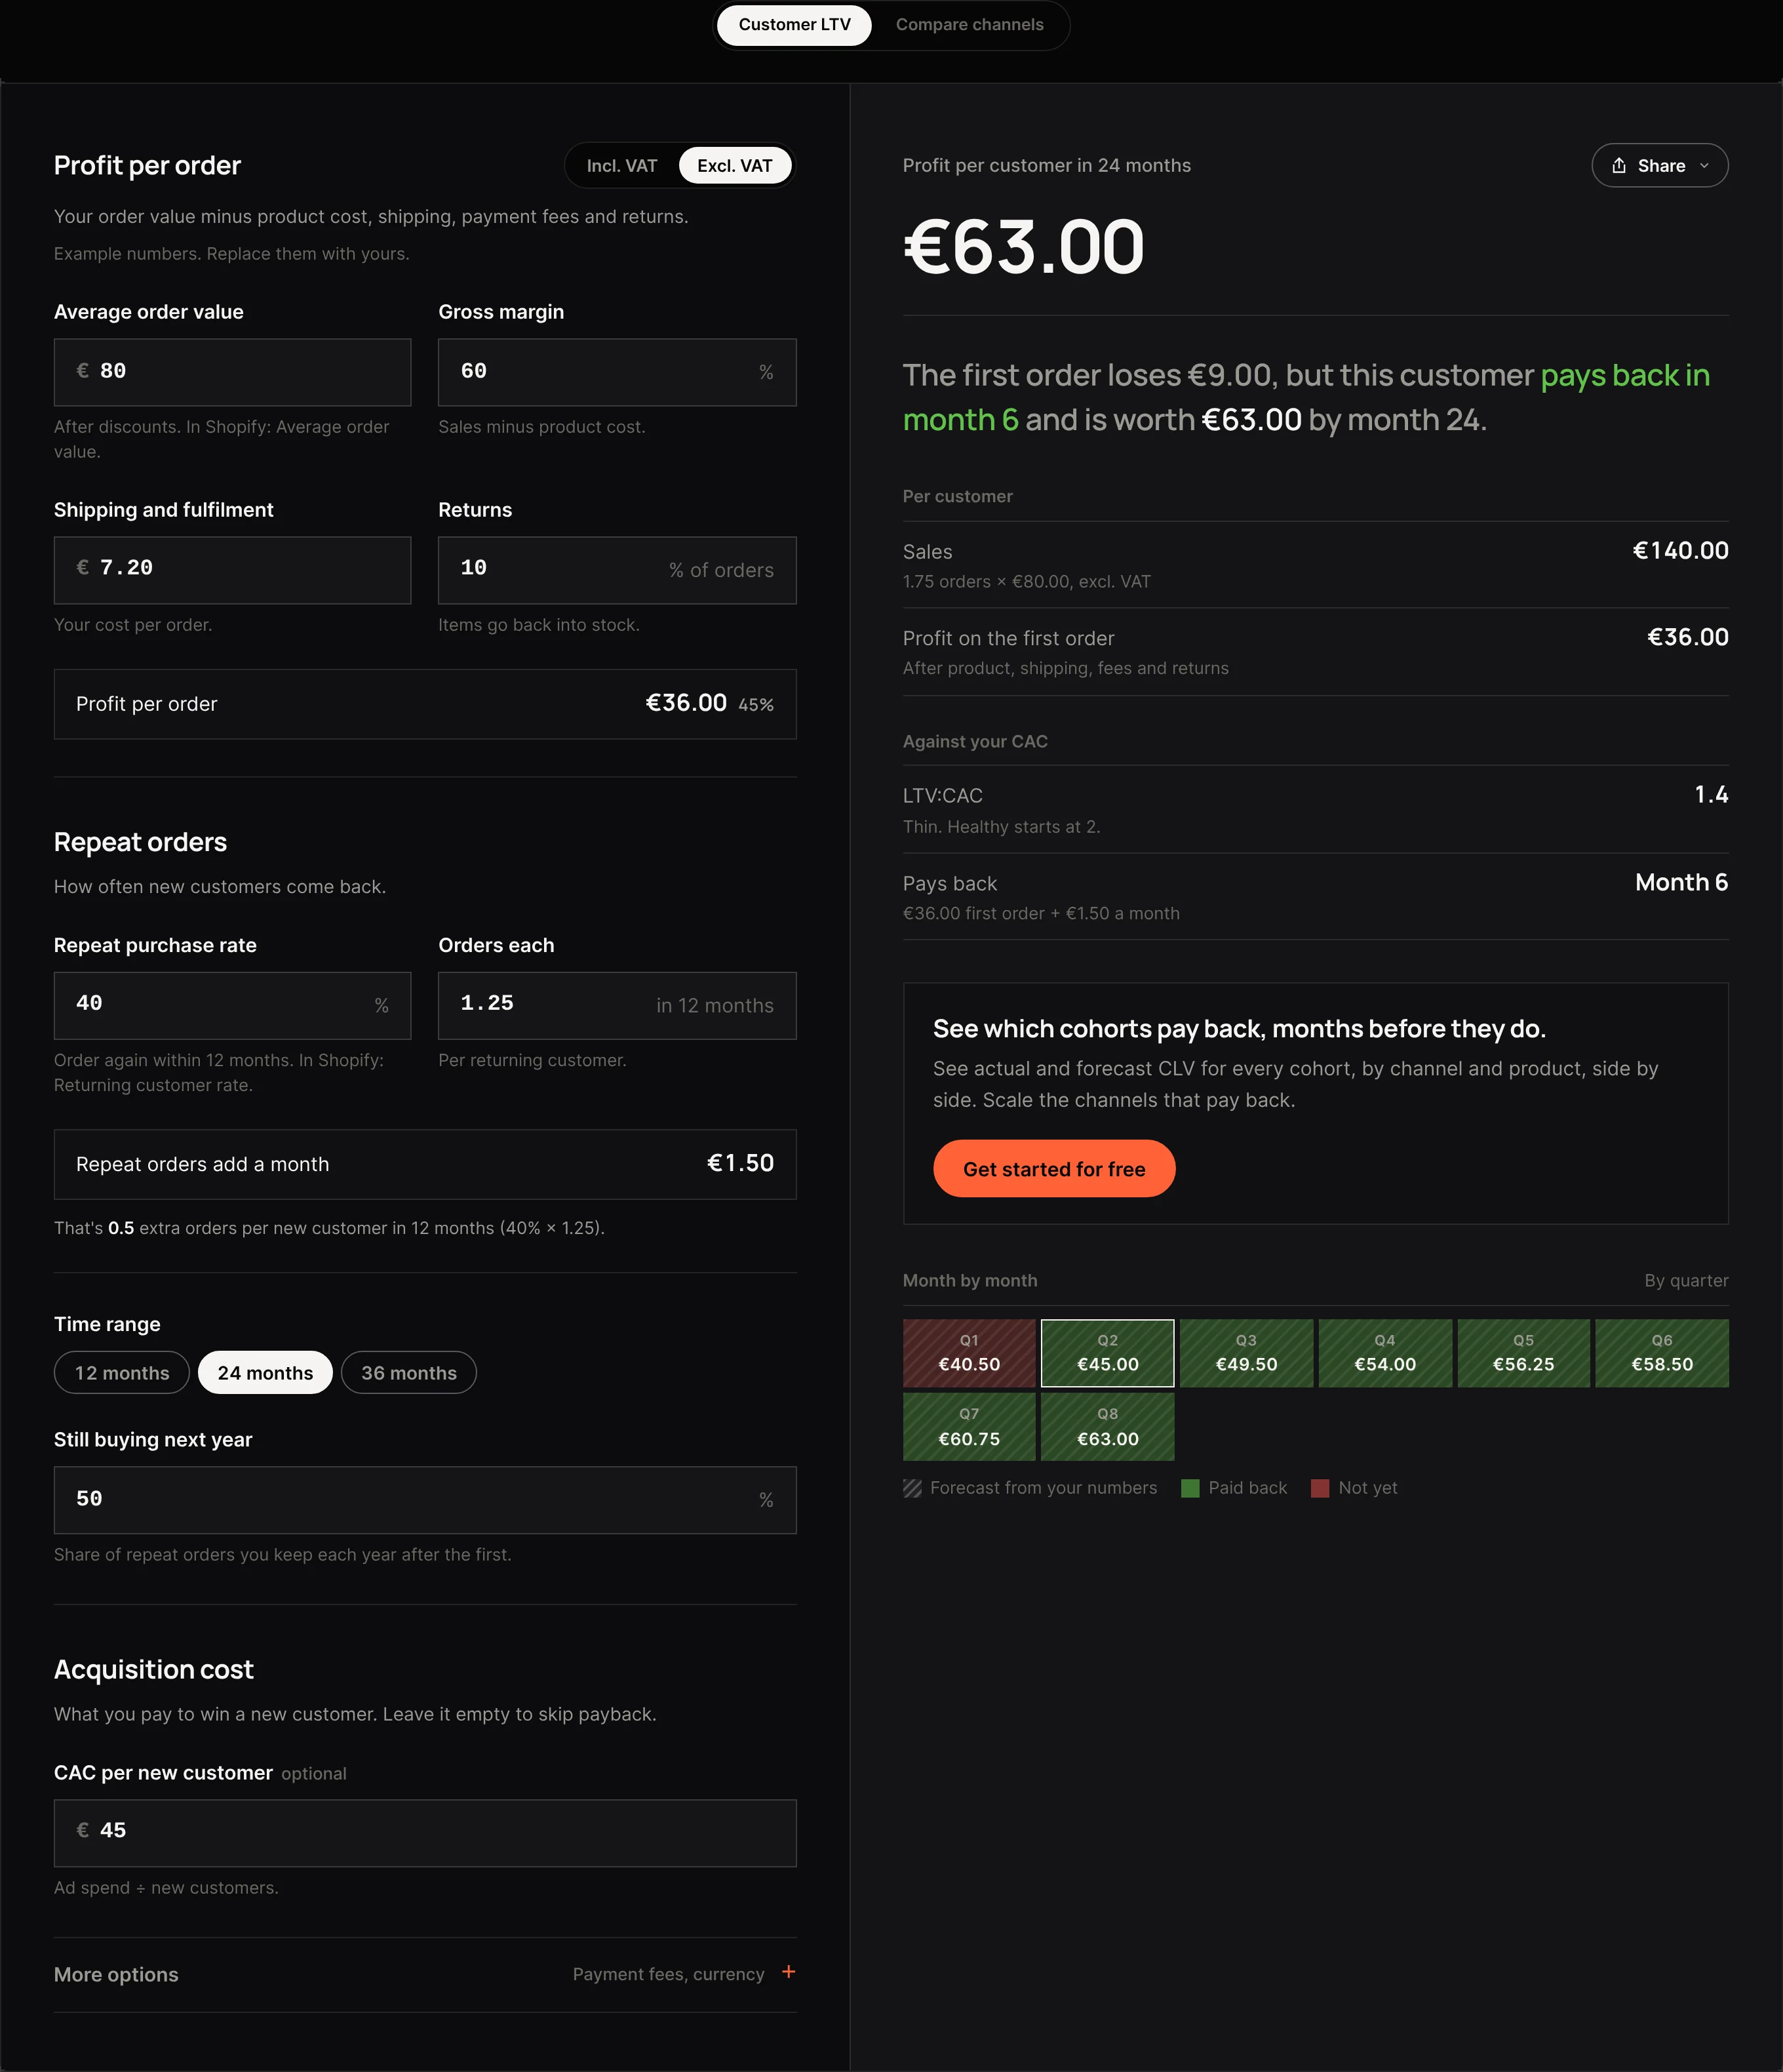
We'd plan on 12 months by default: most stores have complete cohorts for a year, and cash planning runs on one. Switch to 24 or 36 months once you have a cohort old enough to show its second year, and set Still buying next year from it: that cohort's orders in its second year divided by its repeat orders in the first. Without a cohort that old, stay at 12 months.
With half its repeat buying carried into each following year, the example store's customer is worth €54 by month 12, €63 by month 24 and €67.50 by month 36. Each extra year adds half of what the year before did, so the curve flattens fast.
5. Read LTV:CAC on profit, and use it to compare
LTV:CAC divides lifetime value by what you pay to win the customer. The ratio is quick to read and moves with whatever LTV you feed it.
| Example store, €45 CAC | LTV in 12 months | LTV:CAC |
|---|---|---|
| On sales | €120 | 2.7 |
| On gross margin | €72 | 1.6 |
| On what orders leave | €54 | 1.2 |
Same customer, same CAC, three ratios, and a 3:1 target doesn't say which of the three it was set on.
Our view is to calculate it on what orders leave and use it only to compare things measured on one basis: two channels, or this year's cohorts against last year's.
6. Read the payback month off the month row
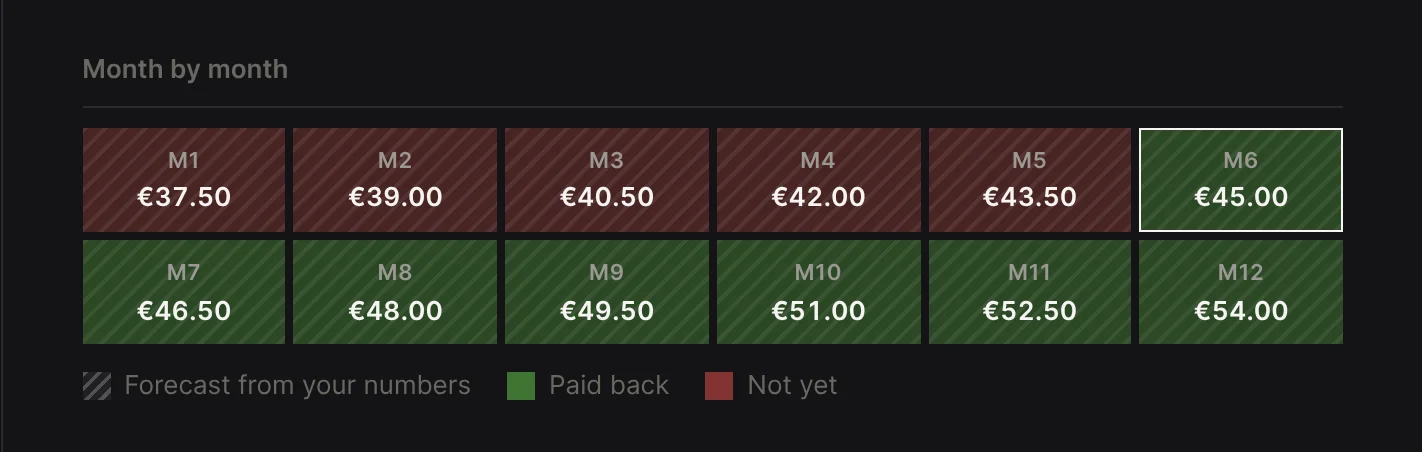
The month row adds the timing the ratio leaves out. Each cell is the profit the customer has brought in by the end of that month, red while it's below the CAC and green from the month it covers it.
Read three things off the result: what the first order leaves after the CAC, the month the row turns green, and whether you can fund the gap until then. In the example store at a €45 CAC, the first order ends €9 short, and the customer pays back in month 6.
Which month is acceptable is a cash question more than a marketing one. If the row never turns green, the verdict says how far short the customer ends.
7. Compare channels by what their customers leave over time
First-order ROAS ranks channels by the first order alone, which favors channels with bigger first orders and ignores the repeat orders the others bring.
Start from the cohort export in step 3 and give each customer the channel of their first order (Shopify's order details show its UTM parameters, as does your analytics tool). Repeat purchase rate and orders each per channel follow from there. In Compare channels, the shared costs go in once, then each channel's order value, CAC from your own data rather than the platform's CPA, repeat rate and orders each.
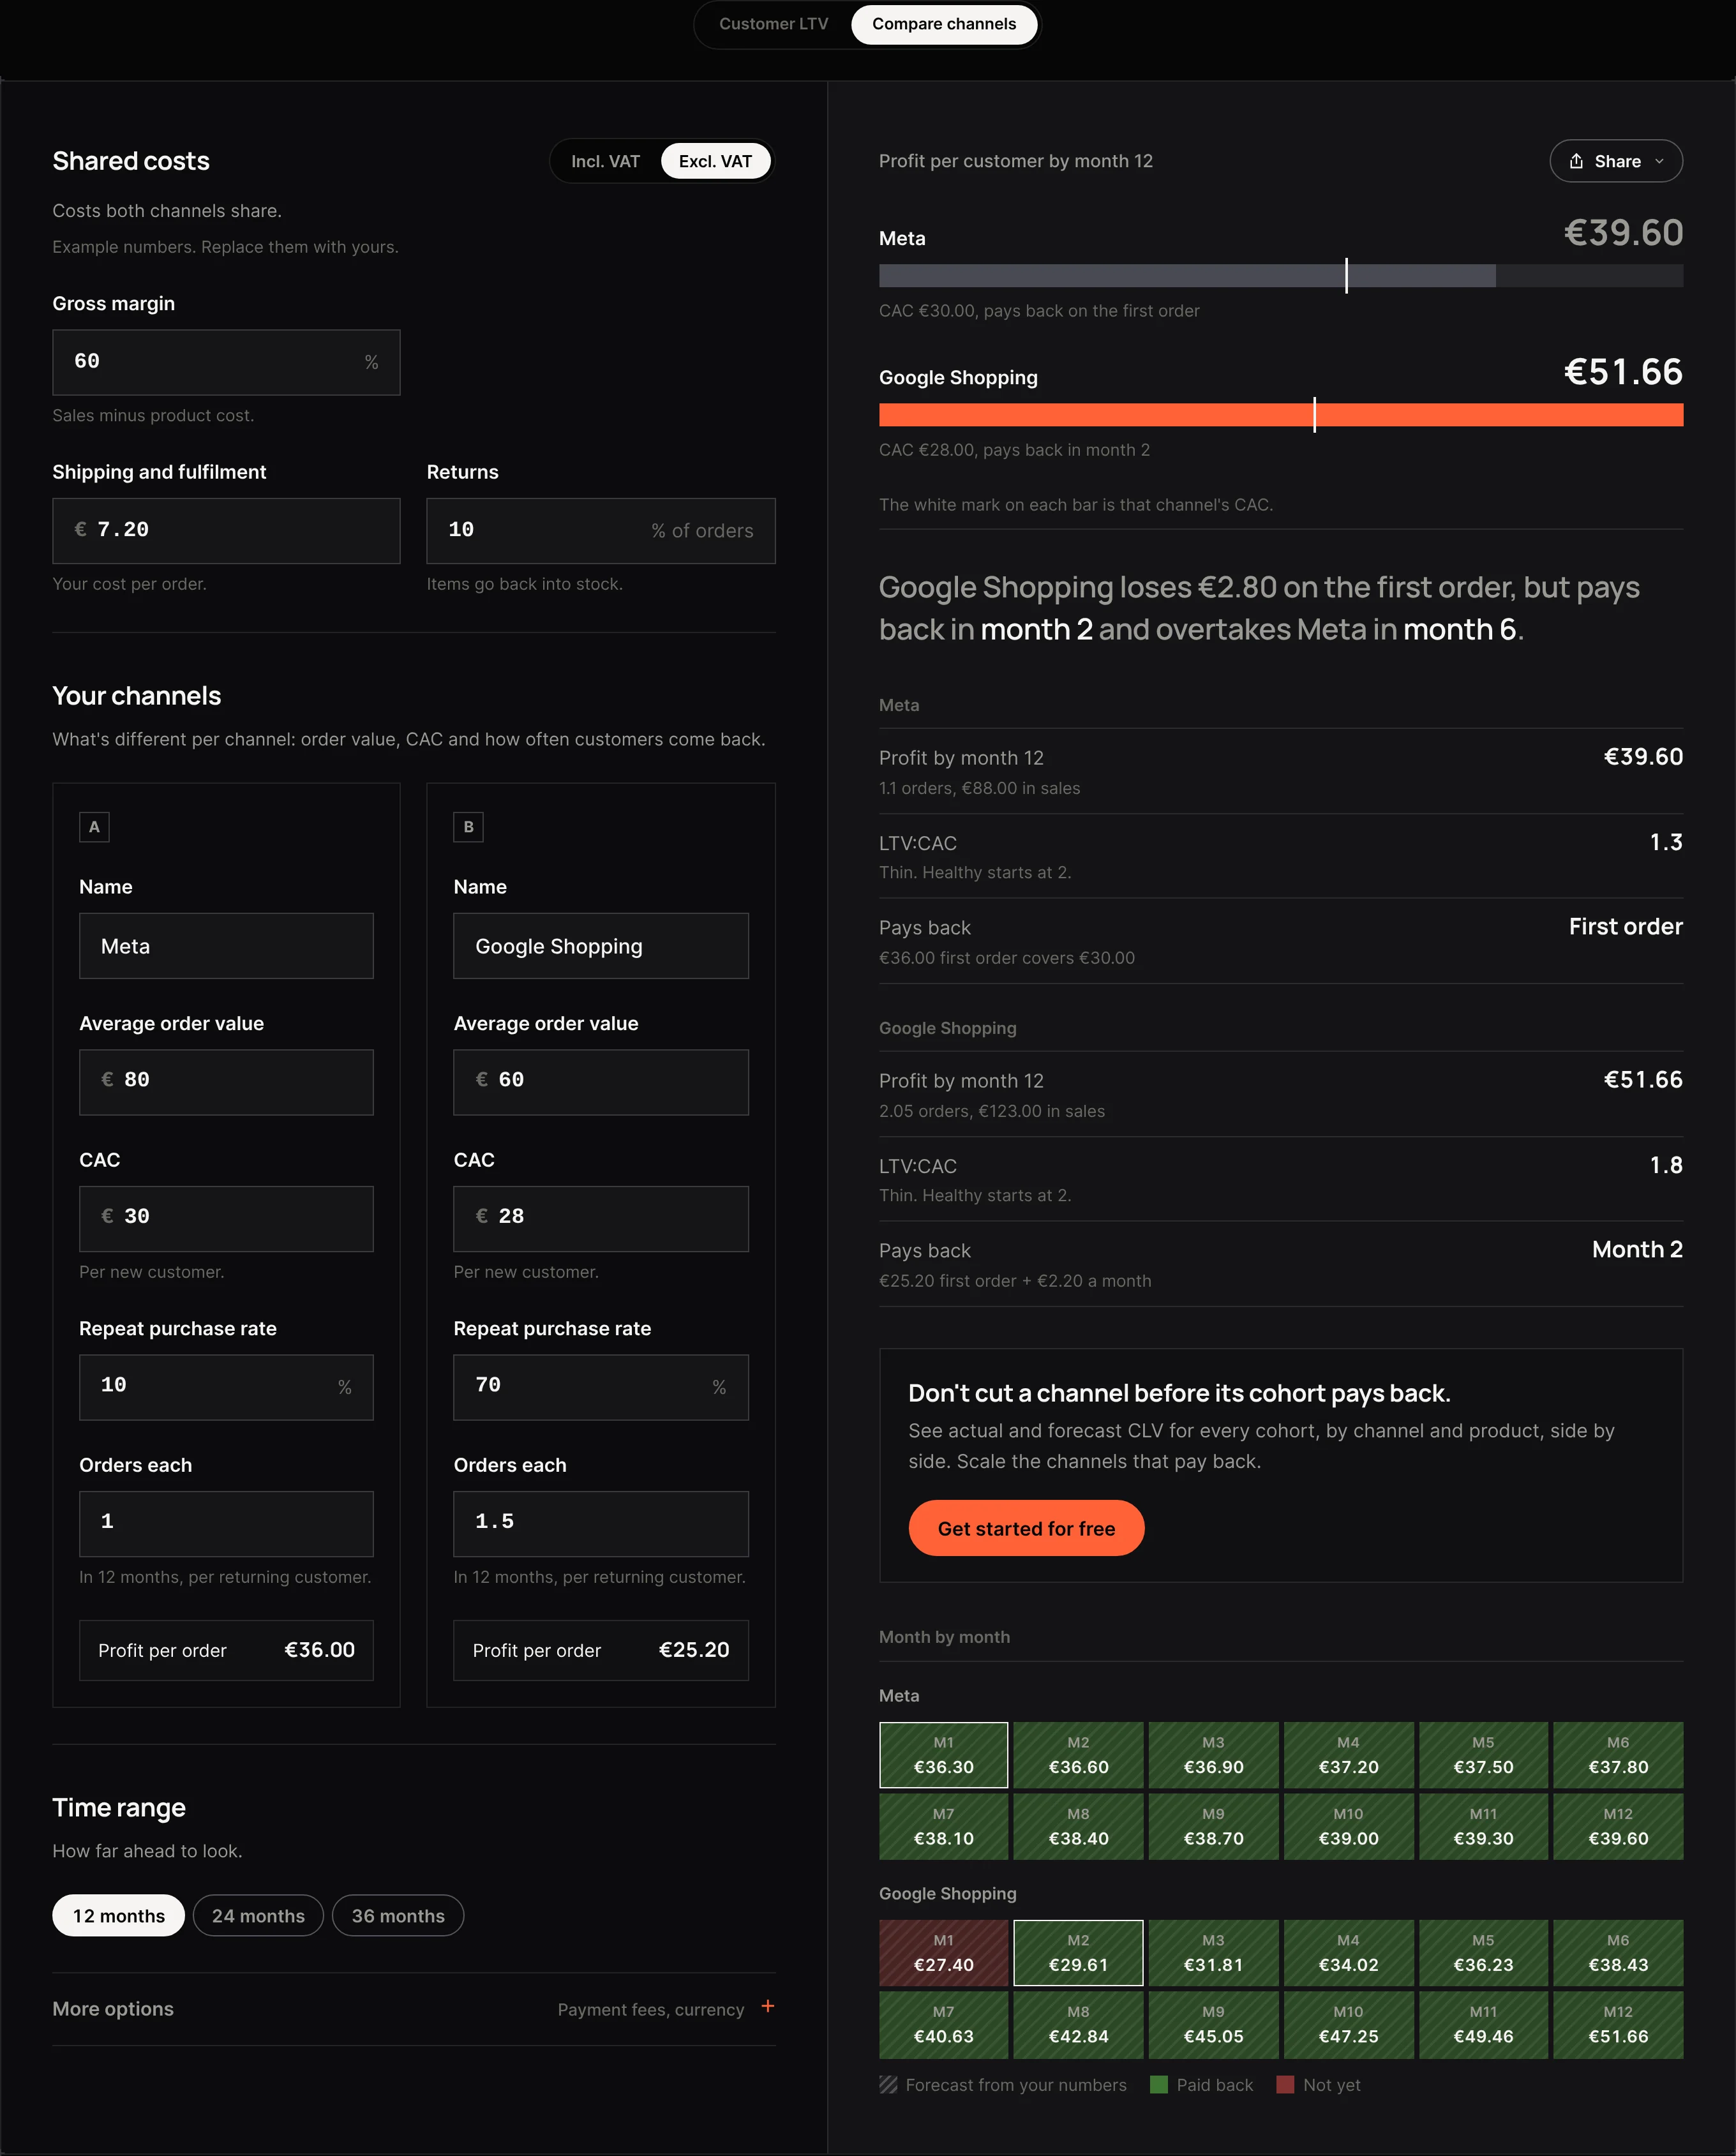
The calculator's example compares Meta and Google Shopping. Google Shopping's smaller orders leave €2.80 less than its CAC on the first order, while Meta's customers pay back at once. Google Shopping still pays back in month 2, overtakes Meta in month 6 and ends about €12 ahead in profit per customer by month 12, about €14 once each channel's CAC is taken off.
Don't cut a channel on its first-order numbers before its customers have had the months to pay back.
The same split works for the first product bought and for customers who came in on a discount code. Both groups often come back at a different rate from the store average.
8. Rerun it as cohorts age
The calculator is a simple customer lifetime value model: it forecasts from averages, spreads repeat orders evenly across each year and assumes every repeat order leaves what the first one did.
Update it with the latest cohort numbers every month or quarter, and watch the repeat purchase rate of the newest cohorts: when it falls, every LTV in the plan falls with it, long before revenue shows anything.
How to increase customer lifetime value
Lifetime value has two halves, what each order leaves and how many orders a customer places. Changing one field at a time in the calculator shows which half moves your number more.
| Example store, one change at a time | Gain in 12-month LTV per customer |
|---|---|
| Repeat purchase rate 40% → 50% | €4.50 |
| Order value €80 → €85, same margin | about €4 |
| Returns 10% → 5% | €3.60 |
| Orders each 1.25 → 1.5 | €3.60 |
| Gross margin 60% → 62% | about €2 |
| Shipping and fulfillment €1 cheaper | €1.50 |
Order value, margin and cost changes lift every order, the first one included, while repeat changes add from the second order on, and either kind can bring payback forward. What each change costs (a post-purchase email flow, a price test, a new packaging contract) is the other half of the decision, and only you know it.
What is a good customer lifetime value?
One that pays back what you spend to win the customer within a payback month the business can fund, with enough left over to cover a share of overheads. Every part of that answer comes from your own numbers. Averages published for other stores mix revenue and profit figures, time ranges and acquisition costs, so they can't stand in for it.
To check yours, enter your CAC and read the payback month. Then take LTV minus CAC for your time range and multiply by the new customers you plan to win: the total has to cover the part of rent, salaries and software that growth is meant to pay for.
What this calculator can't tell you
- Your actual cohorts. It forecasts from the averages you type; real cohorts arrive in uneven months.
- When repeat orders land. They're spread evenly through each year; holiday peaks or refill cycles shift the early months.
- Repeat orders that differ from the first. A discounted first order or a smaller refill needs its own run.
- More than two channels, or first products, in one view.
- Incrementality. Some first-time customers would have found the store without the ad that gets the credit.
Admetrics shows lifetime value in contribution margin for each monthly cohort of new customers, by channel and by first product. It forecasts the rest of a young cohort's first 12 months and marks the month the cohort passes its acquisition cost, so you can see which channels pay back without waiting a year for the data. To see it on your own orders, book a demo; Admetrics pricing shows what each plan includes.

FAQ
How do you calculate customer lifetime value?
Work out what one order leaves after product cost, returns, shipping and payment fees, then multiply it by the orders a new customer places in a set time range: the first order, plus repeat purchase rate × orders each in year one, plus a shrinking share of that in later years. Take the repeat numbers from a cohort of first-time customers at least a year old, and leave VAT out of the order value.
What is the customer lifetime value formula?
The common version is average order value × purchase frequency × customer lifespan, which gives revenue; multiplying by gross margin turns it into gross profit. For budgets, use what one order leaves after product cost, returns, shipping and fees × orders per new customer in 12, 24 or 36 months. On the same customer, the revenue version can come out at more than twice the profit one.
Is LTV the same as CLV?
Usually, yes. LTV, CLV and CLTV name the same metric in marketing: the value of a customer over a period. Some teams use LTV for revenue and CLV for profit, others the other way round, so the abbreviation says less than the definition behind it. Before comparing two numbers, ask which costs came out and over how many months.
Should lifetime value be based on revenue or profit?
Profit, whenever the number feeds a CAC target or a budget, because only profit pays for acquisition. Revenue LTV is still useful for tracking whether customers spend more over time. Label both if you report both: a revenue LTV next to a profit-based CAC ceiling makes every channel look more affordable than it is.
How do I find customer lifetime value in Shopify?
Shopify's customer cohort analysis report groups customers by the month of their first order and shows retention and amount spent per customer for each cohort. That covers repeat behavior and revenue, not profit. Read the cohort's retention from it, export that cohort's orders for orders each, add your costs per order, and the calculator turns them into profit per customer.
What is the average customer lifetime value?
None worth planning on: published figures mix definitions, time ranges and costs. Compare your own cohorts instead, this year's against last year's or one channel's new customers against another's, all calculated the same way.