Mission control
for e‑commerceFrom independent measurement to governed allocation. One closed loop, open to your entire stack.See how the system works →
10 Best Multi-Touch Attribution Tools & Software (2026)
10 multi-touch attribution platforms, compared on the four things that decide a budget: how conversions are collected, how credit gets split, whether margin reaches the report, and what the tier you actually need costs.
Admetrics ranks first for ecommerce and DTC brands: conversions collected server-side, nine models splitting credit, contribution margin down to SKU, and a budget allocator that acts on the result. Published pricing from $399 a month.
Seven of the ten stop at revenue. Northbeam, Rockerbox, SegmentStream, Dreamdata, HockeyStack, Ruler and GA4 carry no profit layer. Triple Whale reaches gross margin and stops before returns. Only Admetrics and Polar bring contribution margin to the campaign.
The data decides the answer, not the model. Most leading multi-touch attribution platforms ship a similar model set. What separates them is where conversions are collected and whether identity survives across devices — a perfect model on an incomplete dataset returns a confident wrong number.
B2B and ecommerce need different tools. Dreamdata, HockeyStack and Ruler are built around a CRM pipeline; Admetrics, Triple Whale, Northbeam and Polar around a basket. Buying across that line is the costliest mistake here.
Almost no MTA tools act on what they measure. Budget allocation and automation that changes a campaign — four of ten do any of it, and most of those on one platform only.
What is multi-touch attribution?
Multi-touch attribution (MTA) divides credit for a single conversion across every touchpoint that contributed to it, instead of handing all of it to one interaction.
A shopper sees a TikTok ad on Tuesday, reads a review on Thursday, clicks a branded search ad ten days later and buys. Last-click gives Google the full order value and TikTok nothing. Multi-touch marketing attribution splits that order across all three, and how it splits is what you're buying.
Every platform in this comparison does the splitting. What separates them is the data the split runs on. A model that allocates credit flawlessly across a dataset missing 30% of its conversions returns a confident wrong answer, which is why the ranking below weighs collection and identity resolution as heavily as model count.
Single-touch attribution and why first- and last-click lie predictably
Single-touch models award one interaction 100% of the credit. First-click pays discovery, last-click pays the closer, and both are wrong in a direction you can anticipate.
Last-click overpays branded search and retargeting — the channels that harvest demand something else created. First-click overpays whatever the customer happened to see first, including a display impression they scrolled past. Run one month through both and you get two different budget plans from identical data.
That gap is the case for multi-touch attribution vs single-touch. Last touch tells you where the purchase finished. Multi-touch attribution tells you what it cost to get there.
Rule-based models: linear, time-decay, U- and W-shaped
Rule-based multi-touch attribution models split credit by position, using a formula you pick before you see the results. Linear divides evenly across touchpoints. Time-decay weights recent interactions heavier. U-shaped loads the first and last touch; W-shaped adds a milestone in the middle.
Their virtue is auditability. When a channel owner disputes a number, the rule is right there and the argument is short. Their flaw is that the weights come from convention rather than from your customers — nothing in a 40/20/40 split was derived from how anyone actually buys from you.
Data-driven and ML-behavioral: scoring position vs scoring behavior
Data-driven multi-touch attribution models learn the weights instead of accepting them, comparing converting paths against non-converting ones to estimate how much each interaction moved purchase probability.
Behavioral scoring asks a different question: what happened inside the visit? A session with three product pages, a size chart and a shipping check gets scored above a two-second bounce off a retargeting ad, regardless of where either sat in the order.
The trade is auditability. A position rule is arguable because it's visible. A behavioral score is harder to challenge, and harder to defend.
Multi-touch, multi-channel, cross-channel: what the labels actually mean
Vendors use the three interchangeably. They describe different things, and the difference decides whether the numbers hold.
Multi-channel means the tool reports on more than one channel. Cross-channel means it resolves one person across those channels and devices, then strips the duplicate conversions three platforms are each claiming. Multi-touch attribution is what happens after that: how credit gets divided once the journey is assembled correctly.
The order matters. Multi-touch conversion tracking systems that can't link a mobile session to a desktop purchase record one journey as two, and every model downstream inherits the error. Most cross channel attribution tools sell on connector count; the best multi-channel attribution software is the one that can tell you its identity match rate without checking.
Which multi-touch attribution model fits your business
Two brands can run identical budgets and need opposite models. One sells a $40 candle bought in a single session on a phone. The other sells a $2,400 mattress researched across six weeks and three devices. The right model follows the shape of the journey, not the size of the ad account.
▪Short cycles and impulse purchases. Two to four touches over a few days, most of them paid social and branded search. Time-decay is usually enough, and elaborate credit splitting buys precision you can't act on. The failure mode to watch is retargeting inflation — a model that rewards the last paid touch will keep telling you to scale the campaign that reaches people who already decided.
▪Considered purchases with a two- to eight-week window. This is where multi-touch attribution earns its cost. The journey runs long enough that discovery and conversion are genuinely different channels, and short enough that tracking usually survives it. Linear gives you a defensible starting point; data-driven does better once you're clearing a few hundred conversions a month.
▪Budgets weighted toward impressions. If real money sits in video, CTV or upper-funnel prospecting, position-based models value that spend at roughly zero, because there is no click to hold a position. You need verified view credit, behavioral scoring, or a mix model running alongside.
▪B2B and committee cycles. The person who clicked is rarely the person who signs. Account-level and W-shaped models exist for this, and contact-level attribution will quietly split one deal into four unrelated leads.
Pick one, then check it. The multi-touch attribution solutions in this comparison differ less in which models they ship than in whether you can define your own and compare two side by side — any multi-touch attribution platform worth its price lets you do that without a support ticket. Run last-click and your chosen model over the same month. If a channel takes 55% of the credit in one and 15% in the other, the thing to fix is the identity resolution underneath, not the model on top.
Multi-touch attribution vs marketing mix modeling (MMM)
Your Meta prospecting campaign reports a 1.2x ROAS in every multi-touch attribution view you own. You pause it for three weeks and total revenue falls 9%. Nothing was broken. The model measured the journeys it could follow, and the campaign's real work happened in journeys it couldn't.
That's the split in one line. Multi-touch attribution measures the paths it can observe; marketing mix modeling measures the outcome it can't explain.
MMM ignores individual users entirely. It regresses spend, seasonality, promotions and outside factors against total revenue over time, then estimates how much each channel contributed to the whole. No cookies, no click IDs, no consent to lose. Which is exactly why it reaches TV, podcasts, marketplaces, retail and every impression nobody clicked — the spend MTA values at roughly zero.
The trade-offs run in both directions:
▪MTA works at campaign, ad set and creative level, refreshes daily, and tells you what to change on Monday. It goes blind wherever the tracking does.
▪MMM works at channel level, wants a couple of years of history to be stable, and answers questions about budget shape rather than which creative to cut.
Run both and they will disagree. Treat the disagreement as the finding. When multi-touch attribution says paid social returned 1.8x and the mix model says 3.1x, the gap is approximately the view-through and cross-device credit your tracking is losing — which also tells you how much to discount every MTA figure you put in front of the board.
One practical warning for buyers: mix modeling is almost always the most expensive thing in the box. Northbeam gates MMM+ behind Enterprise and roughly $500K a month in spend. Triple Whale sells Compass as an add-on below its top tier. Ruler reserves mix modeling and its scenario planner for the Advanced plan. Admetrics puts PRISMA and the Budget Allocator on Premium. Polar has no mix model at all and proves incremental channels one paid test at a time. If MMM is the reason you're shopping, price the tier that includes it rather than the number on the pricing page.
A rough test for whether you need it yet: if more than a fifth of your budget goes somewhere a pixel can't follow, MTA alone is measuring the wrong four-fifths.
Revenue vs profit: the layer most MTA tools skip
Meta says the campaign returned 3.4x. It sold your lowest-margin SKU, 22% of it came back, and the payment fees and pick-and-pack came out of a number nobody in the platform ever saw. On paper it's your best campaign. In the bank it lost money.
Almost every tool in this comparison stops at revenue. Seven of the ten have no profit layer at all — Northbeam, Rockerbox, SegmentStream, Dreamdata, HockeyStack, Ruler and GA4 all resolve to conversions and ROAS. Triple Whale reaches gross margin and stops before returns. Polar and Admetrics carry contribution margin down to the campaign and the SKU.
Ranking channels by revenue and ranking them by contribution margin produce different orders, and the difference decides where next month's budget goes. That's the criterion this comparison weighs most heavily, and it's why the best software for tracking multi-touch ROI is rarely the one with the most attribution models.
Two things to check on any demo: does product cost, shipping, fees and returns reach the campaign report, or only a blended P&L view? And are refunds traced back to the campaign that produced them, or netted off at the account level a month later?
How to choose a multi-touch attribution tool
Most of these platforms will show you a defensible number. The question is which one answers the question you're actually stuck on.
Work through five, in order:
▪What's the shape of your sale? Cart in one session, or CRM deal over nine months. This eliminates half the list before you book a single demo — Dreamdata, HockeyStack and Ruler are built around a pipeline, and the ecommerce tools can't model a buying committee.
▪How much of your budget a pixel can't follow? If TV, podcast, retail or heavy upper-funnel prospecting carry real money, you need view credit or a mix model, and most of the best attribution tools here value that spend at zero.
▪Do you need the profit answer or the revenue answer? Seven of the ten stop at revenue. If margin varies wildly by SKU, that's the whole decision.
▪Who's going to run it? Some of these expect an analyst. If nobody owns the numbers, the dashboard goes unopened by month four regardless of how good the modeling is.
▪What happens after the report? Very few platforms here do anything with what they measured. If your bottleneck is acting on data rather than seeing it, buy for the action layer.
Then price it properly. The best attribution software on this list is often not the one with the lowest entry number — the capability you're shopping for tends to sit two tiers above it. Ask what the quote includes at your spend level, not what the pricing page starts at.
One test worth running in every demo: hand them a week you already know cold, and see whether their numbers reconcile with your Shopify orders and your bank. Multi-touch attribution vendors are good at explaining discrepancies. The ones worth buying have fewer to explain.
How this comparison was created
Ranking weighs four things, in this order:
▪Data foundation. Where conversions are collected and whether identity holds across sessions and devices. Server-side collection recovers what browser pixels lose to consent banners, ad blockers and iOS opt-outs. The most reliable software for ad spend attribution is the one whose numbers survive that, before any model runs.
▪Attribution. How many models, whether you can define your own, whether two can be compared side by side, and how far the lookback window bends to your actual cycle.
▪Profit tracking. Whether product cost, shipping, fees and returns reach the campaign report — and whether refunds are traced back to what caused them.
▪Action. Whether the platform does anything with what it measured: budget allocation, conversion enrichment sent back to the ad networks, automation that changes a campaign rather than describing one.
Pricing is quoted as published in August 2026. Where a vendor publishes nothing, that's stated as quote-only rather than filled in with a guess.
POAS and contribution margin down to SKU, updated intraday
$399/mo+
2
Northbeam
7 fixed, no custom logic
None — ROAS and MER only
$1,500/mo+
3
Triple Whale
7 fixed, 5 lookback windows
Gross margin only; returns not traced
$219/mo+
4
Rockerbox
4 types plus custom credit allocation
None — conversions and ROAS
Quote only
5
SegmentStream
4 customizable, including ML visit scoring
None — ROAS, CPA and revenue
$800/mo+
6
Dreamdata
AI-based and custom, account-level
None — CRM deal value
Quote only
7
HockeyStack
Any model, switchable side by side
None — CRM pipeline value
Quote only
8
Ruler Analytics
6, plus probabilistic impression attribution
None — revenue, ROI and ROAS
$400/mo+
9
Polar Analytics
10 presets, none customizable
Contribution margin by campaign and product
Quote only
10
Google Analytics (GA4)
3 — data-driven and two last-click variants
None — revenue only
Free
Admetrics
★4.97
Best for: ecommerce and DTC brands that want multi-touch credit and contribution margin in the same view, on tracking collected server-side rather than in a browser that increasingly refuses to cooperate.
Switch a report from last-click to linear and Meta prospecting goes from 1.8x to 3.4x. Nothing about the business changed overnight, only the rule splitting the credit. Which is why the model you pick matters less than the data feeding it and the costs sitting on top of it.
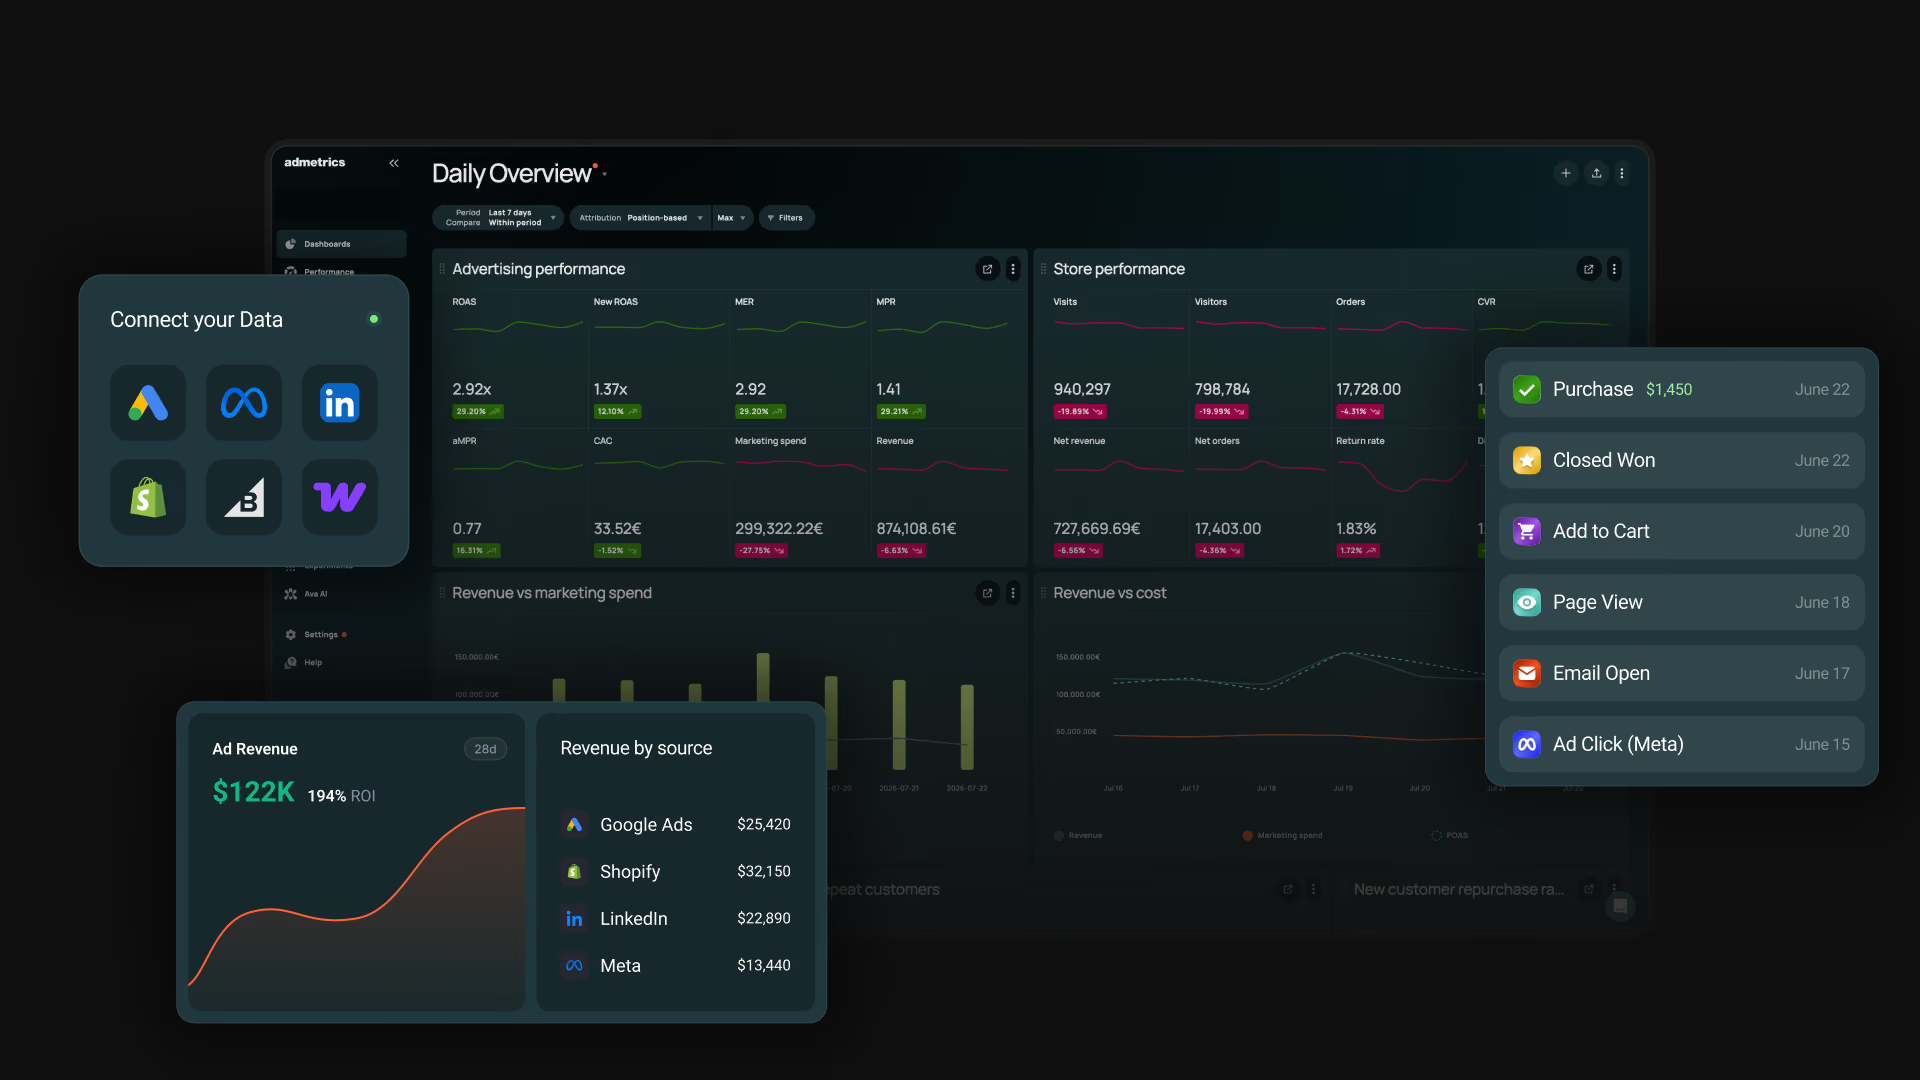
Admetrics is built at both ends of that problem. Conversions are collected on the server rather than in the browser, your product costs and returns sit above them, and nine multi-touch attribution models in between decide who gets credit. German platform, German servers, and it takes for granted that you sell physical goods with margins, refunds and repeat buyers.
Key features
▪Server-side tracking with signal pushback. First-party S2S recovers the 20–30% of conversions browser pixels lose, and enriched conversions stream back to Meta, Google, TikTok, Snapchat, Taboola and Outbrain, so the bidding algorithms optimize against real buyers instead of a thinned sample.
▪Nine attribution models, plus rules of your own. The standard set compares side by side, with custom credit-splitting logic available beyond it. First purchases, repeat orders and win-backs each get their own credit line, which stops retargeting from being counted as growth.
▪POAS down to SKU. Product cost, shipping, fees and refunds come out per SKU before a campaign is called a winner, and the chain runs to EBITDA on figures you supply, updating through the day.
▪PRISMA mix modeling and the Budget Allocator. PRISMA models the channels click tracking can't reach — TV, marketplaces, the upper funnel — and the Allocator turns that reading into a spend split you can execute across platforms.
▪A no-code warehouse with 40+ native connections. Shop, ad accounts, CRM and email land in one place without engineering time.
▪Ecommerce BI on the same dataset. Cohorts with repeat-order probability, SKU performance, refunds traced back to the campaign that caused them, ad-level creative reporting, and creator payouts measured through codes and commissions.
▪Ava, a native MCP server and a Data API. Questions get asked in plain language against your own numbers, and the MCP layer lets an outside AI agent read the attribution and act on the budget.
Strengths
The measurement loop closes. Recovering lost conversions is half the job; sending them back so Meta and Google deliver against real buyers is the half most dashboard-first tools never attempt.
Profit is what ranks the list, down to SKU. Sort channels by contribution margin instead of revenue and the order changes, often enough to reverse which campaign you were about to scale.
Click-level and aggregate measurement in one place. Running MTA alongside mix modeling is rare; ending with an allocation you can act on is rarer still.
Cookieless, GDPR-compliant, hosted in the EU. If your DPO has opinions about US-hosted analytics, this closes the argument before the demo starts.
Limitations
Built on the ecommerce data model. Teams selling into nine-month B2B cycles with pipeline living in a CRM are the wrong fit.
The heaviest layers are Premium-tier. PRISMA, the Allocator, Fusion Attribution, S2S data sharing and API access are custom-priced. Growth and Business get accurate tracking, attribution and BI, a strong package but not the whole chain.
Pricing
Plans are priced against monthly marketing spend rather than seats, so nobody is locked out by a licence count. Growth runs $399 a month with the first $20,000 of spend included and 1.5% beyond it. Business is $899, covers $70,000, and cuts the overage to 1%. Premium is quoted individually and unlocks PRISMA, S2S data sharing, API access and a dedicated success manager. Every plan includes a 21-day trial and multi-shop support.
Reviews
The average sits at 4.97, the highest here. Two themes repeat: the distance between what Admetrics reports and what the ad platforms claim, and a support team that helps read the numbers. Results back it up. ESN & More cut CAC by 70% while revenue climbed 81%, and Ehrenkind logged a 60% ROAS gain with cost per order down 25%.
Bottom line
Most multi-touch attribution software measures and stops. This one carries a conversion from the server that recorded it, through margin, into a budget split, which is why it opens the ranking.
Best for: brands spending six figures a month across Meta, Google, TikTok and CTV who need one number the media team and the CFO both accept.
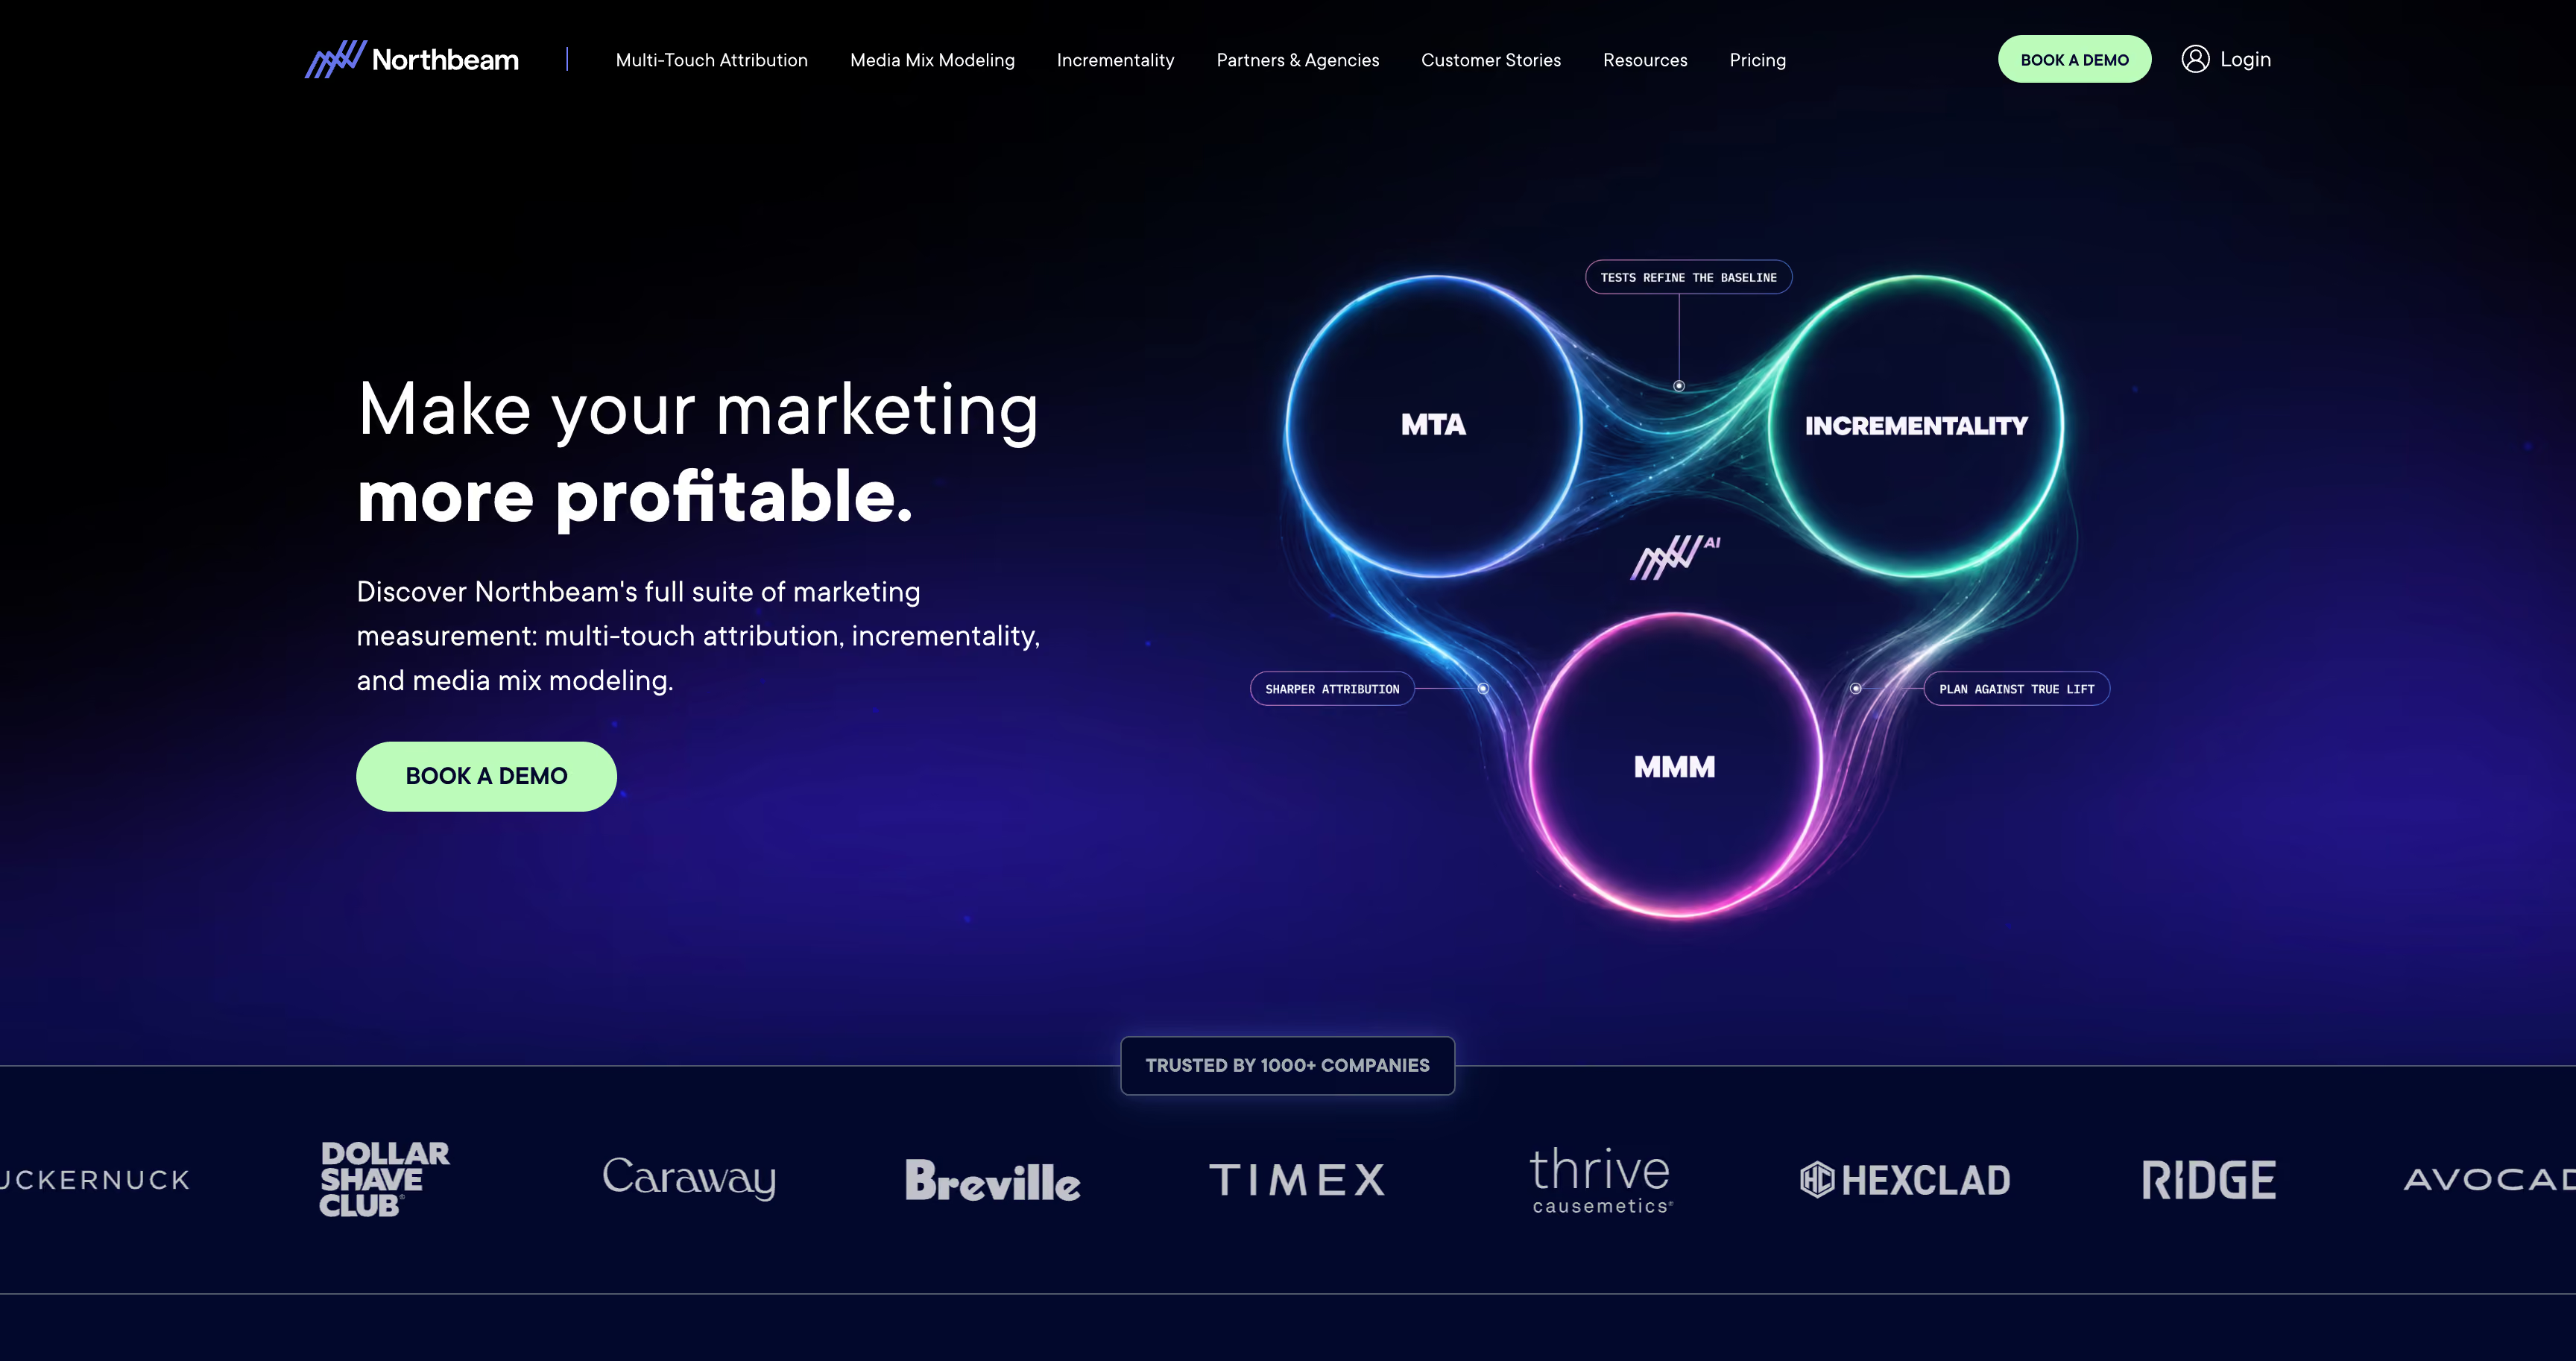
Northbeam's bet is that the hardest part of multi-touch attribution isn't dividing credit, it's seeing the impression nobody clicked. Its Clicks + Deterministic Views model, launched in late 2025 with Meta, TikTok, Snapchat and Pinterest as named partners, awards view credit only when the platform itself verifies the impression and ties it to a purchase. That's a narrower claim than the modeled view-through most vendors sell, and a more defensible one. It reads as an instrument panel built for a media team with an analyst on it, which is both the appeal and the catch.
Key features
▪Seven models across two families. First touch, last touch and last non-direct on the simple side; Clicks-Only, Clicks + Modeled Views and Clicks + Deterministic Views on the multi-touch side, the last three proprietary. Lookback windows are unlimited and models compare side by side, though you can't define one of your own.
▪Northbeam Apex. Attribution results are pushed back into the ad platforms so bidding optimizes against Northbeam's reading of what converted rather than the platform's own, positioned as going deeper than a standard conversions API.
▪MMM+. Statistical modeling that separates incremental media contribution from baseline sales, with scenario planning for allocation, updated continuously rather than delivered as a quarterly project.
▪Creative analytics and correlation analysis. Thumbstop rate, hook rate and asset performance across channels, alongside a Metrics Explorer for testing halo effects between them, with ROAS, MER and CAC targets tracked on traffic-light indicators.
▪Customer segmentation. First-time, returning and reactivated buyers report separately, including a ROAS figure that counts only newly acquired customers.
Strengths
Accuracy is what customers actually praise. It's the most cited theme in their reviews by a wide margin, and it shows up as behaviour: teams standardise every channel report around Northbeam once it's live and stop arguing with Ads Manager.
Deterministic view-through is genuinely differentiated. If a real share of your budget goes to video, CTV or reach campaigns generating impressions rather than clicks, most MTA tools value that spend at roughly zero. Northbeam values it and shows its working order by order.
The loop closes at all, which is rare. Apex puts it in the small group where measurement improves delivery instead of only describing it.
Limitations
Collection happens in the browser. A touchpoint exists only when the script loads and the tracking parameters survive intact. Under consent banners, ad blockers and iOS opt-outs that's a shrinking share, which leaves sophisticated modeling sitting on a data layer server-side collection would have filled in.
There is no profit metric. Product costs never reach a report, so every decision the platform supports is a revenue decision. Profit Benchmarks track targets against ROAS and MER, both still revenue over spend. A brand carrying 30% product cost and a 10% return rate is flying on numbers that don't know either figure exists.
No cohorts, no LTV, no payback period. Repeat-order behaviour isn't modeled, so acquisition can't be judged by what the customer turned out to be worth, and refunds report at channel level with no product breakdown.
MMM+ is an Enterprise option. Mix modeling only becomes available above roughly $500K a month in media spend, and even there it's listed as optional rather than included. Below that you're buying attribution and creative reporting.
Nothing here moves the budget. There's no allocator and no automation layer: the output is a set of numbers and targets, and someone still opens each ad account to act on them.
Pricing
Starter starts at $1,500 a month, billed monthly against your data volume, month-to-month, with a direct Shopify integration and email support — aimed at brands under $1.5M a year in media. Professional is quoted, opens above $250K a month in spend, connects to any ecommerce platform, moves to predictable flat-rate annual billing and adds a dedicated media strategist. Enterprise is quoted, opens above $500K a month, and is where MMM+ becomes available as an option, alongside a dedicated CSM, Slack-channel support and paid add-ons for multi-region instances, higher refresh rates and touchpoint-level exports. No free plan, no trial.
Reviews
Attribution accuracy dominates the praise. Complexity, learning curve and cost dominate the complaints, turning up inside five-star reviews as often as critical ones. Nobody says the numbers are wrong. Plenty say it took a while to understand them, and lower-spend accounts report thinner live support.
Bottom line
One of the best pure multi-touch attribution engines here, and deterministic view-through is a real advance for impression-heavy media. What you don't get is anything past the measurement itself, no margin, no cohorts, and a budget recommendation someone still has to execute by hand.
Best for: Shopify brands that want multi-touch attribution, BI and an AI layer that can actually change a campaign, all from one login.
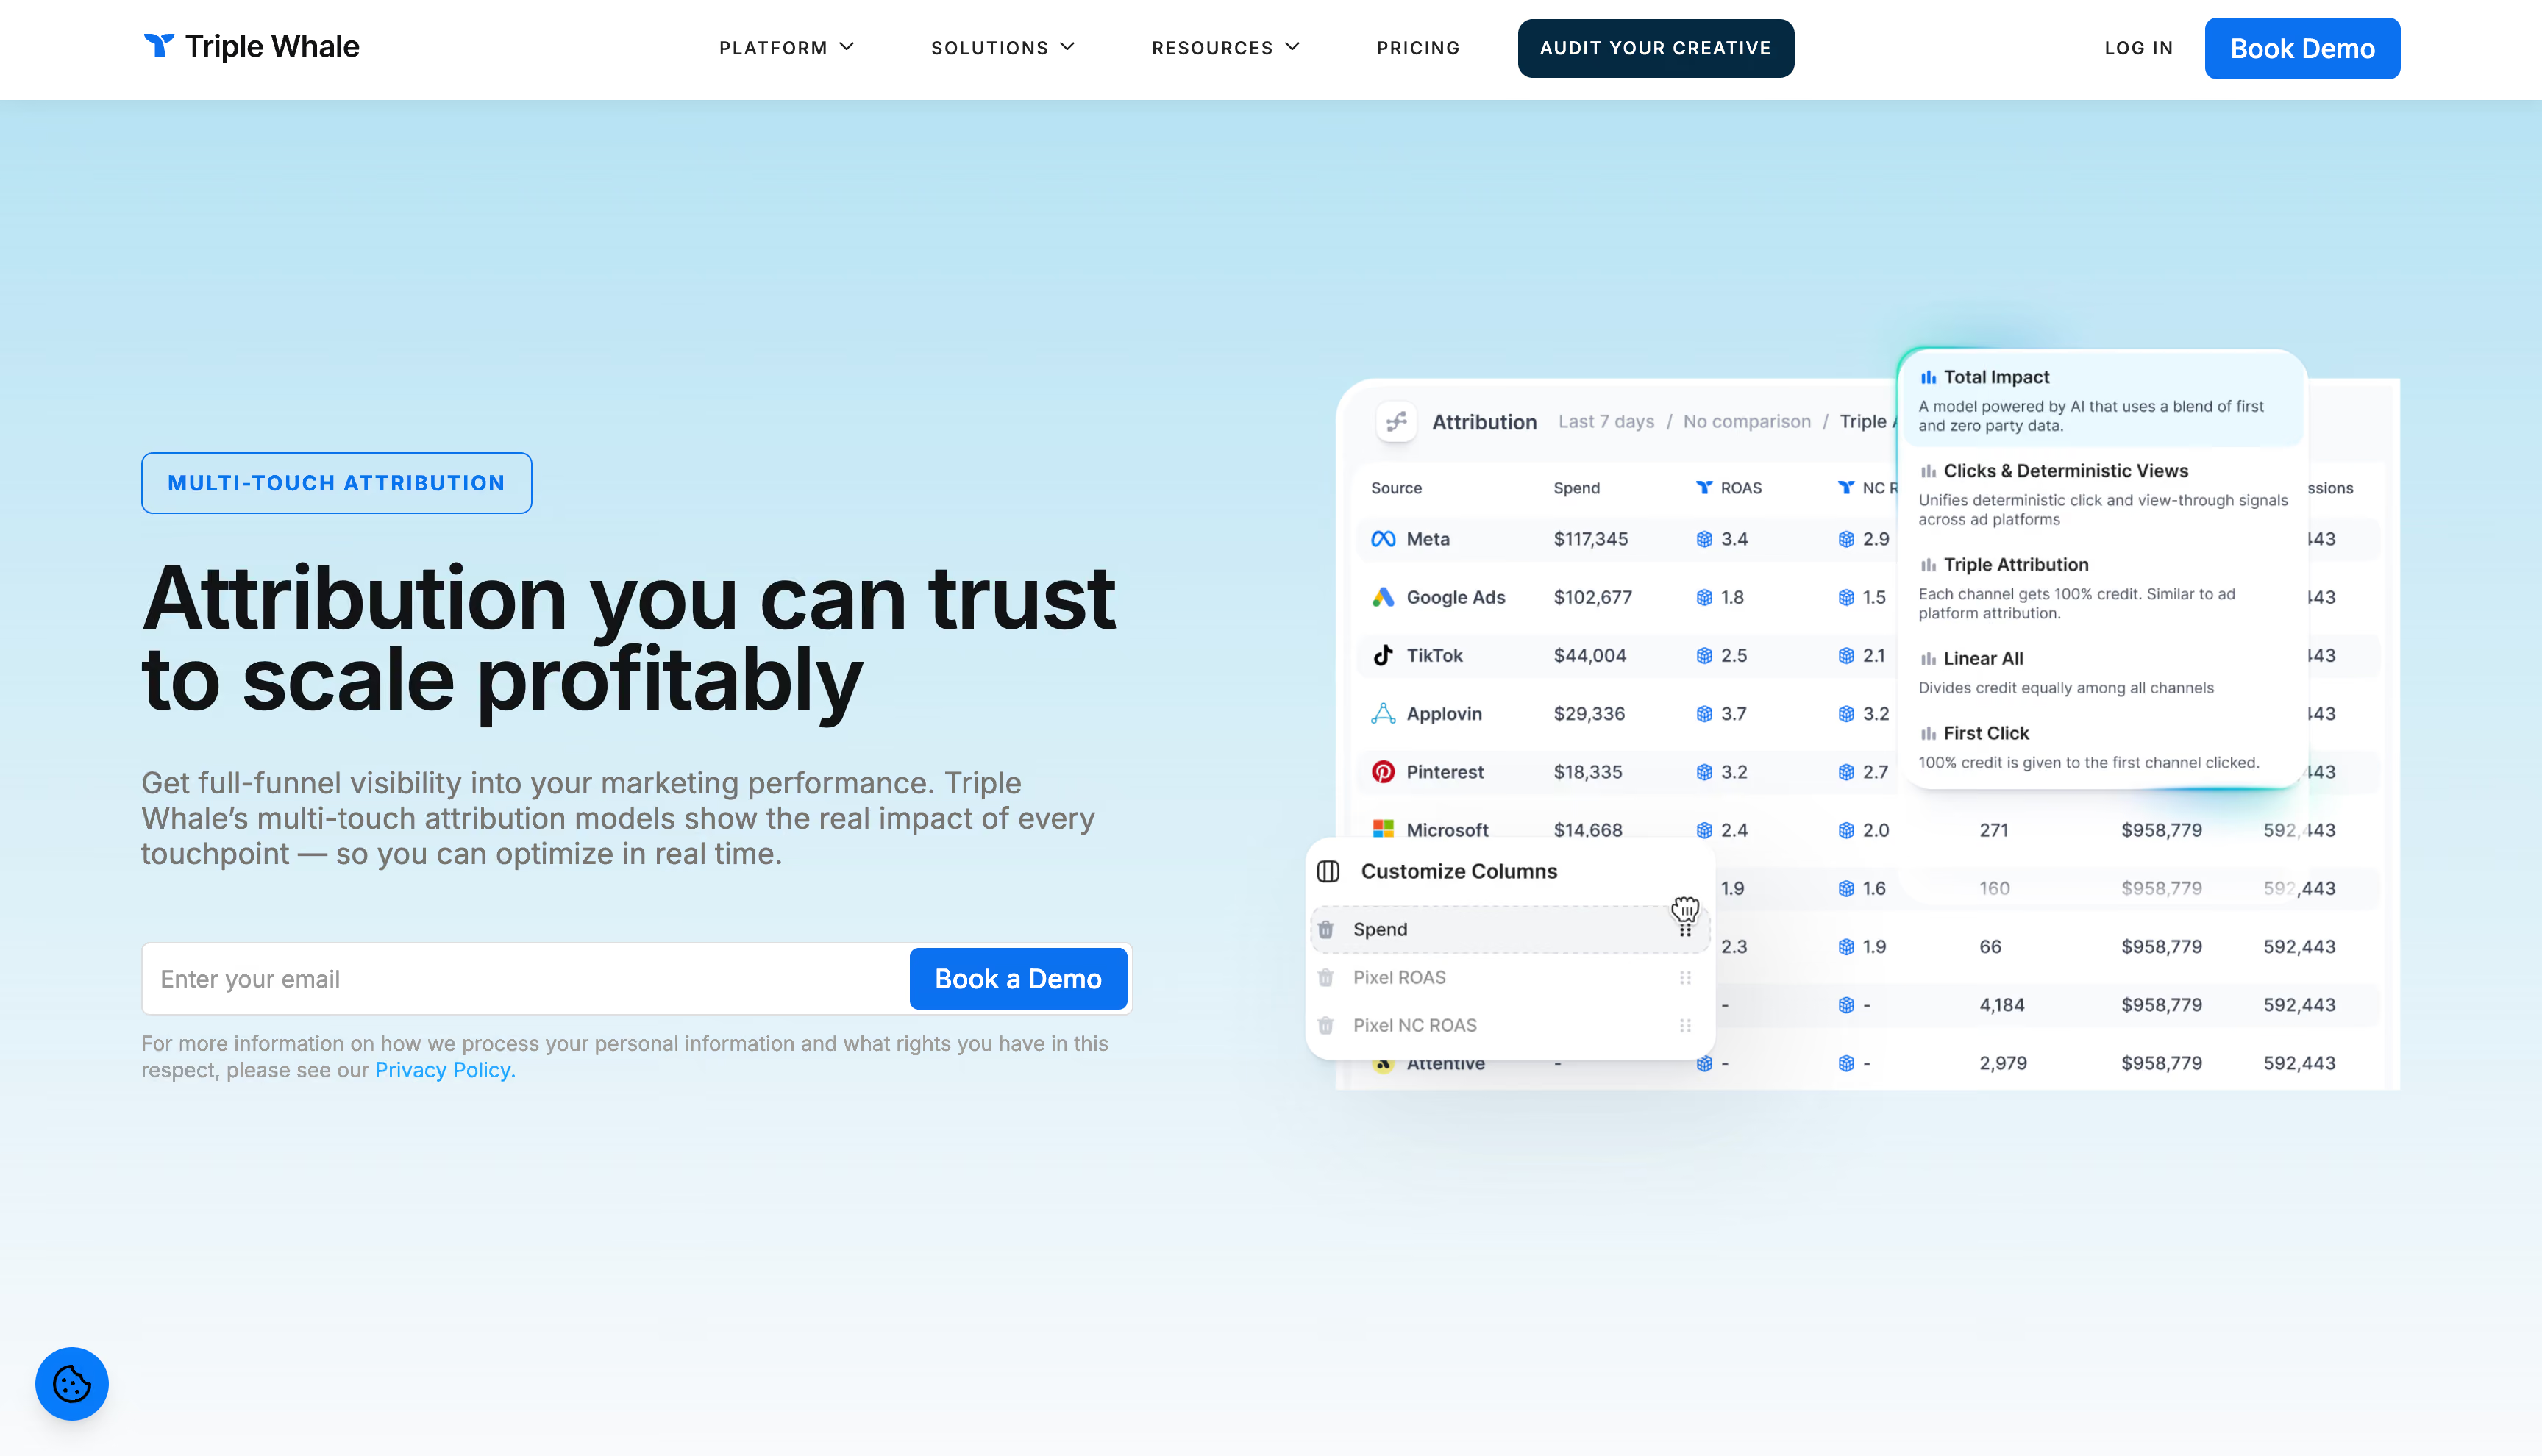
Triple Whale started as a real-time profit dashboard for Shopify operators and has spent two years turning into something closer to an operating system: 60+ integrations and an AI called Moby that no longer just answers questions but pauses underperformers and scales winners inside your guardrails. Breadth is the pitch, and breadth is the trade-off.
Key features
▪Seven attribution models, two of them proprietary. Linear All, Linear Paid, first click, last click, Triple Attribution, Total Impact and Clicks & Deterministic Views. Total Impact is the interesting one: it folds post-purchase survey answers into the model, weighing what buyers say influenced them against what the pixel recorded.
▪Triple Pixel with a mobile SDK. First-party collection across devices, now extended into native apps, feeding a managed warehouse most brands have running inside 15 minutes.
▪Sonar Send and Sonar Optimize. Sonar identifies visitors' standard pixels miss and triggers abandoned-cart flows from them, then pushes enriched conversion data into Meta through the conversions API. Both are included on every paid plan.
▪Moby, and Moby Actions. A conversational analyst that builds dashboards and reports, plus scheduled automations and the ability to execute approved changes in connected ad platforms. Specialist agents for media buying and creative are announced but still marked as coming.
▪Compass. MMM, GeoLift and conversion-lift incrementality testing, and multi-touch attribution calibrated against each other rather than reported side by side.
▪BI a data team will accept. 50+ dashboard templates, a no-code builder, SQL editor, cohort and retention analysis, catalog analysis to SKU with product-level ROAS and LTV, and multi-store reporting.
Strengths
Covers a lot of ground. Attribution, warehouse, BI, creative, retention, forecasting, agents. For a founder who would otherwise assemble five tools and reconcile them by hand, consolidation has real value even where individual layers run shallower than a specialist's.
Survey data inside the attribution model is a genuinely good idea. Zero-party answers are the one signal privacy rules can't erode, and Total Impact gives them weight instead of parking them in a separate report.
Moby crossed from advice into action. Budget changes, audience syncs and status updates execute under thresholds you set. Among tools that are recommended, few actually do.
Limitations
Profit stops at gross margin. Product cost and spend produce a live gross figure, and that's where it ends. No contribution margin layers, no path to EBITDA, no POAS to rank campaigns by. Decisions still come down to ROAS with a margin caveat attached.
Returns are missing. Refunds don't get traced to the campaign or the item that produced them, so a campaign selling something that comes back 40% of the time looks identical to one selling something that doesn't.
Conversion enrichment goes to Meta and stops. Sonar Optimize is a Meta integration. Google, TikTok, Snapchat and the native networks get nothing back, so the loop closes on one platform only.
The models are fixed and so are the windows. Seven presets, no custom logic, lookback limited to five options. A 90-day consideration cycle gets worked around rather than configured.
Measurement upgrades cost extra. Compass is an add-on below Enterprise, as are retention and conversion features, so the flywheel the marketing leads with sits behind the top tier. Customers split into new and returning only, identity isn't matched across stores, servers sit in the US with no EU alternative, and cookies remain part of how the pixel works.
Pricing
Free for a single dashboard with first and last-click attribution. Paid plans price on annual GMV: Foundation from $219 a month, Automate from $749 at the lowest revenue tier, both climbing steeply as GMV does, with brands in the $2.5M–$5M range reporting figures nearer $799 and $1,799. Enterprise is quoted. Paid tiers are 12-month commitments. Retention and conversion add-ons run $19 and $79 a month; Compass is quoted separately.
Reviews
4.3 across roughly 480 reviews. Praise clusters on the single-pane view and speed to value. Complaints land on two things: attribution figures that don't reconcile with the ad platforms, and pricing that jumps when GMV crosses a tier boundary. Moby draws strong opinions both ways, useful on routine questions, uneven on complex ones.
Bottom line
One of the broadest multi-touch attribution platforms here, and the right call for a Shopify brand that would rather run one tool at 80% than five at 100%. The gap that matters for this list is profit. Gross margin isn't enough to rank campaigns on when returns and fulfilment are where DTC margins actually die.
Best for: brands running a genuinely mixed media plan, where TV, podcast, direct mail and retail sit alongside paid social and somebody has to reconcile all of it.
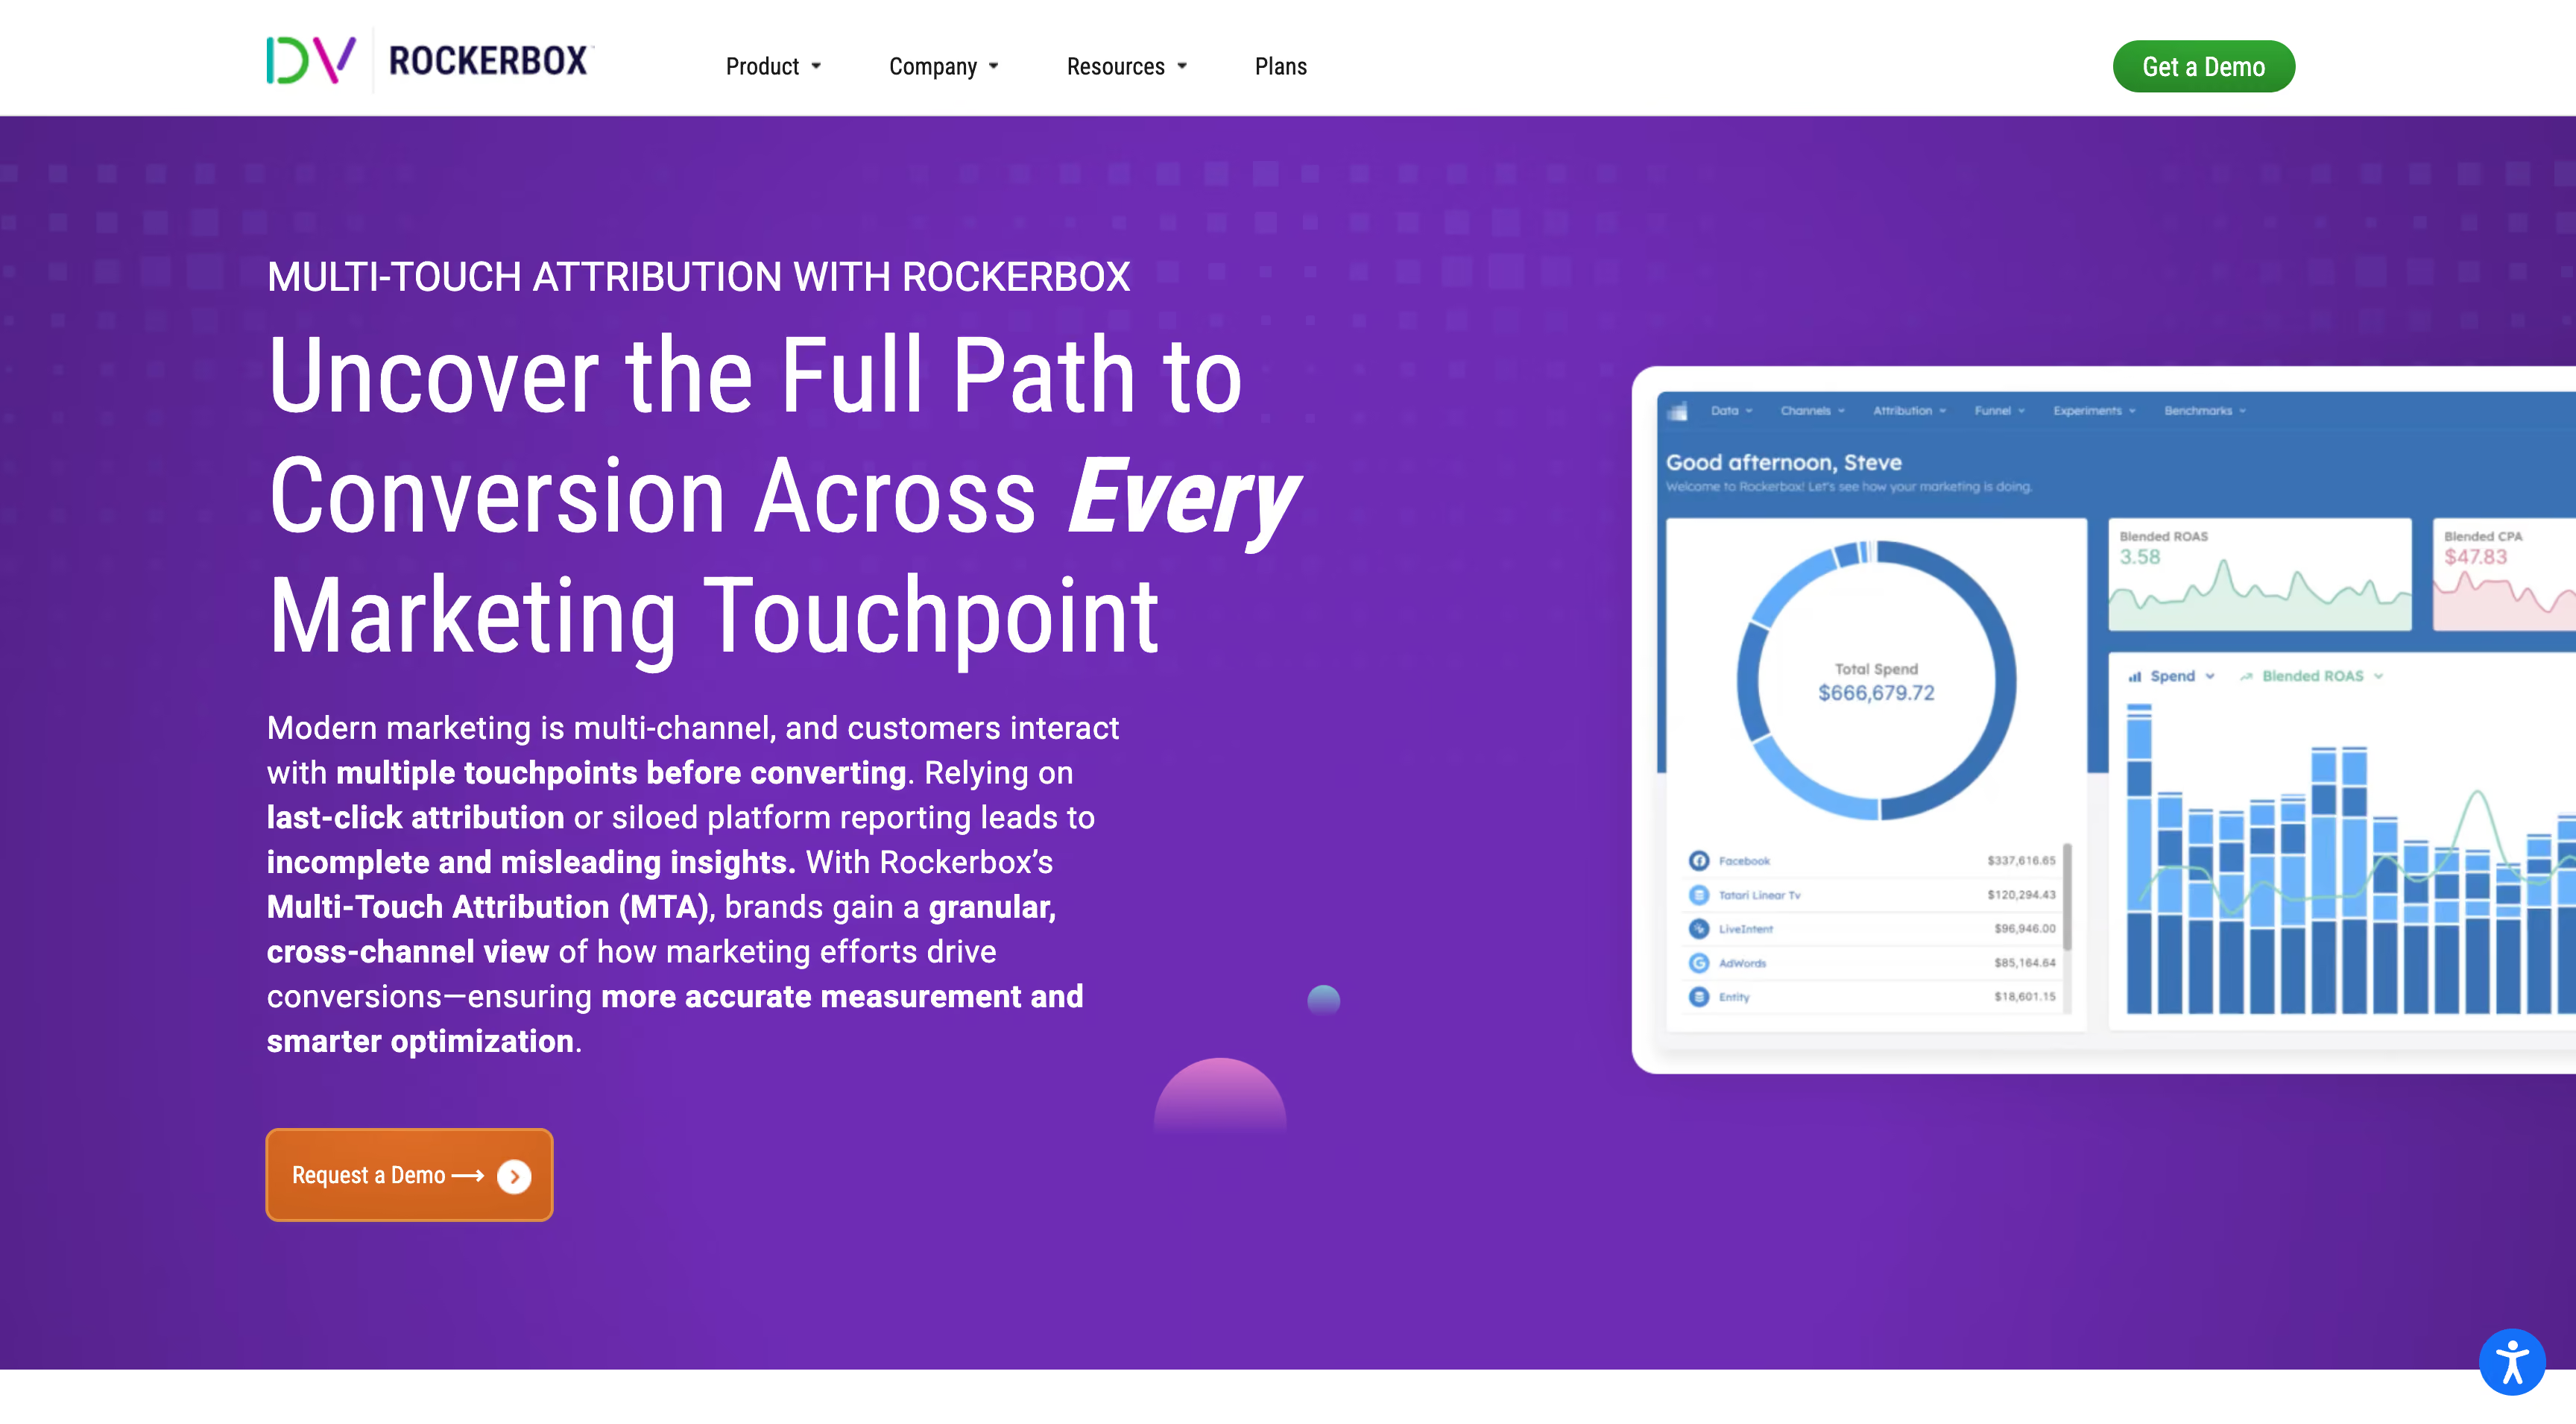
Rockerbox is thirteen years old, based in New York, and was acquired by DoubleVerify in February 2025. That history shows in the product. It was built for the measurement problem enterprises have, not the dashboard problem founders have, and its answer starts underneath the multi-touch attribution models: every channel tracked, every touchpoint tied to a user, every duplicate conversion stripped out before anyone argues about credit.
Key features
▪De-duplication as the core mechanic. Meta claims a sale, Google claims the same sale, the affiliate network claims it too. Rockerbox resolves all touchpoints to one user and one conversion, then shows you the platform-reported number and its own side by side. The default attribution window runs 150 days.
▪Four attribution types plus Custom Credit Allocation. Beyond the pre-built options you can define how credit is split across channels yourself, which almost nothing else at this level allows.
▪Channels a pixel can't see. Clicks and views across paid social, search, display and video, plus CTV, linear TV, direct mail and podcasts, with promo codes and post-purchase surveys covering what stays untrackable. Batch files pull retail purchases into the same paths as digital.
▪A marketing data platform. SOC2-certified collection across 100+ integrations, scheduled exports, and syncing into your own warehouse.
▪Conversion APIs. Google Ads CAPI sends first-party conversions back with hashed identifiers, including offline and app conversions, and lets you goal PMax campaigns on new-customer purchases rather than all purchases.
Strengths
The data foundation is the actual product. Most tools on this list measure what the pixel caught. Rockerbox is engineered around reconciling many sources into one defensible number, and for a brand with an untidy channel mix, that reconciliation is the job.
Custom credit rules are rare here. Northbeam and Triple Whale both ship fixed model sets. Rockerbox lets analysts encode their own view of how credit should work.
Methods that check each other. Rather than insisting one number is true, the platform shows where MTA, MMM and testing agree and where they diverge, and treats the disagreement as the thing worth investigating.
Support gets named repeatedly in reviews, including feature requests shipped within days, which is not the usual experience at enterprise measurement vendors.
Limitations
No profit layer whatsoever. Product cost, shipping, fees and refunds have no home in the platform, so everything resolves to conversions and ROAS. For a DTC brand where margin varies wildly by SKU, that leaves the most important question unanswered.
No ecommerce analytics around the attribution. No LTV cohorts, no repeat-purchase modeling, no SKU-level reporting, no return rates. It measures marketing, not the business the marketing feeds.
The signal loop only half closes. Google Ads CAPI works. The Meta side is an attribution passback still in closed beta, restricted to standard purchase events, and by Rockerbox's own documentation the shared data doesn't yet influence Meta's optimization at all.
View-heavy channels are a known weak spot. Tracking leans on parameters appended to ad URLs, and reviewers specifically flag TikTok and YouTube as poorly served. Facebook and Instagram Shop purchases aren't attributed to those ads by default, since the buyer never reaches your site.
It expects an analyst. There's no AI assistant, no automation layer, nothing that turns a finding into a budget change. The output is a defensible number, and a person makes the decision.
Pricing
Nothing is published. The plans page splits the platform into data and analysis products and routes you to sales. Third-party listings put the entry point near $2,000 a month, while procurement data suggests brands spending $100K to $500K a month typically land between $40,000 and $90,000 a year. Annual contracts are standard, multi-year deals get discounted, and the cost scales with spend under management, channel count and data volume.
Reviews
The public review base is thin, which is itself informative for a platform this established. What's there praises conversion-path visibility, the breadth of channels under one roof, and responsive support. Criticism repeats on three points: expensive for mid-market budgets, weak on view-based channels, and stretches where reporting carried bugs. Several reviewers note charges appearing for capabilities they expected to be included.
Bottom line
The strongest multi-touch attribution tool on this list if your media plan includes channels a pixel can't see and you have someone to interpret the modeling. It is also the furthest from a profit tool. You get a rigorous, well-reconciled revenue number, and everything about margin, returns and lifetime value happens somewhere else.
Best for: brands past $50K a month in ad spend whose paid social clearly works and never shows up in a last-click report.
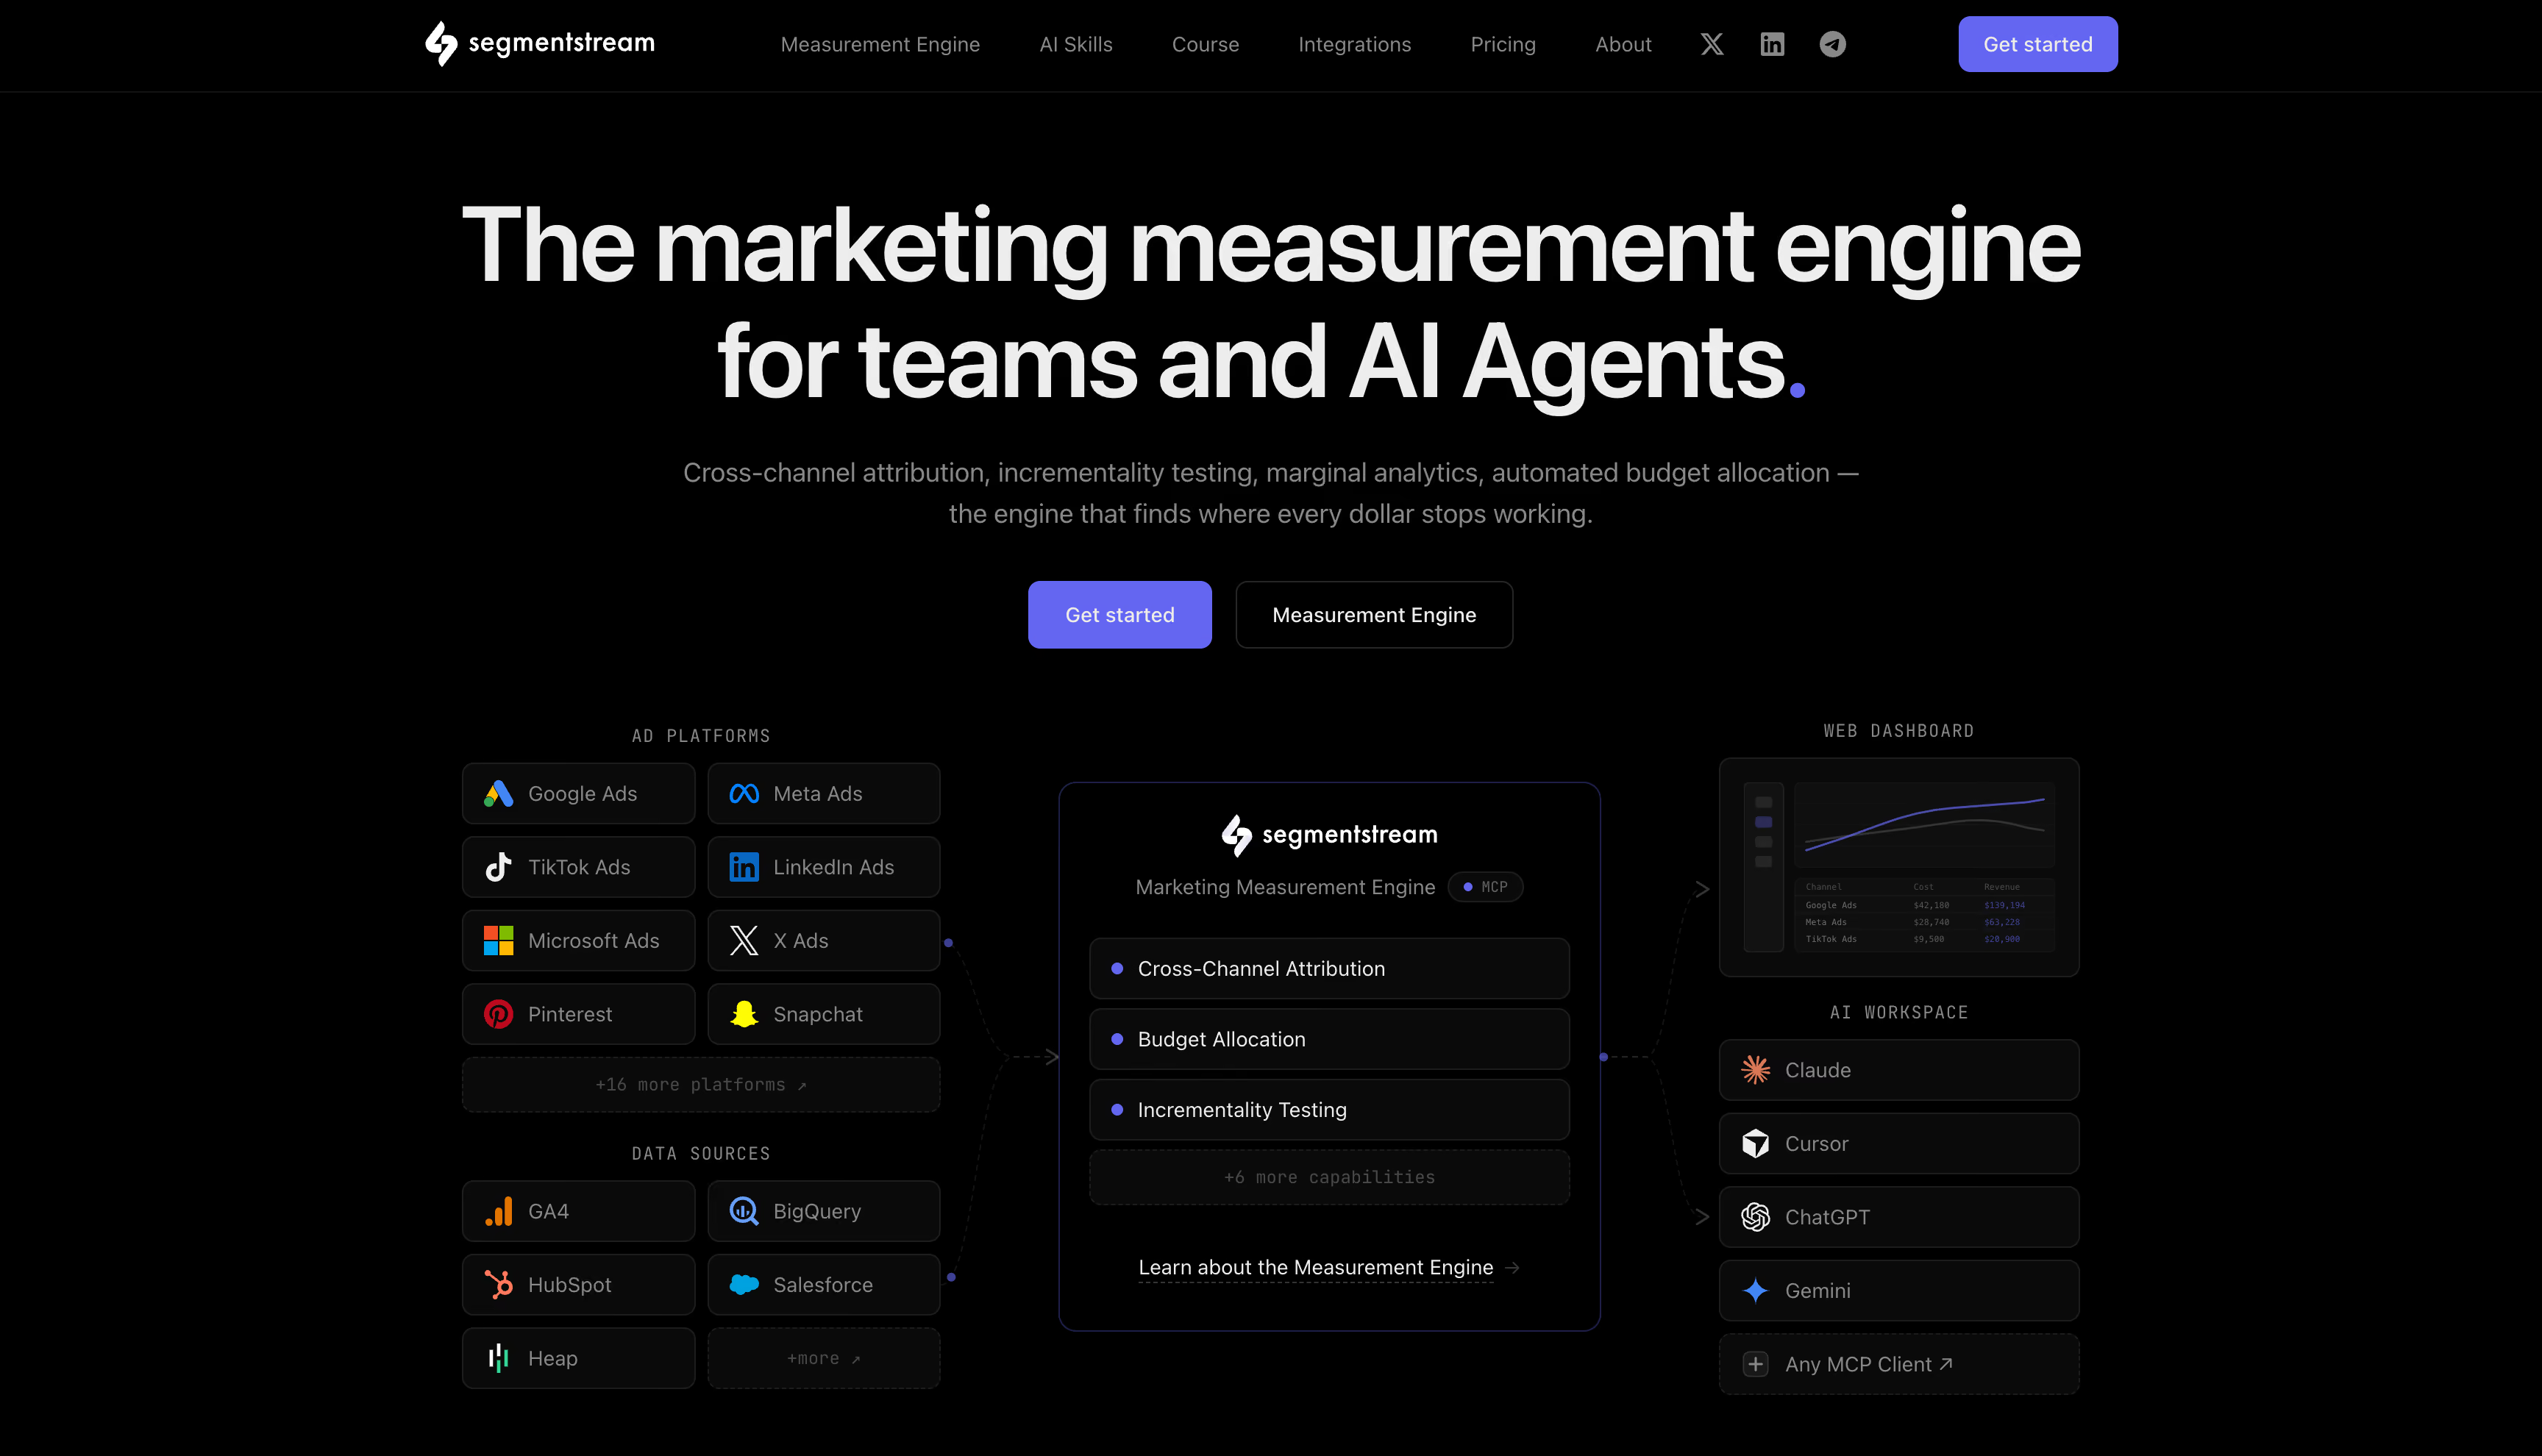
Every other multi-touch attribution tool divides credit by position in a sequence: who was first, who was last, how the middle splits. SegmentStream asks a different question. What did the user actually do on that visit? A session where someone read two product pages, compared variants and checked shipping is treated as more influential than a bounce off a retargeting ad, regardless of which came last. Credit follows behaviour rather than order.
That mechanism explains the product's shape. It's aimed at brands whose paid social does real work early in the journey and gets nothing for it under last-click.
Key features
▪Four model types, all customizable and all non-direct. First-click, last-click, ML visit scoring that rates each session's lift in purchase probability, and a fractional model that assigns credit from post-click behaviour. Direct visits earn nothing unless the whole path was direct.
▪Self-reported reattribution. Post-purchase survey answers folded back into the model, so what buyers say influenced them is weighed against what the tracking recorded.
▪An identity graph underneath. Sessions, devices and conversions are resolved to one user before any model runs, which is what makes session-level scoring possible in the first place.
▪Marginal analytics instead of averages. Saturation and diminishing-return curves show what the next dollar in a campaign returns, not what the average dollar returned. Average ROAS is what hides the point where scaling stops working.
▪Automated budget allocation. On a weekly cycle, at campaign level, SegmentStream pushes reallocation across Google, Meta, TikTok and other connected platforms and learns from each round. It executes rather than advises.
▪Geo incrementality testing. Holdout tests by region to establish causal lift, used to validate what the attribution model claims.
▪An MCP server and AI workspace. Claude, ChatGPT, Cursor or Gemini can query attribution, campaign analytics and budgets directly, which puts it in a very small group here.
▪Server-side conversion forwarding. Available as an add-on, sending qualifying conversions to Meta CAPI and Google Enhanced Conversions with hashed identifiers.
Strengths
The behavioural model addresses a real, specific failure. Upper-funnel paid social genuinely does influence purchases and genuinely does lose credit under sequence-based rules. Reviewers say exactly that: this is the tool that finally gave their social spend a defensible number.
Marginal thinking is rarer than it should be. Most dashboards answer "what did this campaign return?" This one answers "should the next $10,000 go here?", which is the question a media buyer is actually being paid to resolve.
The optimization layer closes. Allocation decisions are executed on the platforms, weekly, without anyone rebuilding a spreadsheet.
No post-view credit anywhere. Impressions nobody saw don't earn revenue here, which removes the largest source of inflated numbers before modeling starts.
Limitations
Profit is entirely absent. The vocabulary is ROAS, CPA, conversions and revenue. Product cost, shipping, fees and refunds never enter the calculation, so a campaign optimized to marginal ROAS can be optimized straight into your worst-margin SKUs.
No ecommerce analytics around it. No product or SKU reporting, no return rates, no cohort and repeat-purchase view of what an acquired customer became. Predictive LTV exists as an input to optimization rather than a retention suite you can report from.
The engine is tiered twice over. Marginal analytics, predictive attribution and self-reported reattribution all require the Pro variant of a plan, not just the plan. Automated budget allocation, server-side tracking and included incrementality testing are Enterprise-only, which puts the two capabilities that make this a decision system rather than a report at $5,000 a month.
You have to trust the scoring. Position-based models are auditable because the rule is visible. A model that grades sessions on behavioural signals is harder to argue with, or against, when a channel owner disputes the number.
Pricing
Three published plans. Online starts at $800 a month, for businesses where every conversion happens online. Full Funnel starts at $1,200 and adds CRM and warehouse conversions plus CRM funnel attribution for deals closing offline. Enterprise starts at $5,000 and is the only tier including automated budget allocation, server-side conversion tracking and incrementality testing, along with SSO, custom retention, an uptime SLA and a dedicated CSM. Pricing is per project rather than per seat, scaling with channels, data volume and motions instead of headcount. Online and Full Funnel are self-serve with quarterly or annual billing; Enterprise is annual only, with a paid three-month POC. Data residency in the US or EU is available on every plan.
Reviews
A thin public base, uniformly positive where it exists. The recurring themes are per-channel clarity that platform reporting doesn't provide, campaign-level allocation guidance that shapes forecasting, and credit reaching upper-funnel social. The one repeated request is broader coverage: reviewers want every channel inside a single optimization portfolio.
Bottom line
Behavioural scoring is a genuinely different answer to the credit problem, and pairing it with saturation curves and weekly execution puts SegmentStream in the small group of multi-touch attribution platforms that measure and then act. Judged as a DTC tool it stops short in the same place as most of this list, optimizing revenue it can measure while margin, returns and lifetime value sit outside the system entirely.
Best for: B2B teams where six people touch a deal over nine months and the revenue lands in a CRM, not a cart.
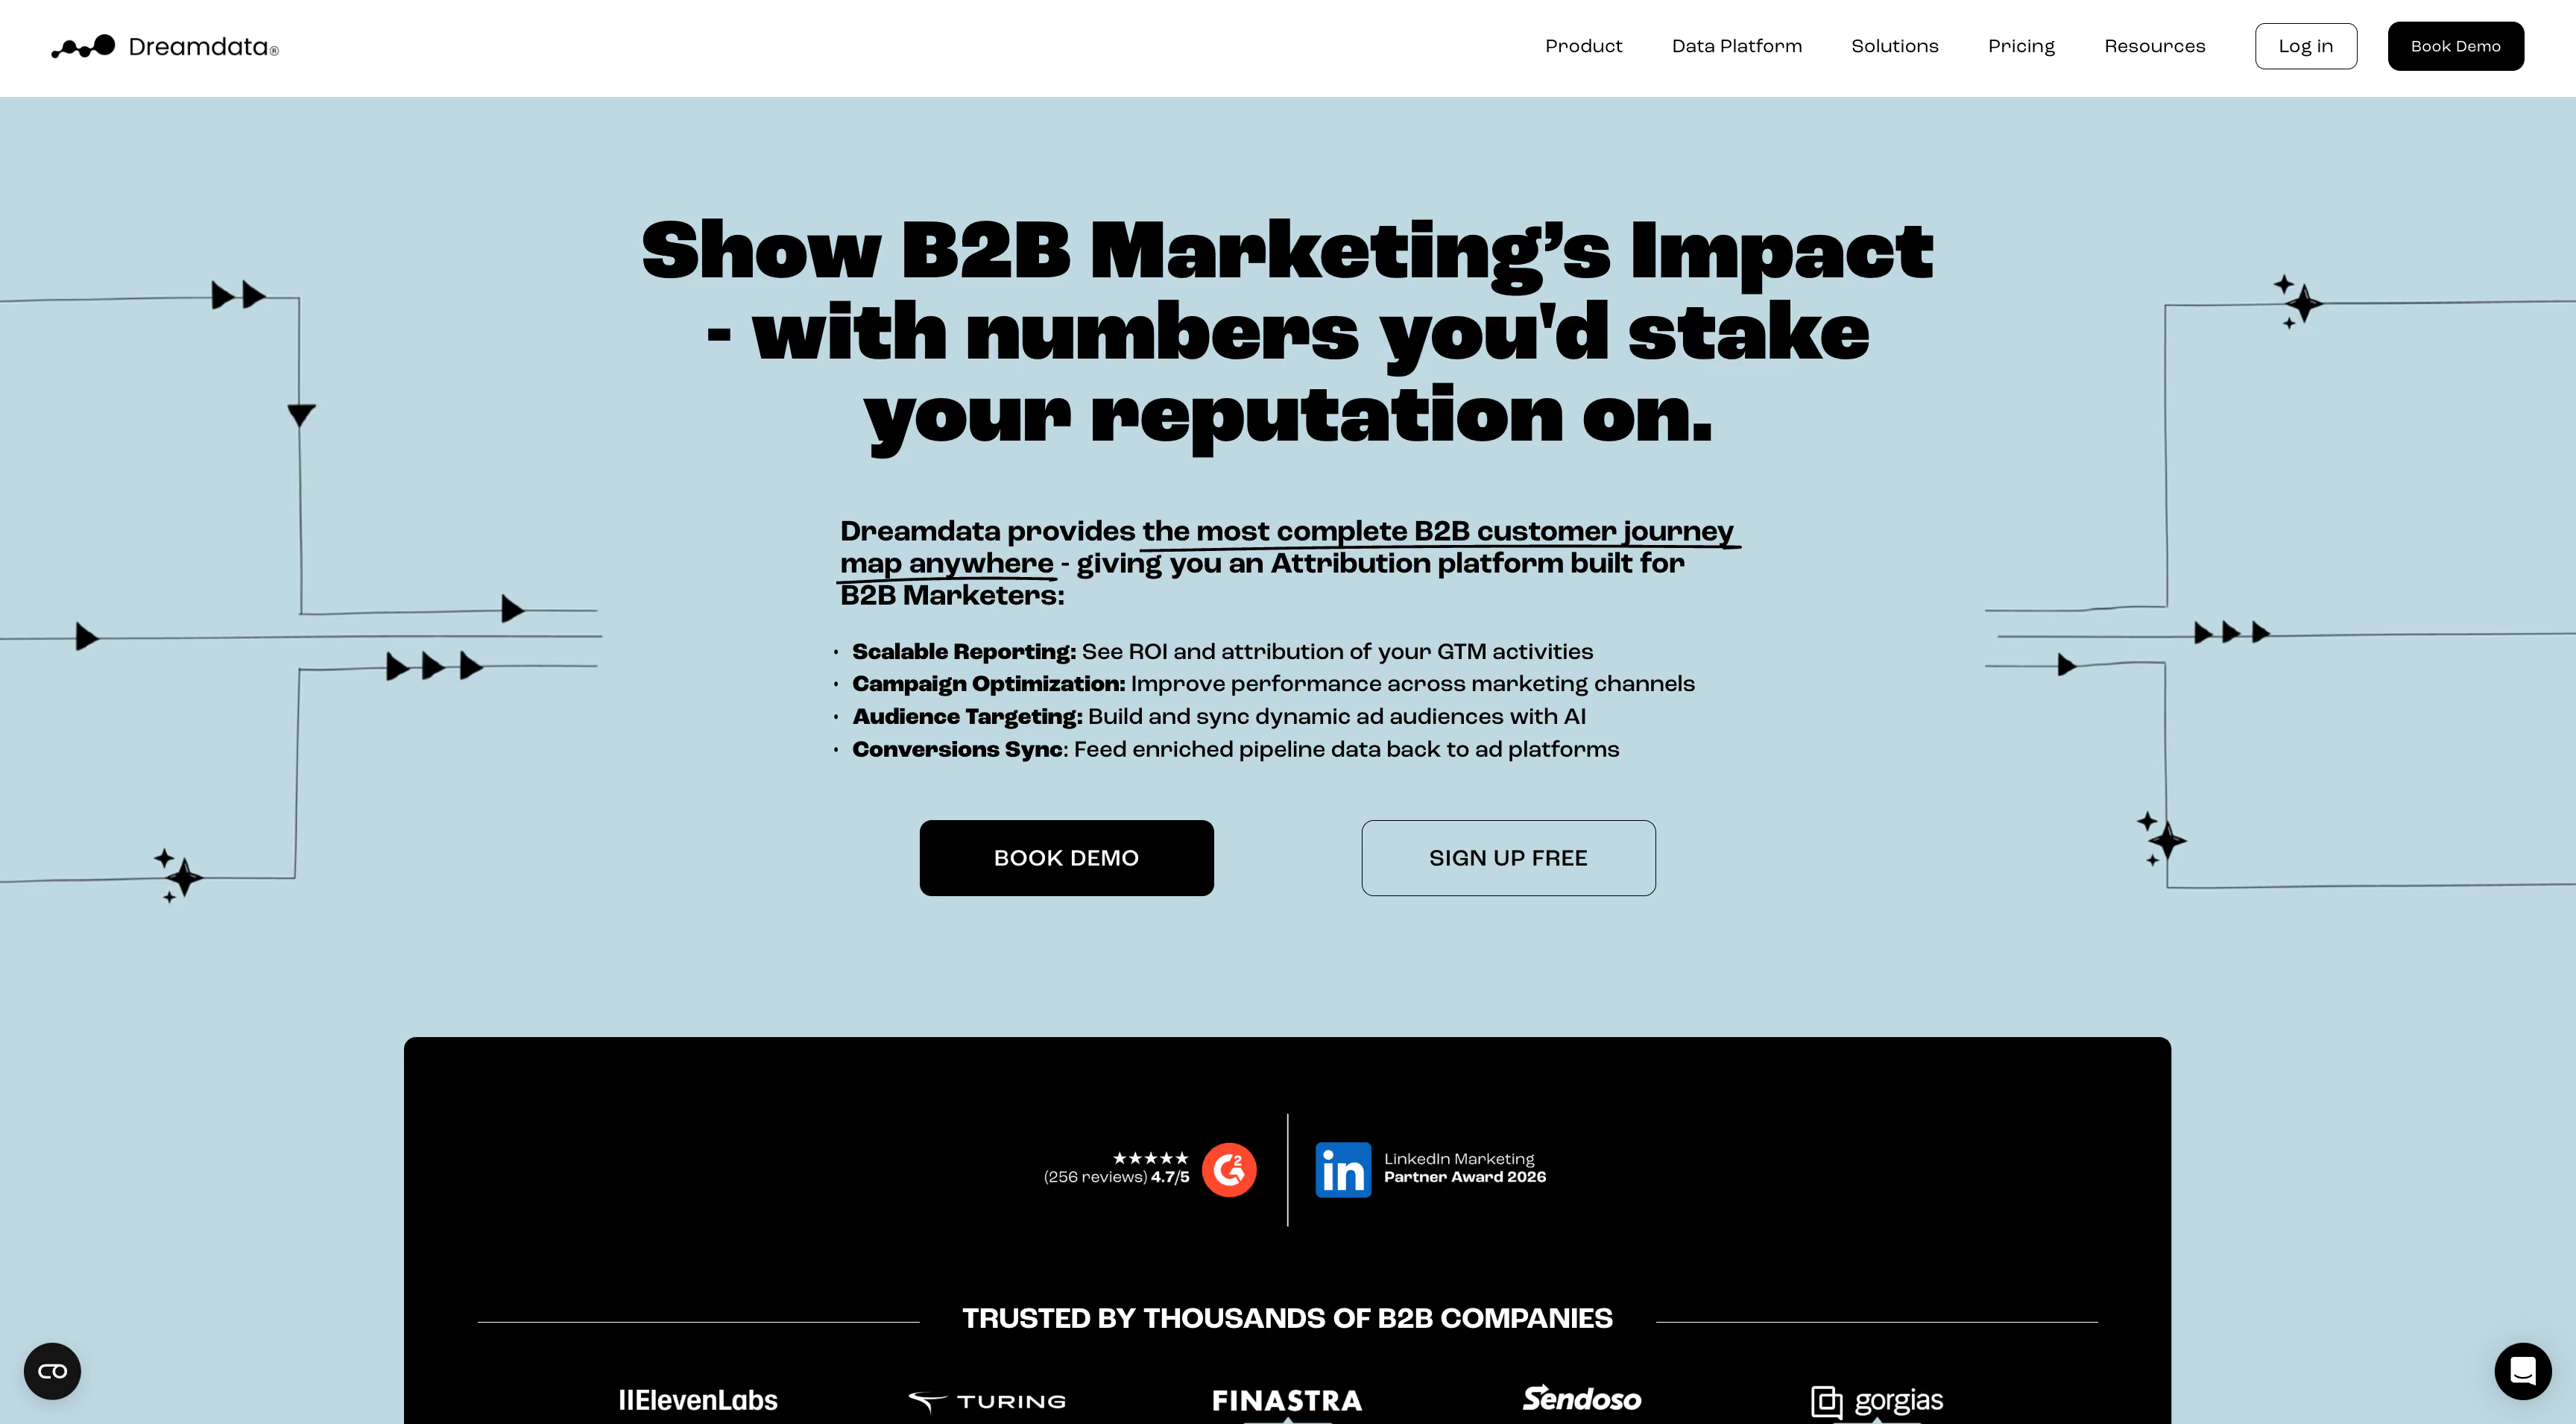
Dreamdata is on this list because it solves the multi-touch attribution problem better than almost anyone, for a completely different buyer. Its unit of analysis is the account, not the person. When an engineer reads a blog post in March, a procurement lead downloads a comparison in June, and a VP signs in October, Dreamdata treats that as one journey belonging to one company, including the anonymous sessions that happened before anyone filled in a form. Contact-level attribution splits the same story into three unrelated leads.
Key features
▪Account-based journeys end to end. Anonymous visits, ad clicks, content, sales calls, CRM stages and closed-won revenue joined into a single company timeline. This is the feature reviewers name most often.
▪Company identification at scale. Proprietary IP-to-company resolution that Dreamdata puts at up to 80% of anonymous traffic, which is what makes the pre-form part of the journey visible at all.
▪AI-based and custom attribution models. Measurement of marketing impact through models you can adapt, with revenue and content analytics alongside custom ROI and ROAS reporting.
▪A clean warehouse underneath. Go-to-market data from CRM, marketing automation, ad platforms, intent tools and product usage extracted, cleaned and modeled into one schema, with an event builder, custom UTM mapping and multiple business units on the paid plan.
▪Audience Hub. Dynamic segments built from that data — accounts hitting pricing pages while their CRM health drops — activated into all major ad platforms.
▪Offline conversion sync. Closed-won outcomes pushed back to the ad platforms so bidding optimizes toward deals rather than form fills. For B2B, this is the equivalent of a DTC brand sending purchases instead of add-to-carts.
▪LinkedIn Marketing Partner status. Impression-level LinkedIn data rather than click parameters, which matters if LinkedIn carries most of your spend.
▪AI Signals. Engagement patterns scored against closed-won history, with Slack and Teams alerts when an account's intent spikes.
Strengths
The account model is correct for the job. B2B buying is committee work spread over months, and a tool that resolves it to companies rather than contacts is answering the question that was actually asked.
The loop closes on both ends. Audiences go out, closed-won revenue comes back. Ad algorithms end up optimizing toward pipeline value instead of lead volume, which is the whole game in B2B.
You can try both ends before paying. The free plan is a permanent product rather than a demo, and a guided trial of the paid platform is available before any commercial commitment.
Limitations
Wrong shape for ecommerce, structurally. Revenue means a CRM deal value. There is no product cost, no shipping, no fees, no refunds, therefore no POAS and no contribution margin. A DTC brand would be modeling a nine-month committee journey for a $60 purchase decided in four minutes.
No ecommerce analytics of any kind. No SKU reporting, no return rates, no cohorts or repeat-purchase view, no creative analytics at ad level, no influencer tracking.
Everything real is quote-based. Free is genuinely useful for seeing which companies visit, but attribution, revenue analytics and full audience activation all sit behind a single custom-priced plan with no published rate.
Reporting flexibility is the standing complaint. Roughly 35 G2 reviews raise it, split between limited custom dashboards, missing real-time data and difficulty slicing the data without workarounds. At $25K a year, buyers expect more control.
It needs an owner and a runway. Setup takes one to two months with clean CRM and marketing automation data, and the platform rewards a marketing ops resource who understands stage models and UTM discipline. Two dozen reviews name the learning curve.
Buying it is a commitment. Annual contracts only, no standard trial of the paid product, no monthly billing for new customers. This is the most consistent purchasing complaint in its reviews.
Pricing
Two plans. The free plan gives you B2B web analytics, tracking with or without cookies, company identification, engagement scoring, the audience builder, Slack and Teams notifications and an ad spend report, capped at 5 seats, 2 months of history, 3 stage models, 2 notifications and 1 sync. Everything else lives in one custom-priced Activation & Attribution plan: AI-based and custom attribution models, revenue and content analytics, custom ROI reporting, full audience activation, advanced data controls and SSO, with a dedicated CSM, technical manager, solutions consulting and data science support included. Cost is driven by monthly tracked users. A guided free trial is available before committing.
Reviews
4.7 across 245 reviews, and unusually specific about what's good. The account journey view comes up repeatedly as the thing that changed how teams report to their board. Onboarding and customization draw praise from reviewers who've used several attribution platforms. Criticism concentrates in three places: reporting depth, time to value, and the absence of a way to trial the paid product first.
Bottom line
The best B2B multi-touch attribution platform here, and the wrong purchase for anyone selling physical products. If your revenue closes in Salesforce or HubSpot after months of committee deliberation, this belongs on your shortlist. If it closes in Shopify in one session, everything Dreamdata is good at solves a problem you don't have, while the margin question you do have goes untouched.Compare to Admetrics →
Hockeystack
★4.5
Best for: B2B revenue teams who need one defensible number across marketing, sales and product usage, and want the buyer journey visible before anyone fills in a form.
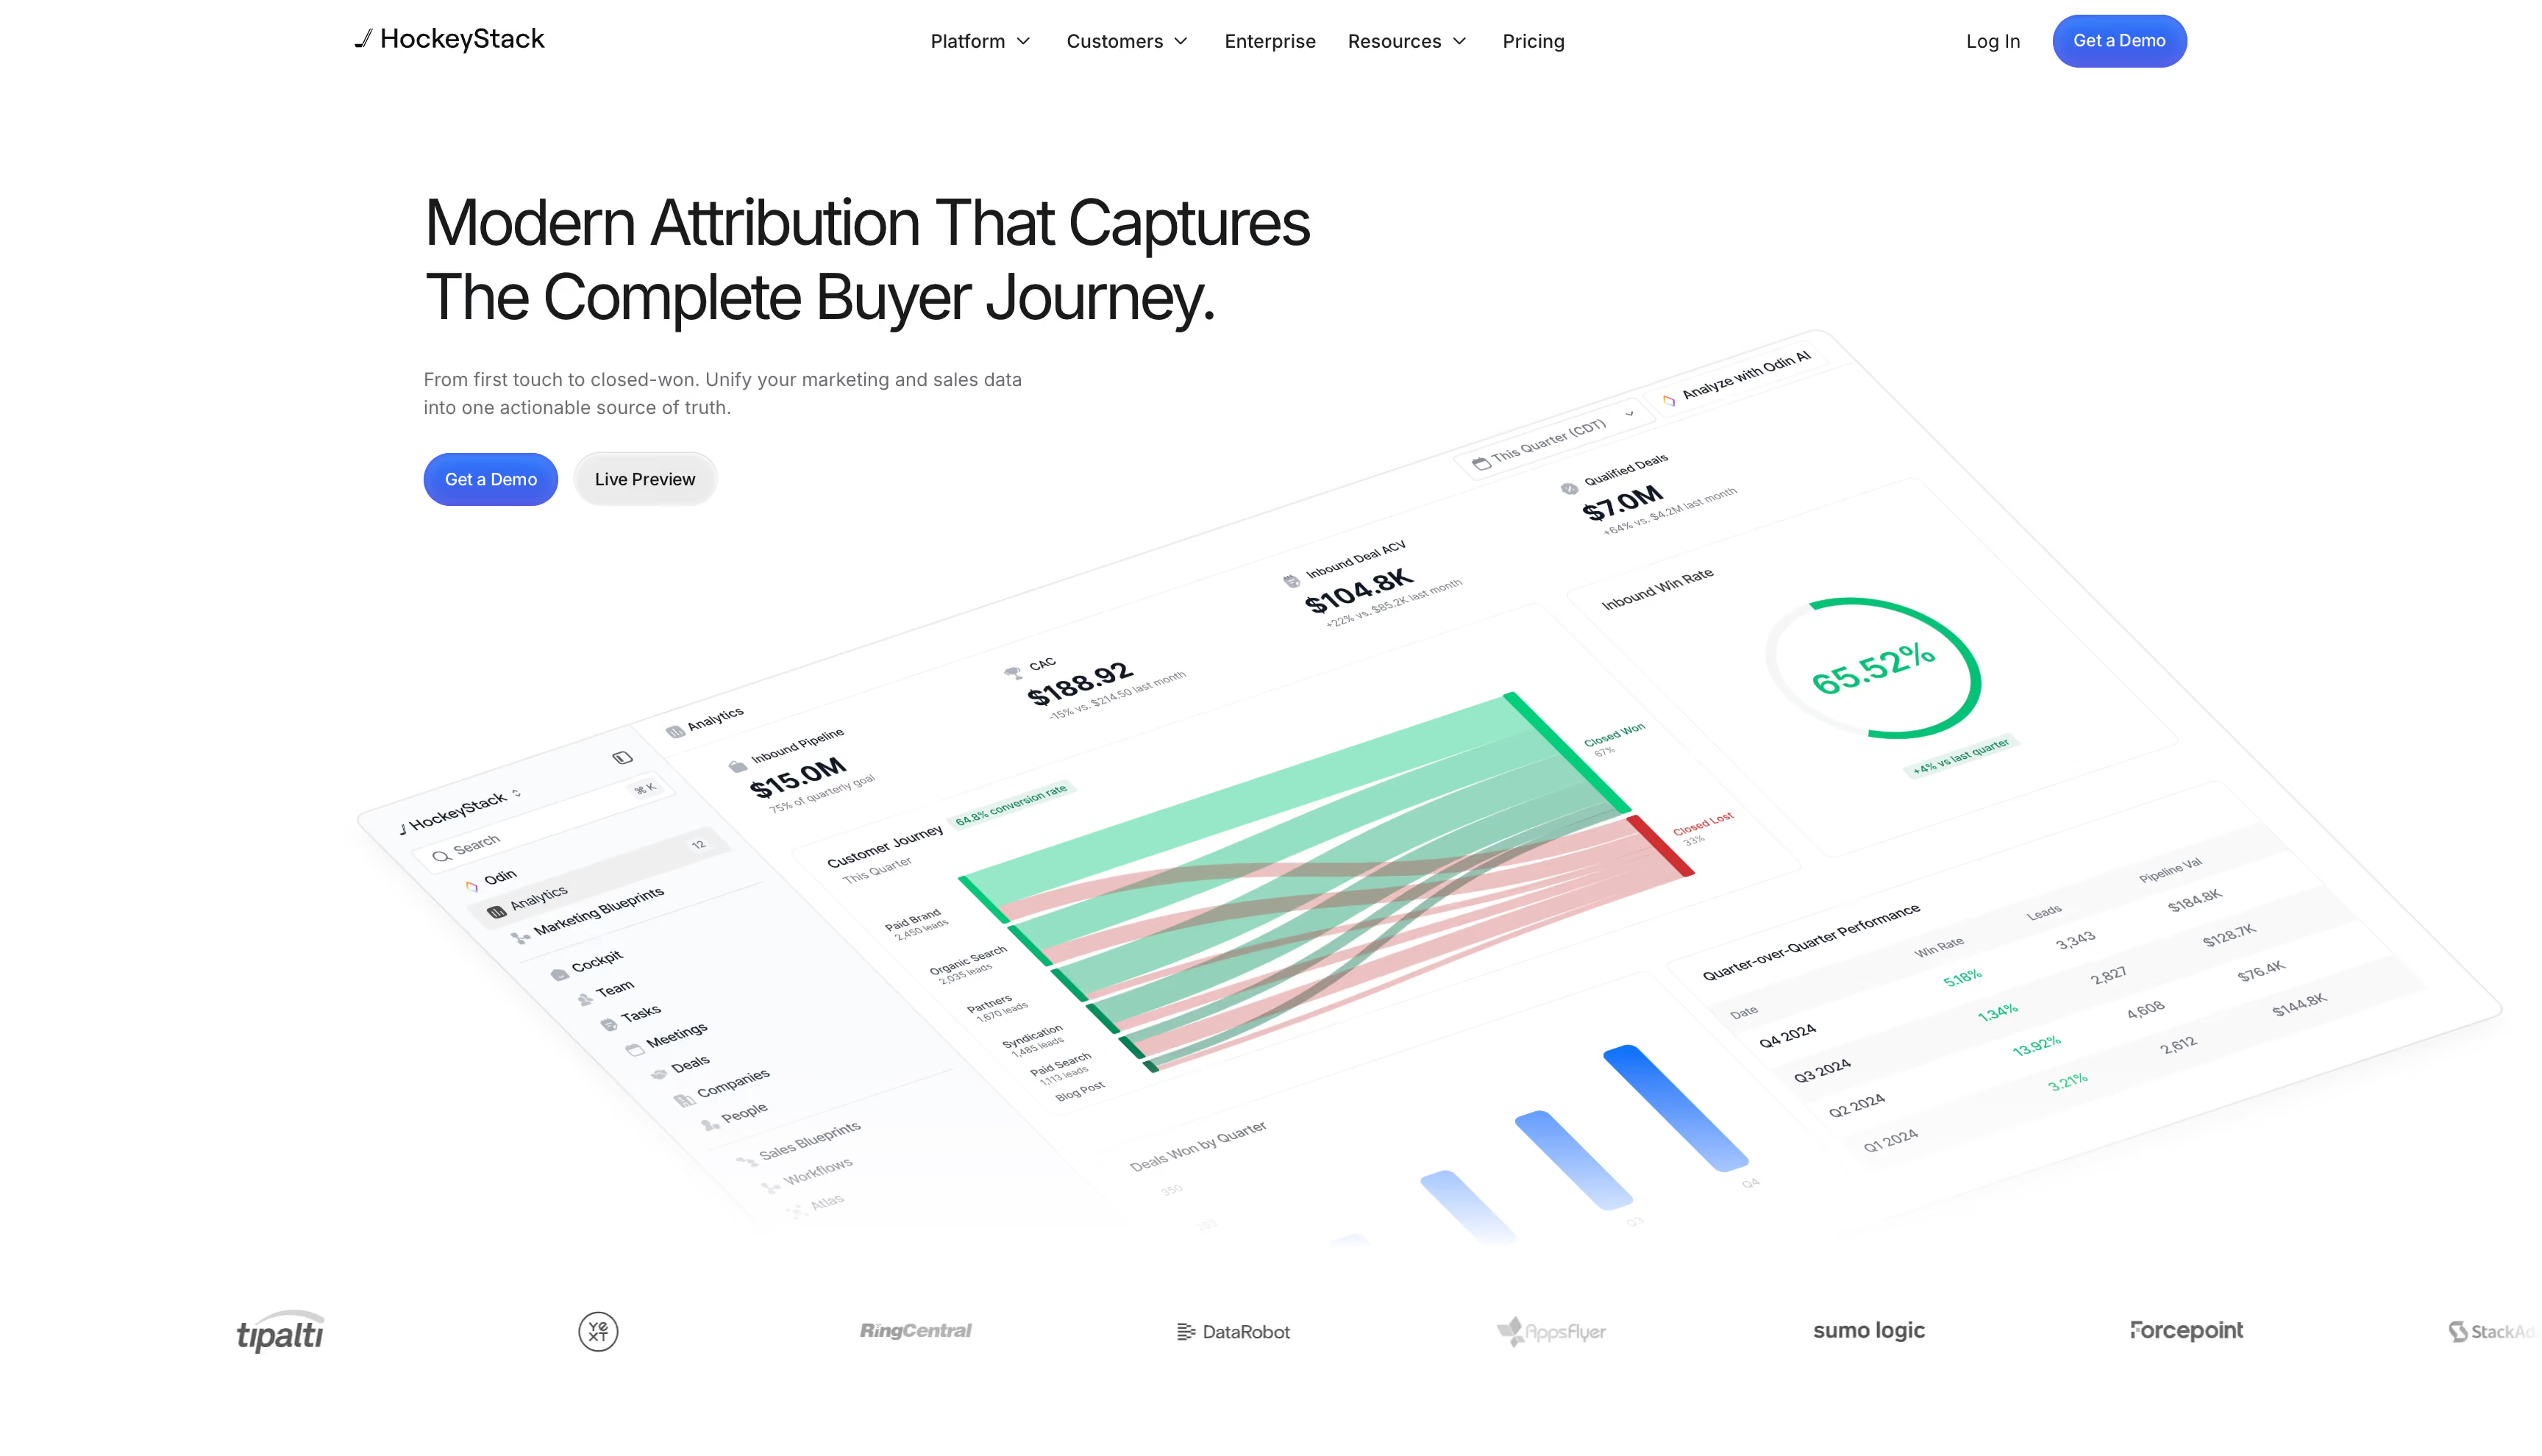
HockeyStack leads with multi-touch attribution and has kept leading with it, even as the company layered Revenue Agents on top after a $50M round in April 2026. The proposition is a single account-level model: every interaction from the first anonymous visit through to closed-won and expansion, tracked without cookies, reconcilable line by line against your CRM.
Key features
▪Holistic buyer journeys, cookieless by default. The dark funnel — research that happens months before a form — gets tied to the account it belonged to, without cookies and without collecting IP addresses.
▪Side-by-side model comparison. Apply any attribution model, switch in a click, and see how each one credits your channels rather than committing to one and defending it.
▪Lift and incrementality reports. Exposed accounts compared against unexposed ones, which is the right instrument for low-volume, high-cost programs like events where a click log tells you nothing.
▪Atlas, the data foundation. Ingestion from CRM, marketing automation, ad platforms, web and warehouse, then identity resolution, deduplication, your own business definitions, and a reasoning layer that connects touchpoints to revenue.
▪Two-way syncing. Conversion and attribution data flow back into the CRM, ad platforms and warehouse, so the ad algorithms optimize on real pipeline instead of form fills.
▪Custom reports without SQL. Attribution models, scoring weights, campaign groupings and exclusions built around your logic rather than a fixed data model.
▪Odin and Nova. An AI analyst for plain-language questions and forward-looking recommendations, and a sales agent that works inside Salesforce on in-market accounts and next actions.
Strengths
Auditability is a stated design goal. Any number drills into the accounts and touchpoints behind it and reconciles against Salesforce, HubSpot and the ad platforms. In a category where "trust the model" is the usual answer, being able to show your work is worth something.
Privacy posture is genuinely strong. Cookieless tracking, EU hosting in Frankfurt, no personal data collected by default, GDPR and CCPA. European teams get a shorter conversation with legal.
Configurability without a data team. Definitions, stages and groupings are yours to set, no-code, with most customers seeing attribution data inside a day.
Limitations
The data model assumes a deal, not a cart. Revenue is a CRM value moving through pipeline stages. Product cost, shipping, payment fees and refunds have nowhere to live, so profit per campaign isn't a question the platform can answer.
Ecommerce reporting is absent. Catalog and SKU performance, return rates by product, repeat-purchase cohorts and ad-level creative analysis aren't part of the product. A DTC brand would be buying account intelligence it has no use for.
Setup reality lags the no-code claim. The vendor says no analyst is required; reviewers consistently describe a learning curve, complex initial configuration and a UI that doesn't guide you, with several noting a technical owner is needed to keep mappings aligned as definitions evolve.
Pricing is invisible until you talk to sales. Quote-based tiers, annual contracts, entry reported near $2,200 a month by third-party procurement data, with modules sold separately. Reported add-ons include US data residency for teams that need it, at meaningful additional cost.
Breadth pulls at focus. Attribution, account intelligence, intent, scoring and now agents share one roadmap. Reviewers who call the product "still maturing relative to how it's positioned" are describing the cost of that spread.
Pricing
Not published. Tiers are quoted after a demo on annual contracts, with attribution, Odin, scoring, enrichment and the Salesforce embed in the lower tier, and the custom agent builder, full agent suite and higher usage limits above it. Third-party procurement data puts entry around $2,200 a month; modules and hosting options move real contracts well beyond that.
Reviews
Flexibility and analytics breadth dominate the praise, followed closely by support described as proactive — several reviewers revised their ratings upward after working with the team. The criticism is equally consistent: complex initial setup, sparse guidance through it, and a sense from some that positioning runs ahead of depth.
Bottom line
A serious B2B multi-touch attribution platform with an unusually clean privacy story and numbers you can defend in a board meeting, now carrying an agent layer on top. For a DTC brand it's simply the wrong shape — the journey it models is a committee deciding over months, and the margin question that decides whether your campaigns make money never enters it.
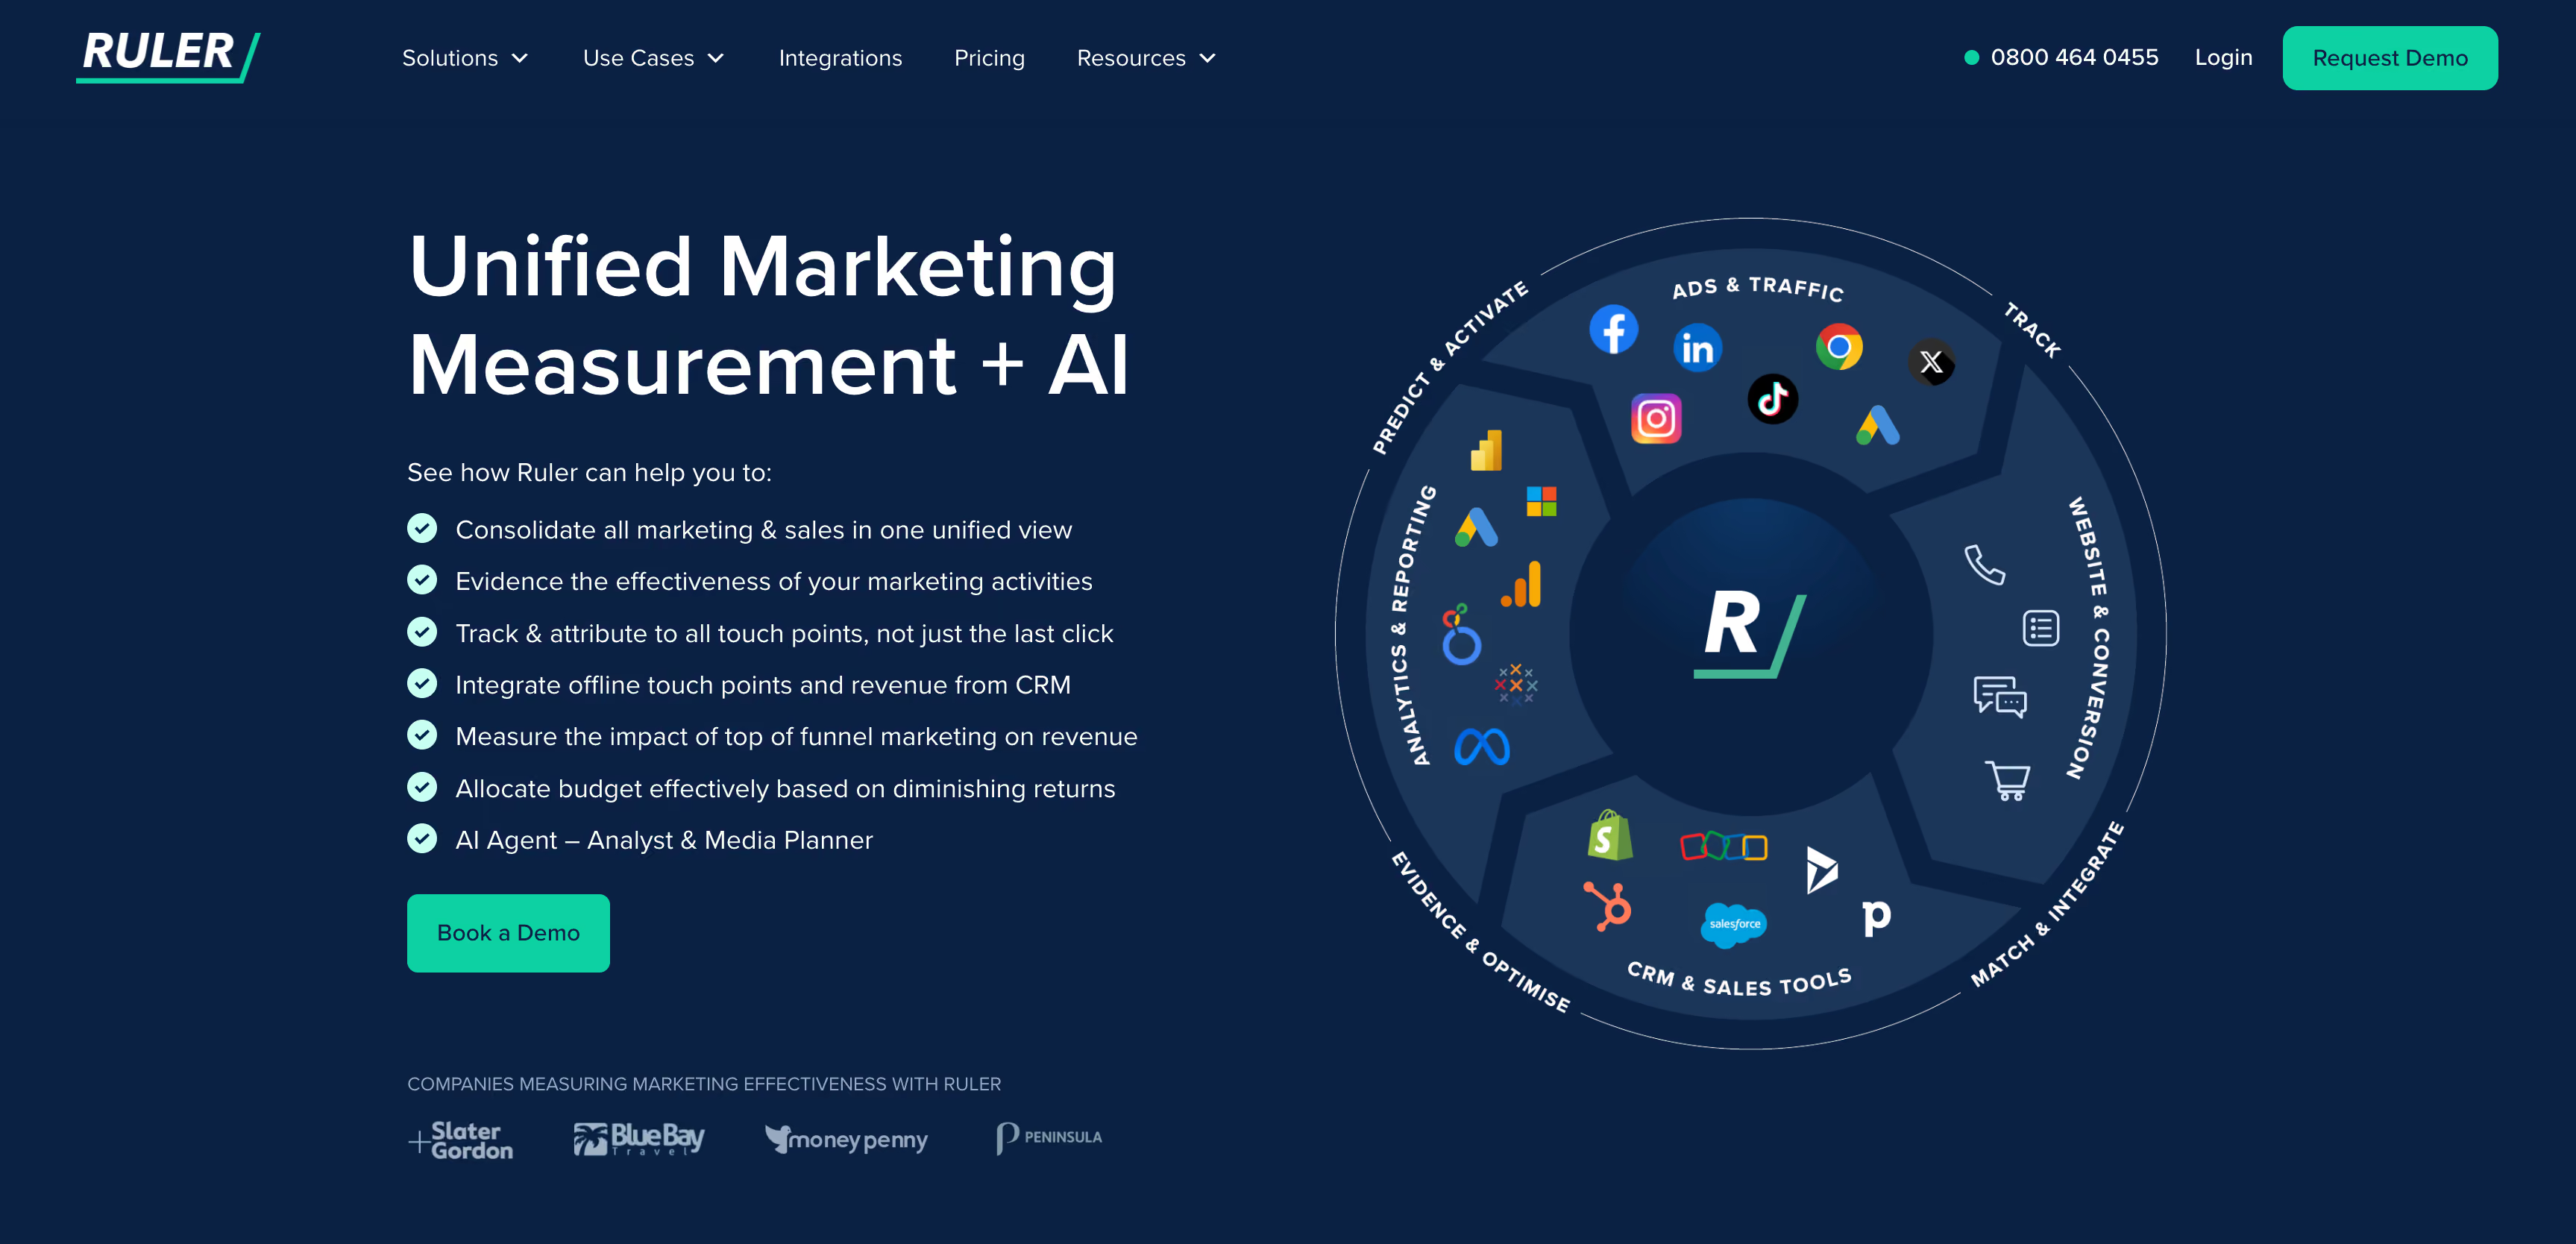
Ruler Analytics
★4.6
Best for: businesses where the sale involves a phone call, a form or a long consideration window, and revenue lands in a CRM rather than a checkout.
Ruler starts from a different premise every other MTA tool above it. Not every conversion is a click on a buy button. Someone researches for three weeks, then picks up the phone, and the deal gets marked won in Salesforce a month later with no trace back to the keyword that started it. Ruler's whole design closes that gap: track the anonymous visitor across sessions, identify them when they convert through a form, call or live chat, then pull the revenue back out of the CRM and attribute it to the channels that earned it.
The company is based in Liverpool, and it publishes its pricing, which sets it apart from most multi-touch attribution vendors.
Key features
▪Conversion tracking that includes the telephone. Dynamic number insertion for calls, plus forms, live chat, offline events like trade shows and sales calls, and ecommerce checkouts across Shopify, WooCommerce and BigCommerce. Call tracking is native rather than a bolt-on.
▪Six attribution models. First click, last click, linear, time decay, position-based, and data-driven, applied to first-party data rather than platform-reported numbers.
▪Impression attribution. Their own probabilistic method for channels with no click path, modelling impression data against MTA and spend to assign revenue where impressions likely influenced the journey. Results can be validated with lift tests, which then feed accuracy back into the model.
▪Marketing mix modelling with a scenario planner. Modelled ROAS across online and offline channels, saturation curves, predictive headroom, and forecasting across initial, optimised and efficiency scenarios against a historical benchmark.
▪Revenue pushed back out. CRM revenue and offline conversions sent to the ad platforms, so bidding optimizes toward closed business instead of form fills.
▪Opportunity attribution. Pipeline stages and opportunity values reported alongside the marketing that created them.
▪An AI agent that plays analyst and media planner, available on the top tier.
▪Your data, your tools. Exports into Snowflake, BigQuery, Redshift and S3, dashboards in Tableau, Power BI, Looker Studio or Domo, with roughly a thousand integrations behind it.
Strengths
Offline conversions are the core, not a feature. For high-consideration purchases, phone and chat are where the money actually closes, and Ruler is one of very few tools here that treats them as first-class rather than something you bolt on later.
Three methods at a mid-market price. MTA, impression modelling and MMM in one platform, starting at $400 a month with published rates. Rockerbox and Northbeam charge multiples of that before you see a number.
Service comes with every tier. A dedicated CS manager and white-glove onboarding are included on the entry plan, which is not how software at this price usually works. Support scores 9.4 in reviews.
Transparent by design. The site argues explicitly against black-box modelling, and the reporting exposes channel, campaign, keyword, click ID, device and path data rather than a score you have to accept.
Limitations
Revenue is the ceiling, and profit isn't in the building. Cost of goods, shipping, fees and returns appear nowhere in the platform. Reporting ends at revenue, ROI and ROAS, which for a DTC brand with 40% product cost and seasonal discounting is the number that starts the analysis rather than finishes it.
Nothing about the catalogue. No SKU-level performance, no return rates by product, no repeat-purchase cohorts, no ad-level creative reporting. If you want to know which product carries an ad or which creative fatigued, this isn't where you'll find out.
You pay for traffic you already have. Pricing tiers on monthly visits, not on ad spend or revenue. A DTC store doing 120,000 visits a month lands on the top tier at $2,000 whether or not it needs mix modelling, while a lead-gen business with 8,000 visits and the same ad budget pays $400.
The good modelling sits at the top. Data-driven and impression attribution start at the second tier; MMM, the scenario planner and the AI agent are Advanced only. The entry plan buys tracking and standard multi-touch models.
Built around the lead, not the basket. Forms, calls, chats, opportunities and CRM stages are the vocabulary. An ecommerce brand where the journey is ad to product page to checkout in one session inherits a call-tracking architecture it will never switch on.
Pricing
Published and tiered by monthly website traffic, in pounds, euros or dollars. Small covers up to 10,000 visits from $400 a month, Medium up to 50,000 from $668, Large up to 100,000 from $1,326, and Advanced starts at $2,000 for anything above that. Annual billing takes 10% off, agency rates exist, and every tier includes phone, email and chat support, a dedicated CS manager and white-glove onboarding. Data-driven and impression attribution arrive at Medium; marketing mix modelling and the AI agent only at Advanced. Ruler describes the figures as indicative, scaling with traffic, product and integration requirements.
Reviews
4.6 on G2 across 30 reviews, mostly mid-market. The two standout scores are dynamic number insertion at 9.4 and quality of support at 9.4, which matches what the product is built around. Reviewers describe it as the tool that finally connected marketing spend to closed business rather than web conversions, and several who compared it against heavier platforms chose it for landing between capability and implementation burden. The review base is small, so treat the average as directional.
Bottom line
The right answer for a business whose customers phone before they buy, and a mismatch for one whose customers check out in ninety seconds. Ruler proves which channels produce revenue, at a price mid-market teams can actually sign, which is rare among multi-touch attribution software. What it never tells you is whether that revenue was profitable, and for a DTC brand that's the half of the question that decides where next month's budget goes.
Polar Analytics
★4.6
Best for: Shopify brands that want attribution, margin and BI in one subscription, and want the underlying data in a warehouse they can query themselves.
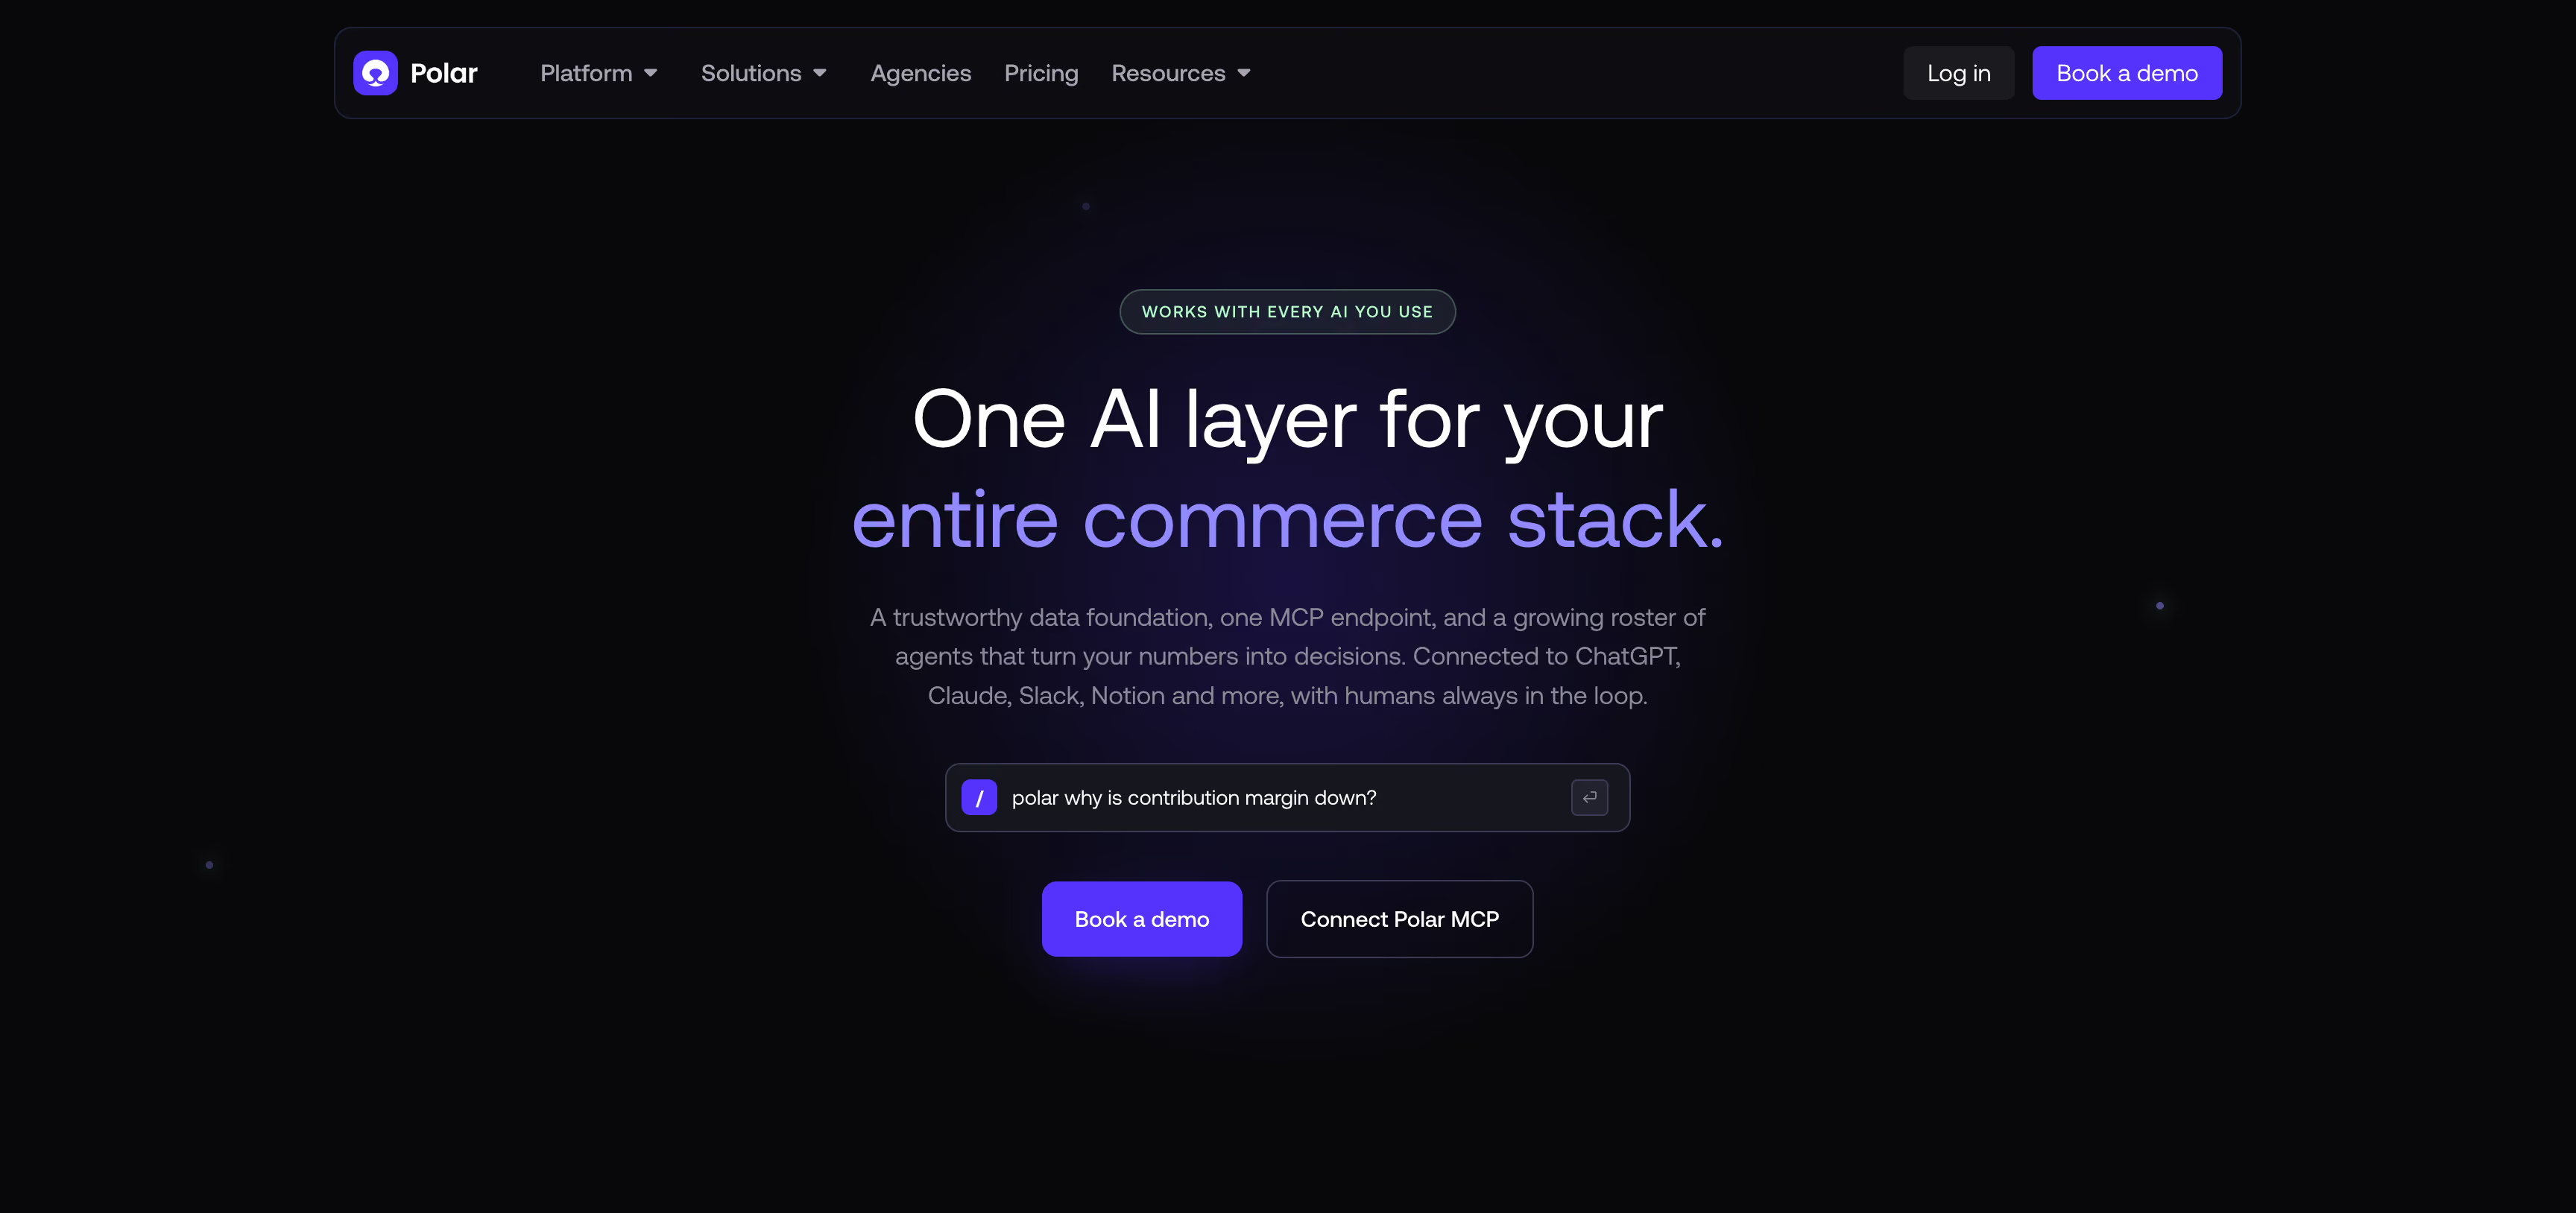
Most multi-touch attribution tools on this list hand you a number and keep the data. Polar hands you the database. Every plan ships a dedicated Snowflake instance with your name on it, a semantic layer of 400+ prebuilt ecommerce metrics sitting on top, and SQL access available if you want to go underneath the dashboards entirely.
Key features
▪Polar Pixel and Lifetime ID. First-party tracking served from your own domain with server-side enrichment behind it, digital fingerprinting where cookies get blocked, and identity stitched across sessions and devices into one lifetime record. It hooks into Shopify's consent mechanism rather than working around it.
▪Ten attribution models with cross-platform deduplication. The set spans awareness-weighted through conversion-weighted, so you can read the same period through the lens of whichever job the budget is doing, and platform double-counting gets reconciled before any of it reports.
▪View-through credit for channels with no click. TV, connected TV, podcast and direct mail impressions ingested from providers like Tatari, TV Scientific and PebblePost, matched to the same Lifetime ID and credited alongside Meta and Google. Only Rockerbox covers comparable ground on this list.
▪Profit reported down to the campaign. Net sales, gross profit and contribution margin reconciled against COGS and operating expenses, sliceable by store, product, country, channel and campaign, with profitability targets you can set and monitor against.
▪Causal Lift. Incrementality testing run with a dedicated data scientist across Meta, Google, TikTok and TV campaigns, measuring impact across Shopify, Amazon and retail, delivered as a report with recommendations.
▪Advertising Signals. Conversion events pushed back into Meta and Google Ads through their conversion APIs, so bidding trains on complete data rather than what survived the browser.
▪Klaviyo Audiences. Abandonment events Klaviyo never saw, fed back into existing flows.
▪An agent suite and an MCP server. Data Analyst, Media Buyer, Email Marketer and Inventory Planner agents, plus an MCP layer that lets Claude or ChatGPT query the warehouse against the semantic layer.
Strengths
You own the data, and that changes what an argument looks like. When a channel owner disputes a number, the answer is a query against your own Snowflake rather than a support ticket to a vendor. Unlimited history and unlimited users on every plan, with no seat math.
Margin reaches the campaign, which most of this list never manages. Contribution margin broken out by campaign and product means you can rank spend by what it earned rather than what it grossed. Triple Whale stops at gross margin. Northbeam, Rockerbox, SegmentStream and Ruler have no profit layer at all.
Offline impression channels get credit through the same identity graph. If TV or direct mail carries real budget, most tools here value it at zero and Polar doesn't.
Support is the most repeated theme in the review base, scoring 9.6, and it shows up as named people rather than a ticket queue.
Limitations
There's no marketing mix modeling. Causal Lift proves campaigns incrementally, one test at a time, with a data scientist attached and a fee per test. What's absent is an always-on model sizing every channel at once, including the ones no tracking can reach. Upper-funnel and offline spend gets validated in episodes rather than measured continuously, and between tests you're back to what the pixel caught.
Fingerprinting sits underneath the identity graph. Recognizing visitors through device signals when cookies fail works, and it's increasingly contested under GDPR and ePrivacy. A brand with an opinionated DPO should have that conversation before the demo rather than after the contract.
Conversion enrichment is a paid add-on that reaches two platforms. Advertising Signals is priced separately and covers Meta and Google Ads. TikTok, Snapchat, Taboola and Outbrain keep optimizing against their own thinned sample.
The platform is sold in pieces. Business intelligence, incrementality testing, Klaviyo Audiences, Advertising Signals and the MCP layer are separate products with separate prices, and intraday refresh, SQL access, demographic enrichment and custom connectors are add-ons on top of those. The entry number and the number on your invoice are a long way apart.
Shopify is the home turf and everything else is a workaround. Headless and non-Shopify storefronts install through an npm SDK rather than one click, reviewers flag a missing Amazon Ads connector, and custom connectors require a support specialist to build, which slows every non-standard source.
Data freshness is the standing complaint. Refresh latency comes up repeatedly in reviews, and intraday refresh is an upgrade rather than the default.
Ten models, none of them yours. A generous preset library, and no way to encode your own credit logic the way Rockerbox allows.
Pricing
Not published as a list. The pricing page gates figures behind an annual GMV selector and routes you to a demo, with a Core plan bundling the products at a discount and a Custom plan letting you pick them individually. G2 lists entry at $300 a month across three plans, and third-party reporting puts base analytics near $300–350, roughly $400 once the pixel, CAPI enhancer and Klaviyo enricher are added, and an Enterprise quote above $20M in annual GMV. Cost scales with monthly tracked orders rather than seats. Every plan includes the Snowflake database, the first-party pixel, unlimited users, unlimited history and a dedicated success manager. Free trial available, no free plan.
Reviews
Reviewers describe replacing a stack of Sheets, Looker Studio connectors and freelance data work with one platform, and consolidation plus speed of setup dominate the praise. Complaints are specific and consistent: refresh latency, custom connectors that need a support specialist, the missing Amazon Ads connection, and cost relative to store size at the smaller end.
Bottom line
The rare multi-touch attribution tool here where attribution and contribution margin report from the same tables without a six-figure commitment. The gap is the aggregate layer. With no mix model, every channel a click can't observe gets proven one paid test at a time, and the signal loop closes on two platforms behind an add-on — so the measurement is excellent and the machinery for acting on it is thinner than the price of admission suggests.
Best for: every brand that wants a free, vendor-neutral read on click-driven conversions, and has the SQL or the patience to work around what the interface won't do.
Every multi-touch tool on this list gets compared against GA4 at some point, usually as the exhibit for why you need something else. The honest problem isn't the modeling. It's that GA4 sees clicks in a browser, reports revenue, and stops there.
Key features
▪Data-driven attribution, free. The model trains on converting and non-converting paths, compares exposed users against a holdback group, and assigns fractional credit based on how much each interaction moved purchase probability. Time from conversion, device, ad order and creative type all feed it.
▪Three models, and only three. Data-driven, paid and organic last click, and Google paid channels last click. First-click, linear, time-decay and position-based were removed in November 2023 and haven't returned.
▪Per-conversion attribution settings. Model and lookback window are now configurable per key event rather than property-wide, so a newsletter signup and a $2,000 order no longer share a 90-day window.
▪Attribution paths and model comparison. A path report showing sequences before conversion, a comparison view for testing one model against another, and a Conversion Attribution Analysis report in beta since February 2026 that surfaces assisted conversions and sorts touchpoints into early, mid and late stages.
▪BigQuery export. Raw event-level rows, free to enable on standard properties up to 1 million events a day, unsampled and outside the retention ceiling once they land.
▪Google Ads conversion import and cross-channel budgeting. Key events flow into Google Ads as conversion actions, so smart bidding optimizes on GA4's reading rather than the platform's.
Strengths
The price makes it a free second opinion, and second opinions are the point. When Meta claims 40 purchases and Shopify shows 22, having a neutral third count that isn't selling you ad inventory changes the conversation.
Data-driven attribution is genuine. Counterfactual modeling against a holdback group is methodologically serious work, and most brands are getting it for nothing.
BigQuery export is the escape hatch. Every raw event, in a warehouse you own, unsampled and permanent. Any limitation of the GA4 interface can be engineered around from there.
Everyone already reads it. No onboarding argument, no procurement cycle, and every agency, freelancer and analyst you hire knows the tool on day one.
Limitations
Clicks in a browser, and nothing else. No view-through credit, no impression modeling, no server-side collection. Consent banners, ad blockers and iOS opt-outs cut straight into the dataset, and GA4 reports what survived as though it were the whole picture.
Data-driven attribution silently falls back to last click. Below 400 conversions for a key event and 20,000 across all key events in the lookback window, GA4 reverts and doesn't tell you. A lot of brands are running last-click while believing they've moved past it. The only way to check is to compare both models and see whether the numbers are identical.
Your model setting doesn't reach most reports. Attribution settings apply only to dimensions without a session or first-user prefix. Session source is what standard reports use by default, which means the acquisition report you actually open is showing last-touch regardless of what you configured.
Profit has no home in the platform. GA4 will tell you a campaign produced $40,000 and has no opinion on whether it made money. Product cost, shipping, fees and refunds by campaign are all absent, so there's no POAS, no contribution margin and no way to rank channels by anything except revenue over spend.
No ecommerce BI in the terms that decide budget. Item reports exist, but returns aren't traced to the campaign or product that caused them, repeat-purchase cohorts are capped by the retention window, and there's no ad-level creative analysis or influencer ROI.
14 months of user-level history, and 2 by default. Explorations lose everything past the ceiling, the default has quietly cost teams a year of history they assumed was there, and BigQuery only captures data from the day you enable it. Sampling kicks in on Explorations above roughly 10 million events.
The loop closes on Google and nowhere else. Key events push into Google Ads. Meta, TikTok, Snapchat and the native networks receive nothing back.
Nothing here acts. Cross-channel budgeting reports a view. There's no allocator, no AI analyst answering questions of your own data, and no automation layer turning a finding into a budget change.
Free at the interface, expensive in hours. The real cost is analyst time — reconciling numbers, maintaining UTM discipline, and writing SQL against a nested BigQuery schema that no other Google product makes you handle directly.
Pricing
Free for standard properties, with no seat limits and no spend thresholds. Analytics 360 is quoted through Google Cloud sales, reported to start near $50,000 a year, and buys retention up to 50 months, BigQuery exports in the billions of events per day, intraday data freshness, a 99.9% SLA, subproperties and dedicated support. BigQuery storage and query costs sit outside both tiers and run modestly at typical ecommerce volumes.
Reviews
4.5 on G2 across more than 6,500 reviews, which measures ubiquity more than fitness — GA4 is installed almost everywhere, so the rating reflects a population with no alternative rather than a chosen one. Praise concentrates on cost, the depth available once you learn it, and how cleanly it connects to the rest of Google's stack. Criticism is remarkably consistent: an interface that hides what you need, a learning curve steeper than the old Universal Analytics, and reporting that never reconciles with what the ad platforms claim.
Bottom line
Keep it installed. It's a free, neutral count that's useful precisely because nobody is selling you anything with it, and BigQuery export means the raw data is always yours. What it can't be is your multi-touch attribution system.
Final verdict: the best multi-touch attribution tool in 2026
Admetrics takes it, on the criterion that decides budgets. Conversions are collected server-side, nine models split the credit, product cost and returns come out per SKU, and PRISMA plus the Budget Allocator turn that into a spend split you can execute. Published pricing from $399 a month, and EU hosting if your DPO has opinions.
++
Frequently Asked Questions
Does HubSpot have multi-touch attribution?+
Yes, with the useful part gated. Attribution reporting runs on Marketing Hub Professional and Enterprise, but only Enterprise gets deal-create and revenue attribution reports — on Professional you can attribute contact creation and nothing further down the funnel. Nine models are documented, including linear, U-shaped, W-shaped, time decay on a 7-day half-life, and full path, which splits 22.5% each across first interaction, lead creation, deal creation and last interaction.
The constraints matter more than the model count. HubSpot's revenue attribution ignores interactions happening outside HubSpot unless they arrive through a UTM-tagged URL landing on a page carrying the tracking code. Deals only count if they're closed-won, carry an associated contact, and have Amount, Create date and Close date filled in. Attribution also samples at 100,000 interactions per deal. For a B2B team already on Enterprise it's a reasonable first answer. For paid media measurement it isn't one, because ad spend never enters the calculation.
Can you do multi-touch attribution in Marketo?+
Not in Marketo Engage itself — attribution is a separate Adobe product, Marketo Measure, formerly Bizible. Adobe documents six models built around four milestone touchpoints in the journey: First Touch and Lead Creation are single-touch, while U-shaped, W-shaped, Full Path and Custom distribute credit across several. W-shaped gives 30% each to first touch, lead creation and opportunity creation, then spreads the remaining 10% proportionally across whatever happened in between. That's a milestone-weighted approach rather than a behavioral one. Credit follows position in a defined B2B funnel, which fits a long committee sale and doesn't fit an ecommerce basket.
What's the best option for multi-channel attribution software?+
For ecommerce and DTC brands, Admetrics. Multi-channel measurement lives or dies on two things: whether the conversion gets collected at all, and whether one person stays one person across sessions and devices. Admetrics collects server-side instead of in the browser, pulls shop, ad accounts, CRM and email into one warehouse through 40+ native connections, and streams enriched conversions back to Meta, Google, TikTok, Snapchat, Taboola and Outbrain — so the platforms optimize against the same buyers you're measuring, rather than a thinned sample of them.
What are the best practices for measuring marketing ROI with multi-touch attribution?+
Fix the inputs before you argue about models. Enforce one UTM taxonomy so Facebook, facebook and fb stop reporting as three channels. Send conversions server-side rather than relying on the pixel. Reconcile the tool's numbers against your Shopify or CRM totals every month, and treat a persistent gap as a tracking bug rather than a modeling preference. Then compare two models over the same period — if a channel's share swings wildly between them, that's a data problem, not an insight. And put cost of goods, shipping, fees and returns into the calculation, because ROI measured on revenue isn't ROI.
Which multi-touch attribution software is most reliable for ad spend?+
The ones collecting conversions on the server rather than in the browser. Consent banners, ad blockers and iOS opt-outs remove a meaningful share of touchpoints before any model runs, and a platform that never saw the conversion can't attribute it. Admetrics collects server-side and streams enriched conversions back to Meta, Google, TikTok, Snapchat, Taboola and Outbrain.
Is multi-touch attribution still accurate in 2026?+
It's as accurate as the data underneath it, which is a different thing than it used to be. Modeling has improved while collection has degraded, so the usual failure now is a sophisticated model producing a confident answer from an incomplete dataset. Two things close most of the gap: server-side collection, and a second method — mix modeling or geo holdout testing — that doesn't depend on tracking individuals at all. Treat disagreement between the two as a measurement of what your tracking is losing.
How much does multi-touch attribution software cost?+
Anywhere from free to $50,000 a year, and roughly half this market won't tell you before a demo. Price the tier that contains the capability you're shopping for — mix modeling, custom models and conversion enrichment usually sit one or two tiers above the entry number.