Mission control
for e‑commerceFrom independent measurement to governed allocation. One closed loop, open to your entire stack.See how the system works →
Admetrics is the best marketing attribution tool for ecommerce and DTC brands in 2026, ahead of Triple Whale, Dreamdata, Ruler Analytics, HockeyStack, Northbeam, SegmentStream, Cometly, GA4, and Funnel. It's the only tool here that runs the full chain — from server-side tracking to automated budget execution — instead of stopping at the dashboard.
The tools that change your budget are the ones that act, not just measure. Most platforms report a number and hand the last mile back to you and a spreadsheet; a few turn the measurement into an actual spend decision. That line matters more than any feature list.
Browser pixels are quietly failing under consent opt-outs and cookie loss. Server-to-server (S2S) tracking recovers the conversions they miss and streams them back to the ad platforms — it's the foundation every accurate attribution model depends on.
ROAS rewards revenue, not profit. The tools worth paying for net out COGS, shipping, fees, and returns to show profit (POAS) per channel — which regularly reorders your "winners" and changes which campaign you'd scale.
MTA answers the weekly question — which campaign is pulling weight — but can't see offline, upper-funnel, or where a channel saturates. Mix modeling (MMM) covers that blind spot, and the strongest tools run both and reconcile them.
What attribution actually costs you when it's wrong
Your last-click report calls branded search and retargeting your best channels, so you move budget into both. Six weeks later new-customer growth stalls — you starved the channels that create the demand branded search only harvests at the finish line.
The report wasn't wrong about the clicks, only about the credit — and the tool assigning it decides where next quarter's budget goes. Most ecommerce and DTC teams run attribution software but still decide on gut feel, especially once consent opt-outs and cookie loss have thinned the data underneath.
This guide compares the 10 best marketing attribution tools for 2026: what each measures, where it breaks, and who it's built for.
What is Marketing Attribution?
Marketing attribution is how you decide which channels, campaigns, and touchpoints get credit for a sale — and, by extension, where your budget goes next. The job: connect what you spent to what you earned, accurately enough to spend the next dollar better.
The definition is easy; the disagreement isn't. A single DTC purchase in 2026 can span five to fifteen touchpoints over weeks — pre-roll, Meta ads, an influencer story, branded search, a direct visit. The rules that split that one conversion across them make the model you choose a budget decision disguised as a reporting setting.
Attribution models, in one pass
Single-touch models give 100% of the credit to one touchpoint — first-click or last-click — fast to read and wrong in predictable ways. Multi-touch attribution (MTA) spreads credit across the journey, either by fixed formula (linear, time-decay, U-shaped) or, in data-driven and ML models, by each touch's measured effect on the odds of purchase. This is what teams want when they search for attribution modeling tools or ask which attribution model is best.
But the sharpest model is only as honest as its data: if a third of your conversions never get tracked — the default on a post-cookie, consent-gated web — no clever credit-splitting fills the hole.
Why server-to-server tracking beats browser pixels for marketing measurement in 2026
Browser-based tracking is quietly failing, and it drags attribution accuracy down with it. The classic pixel fires in the user's browser at conversion — then hits a gauntlet: Safari caps cookies to a day, iOS opt-outs, ad blockers, consent banners, and the end of third-party cookies. Each one is a conversion your pixel counted last year and misses today.
Server-to-server (S2S) tracking moves recording off the browser. The conversion goes straight from your server to the ad platform — Meta's Conversions API, Google's Enhanced Conversions — as first-party data you own, firing whether or not the browser cooperates.
The payoff isn't just a fuller dataset. Those recovered events stream back into the ad networks' bidding engines, so the algorithm optimizes against what actually happened. Better signal in, better delivery out.
This is what separates a real marketing attribution platform from the marketing tracking software of five years ago. Run the smartest multi-touch model on browser-only data and you're still doing precise math on a shrinking, skewed sample. Fix the tracking layer first — then the model has something honest to measure.
Beyond ROAS: how the best tools track profit and revenue
A campaign at 4x ROAS looks like a winner until you net out what the sale cost — 30% COGS, 12% shipping and fees, and a hero product that comes back a quarter of the time. The 4x is real; the profit is near zero, and you scaled it because the dashboard said so. That's the gap ROAS hides. Return on ad spend is revenue over spend, and revenue says nothing about what you keep. Every ecommerce brand carries costs between a sale and a profit — COGS, shipping, fees, discounts, returns — and ROAS is blind to them.
Profit on ad spend (POAS) is the fix: it nets those costs out before calling anything a winner, so the channel that survives to contribution margin is the one that funded the business. Rank channels by revenue and by profit and the order changes, sometimes inverts. This is what buyers reach for past basic ROAS calculation — real revenue tracking and ROI calculation down to the order. Only the tools that carry the math through COGS and returns to profit change which campaign you scale.
How the best tools measure marketing performance: MTA, MMM, and the next dollar
Multi-touch attribution tells you Meta prospecting earned 18% of last month's tracked conversions. Useful — until you remember what "tracked" leaves out: the CTV spot with no click, the podcast heard in the car, the point where Meta stopped returning anything and you kept spending. MTA only divides credit among the touchpoints it recorded. That's the ceiling of every multi-touch model: a click-level lens, right for the daily question — which campaign or creative is pulling weight in your trackable mix, which the best multi-touch attribution tools answer well. What it can't answer is the question that sets your budget: is the next dollar into this channel still worth spending?
Marketing mix modeling works from the other end, modeling spend against outcomes in aggregate — catching what MTA misses (offline, upper-funnel, brand) and where each channel saturates. Neither replaces the other: MTA is your performance attribution tool for the week, MMM the marketing performance measurement layer for the quarter and the marginal call. The tools worth paying for run both — the lens we used to rank them.
How we tested and scored each tool
We put these marketing attribution companies through the lens the sections above argue actually decides the outcome — not feature counts or marketing volume. Four criteria, weighted in order:
▪Tracking accuracy — does it hold once consent opt-outs and cookie loss thin the data?
▪Channel coverage — paid, organic, offline, and upper funnel, or only the last click?
▪Profit visibility — does it carry the math through COGS and returns to profit, or stop at revenue?
▪Action — does it turn measurement into a budget move, or hand you a dashboard?
Scores draw on hands-on testing, vendor documentation, and verified G2 and Capterra reviews. Where a tool's marketing and its behavior disagreed, we scored the behavior — which is why several well-marketed names land mid-table.
Quick comparison: best marketing attribution tools 2026
Best for: ecommerce and DTC brands that want profit as the number they manage to, with tracking, attribution, BI, and budget execution running in one system instead of five.
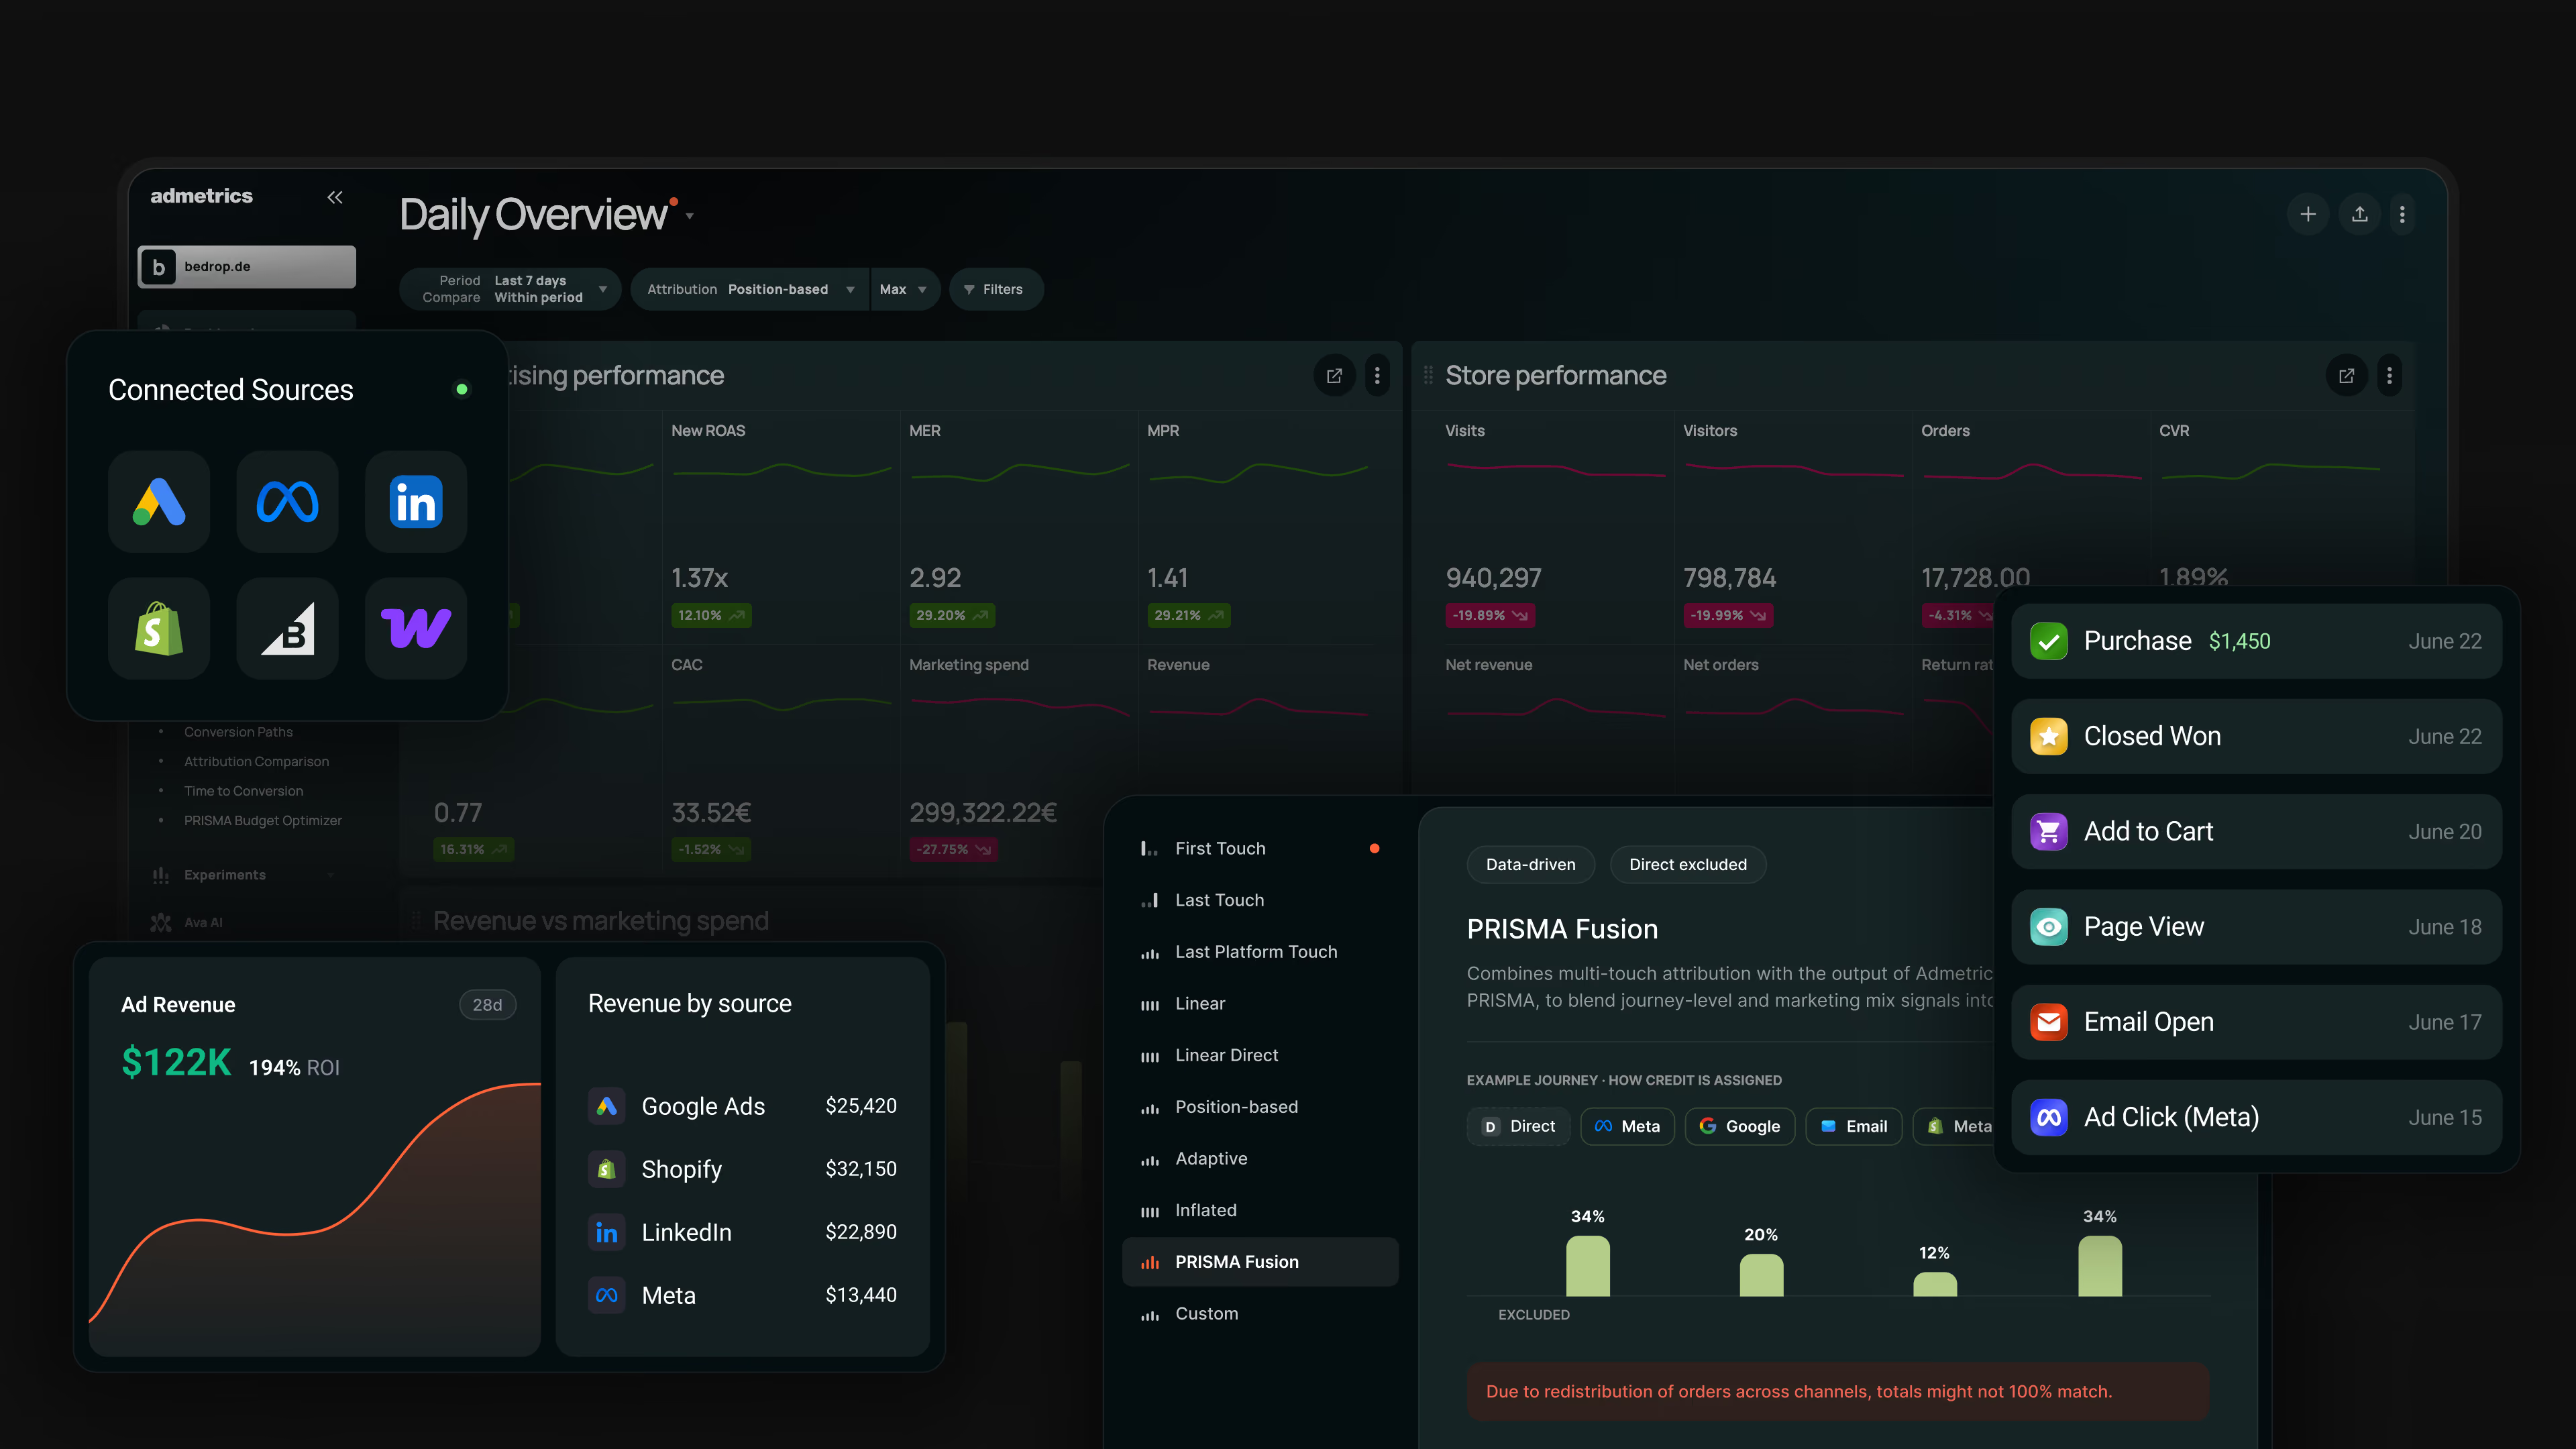
Meta says 500 conversions. Shopify says 310 orders. Finance asks which number goes in the board deck, and nobody in the room actually knows. Admetrics was built to end that argument. Not as an ecommerce use case bolted onto a general analytics product, but as the whole premise: server-to-server tracking, profit-first attribution down to SKU level, machine-learning marketing mix modeling, creative fatigue detection, cohort and LTV analytics, and automated budget execution through Ad Pilot. Most tools in this category stop at the dashboard and hand the hard part back to you. Admetrics runs the chain from raw signal to the budget change that follows from it.
Key features
▪S2S first-party tracking & signal enrichment. 10–30% higher tracking accuracy than browser pixels, with recovered conversions streamed back into ad network bidding through Meta CAPI and Google Enhanced Conversions. Data is hosted on secure servers in Germany for full GDPR compliance.
▪Profit-first business intelligence. Ecommerce BI, Profit Analytics, LTV Analytics and Return Analytics in one suite, down to SKU. POAS replaces ROAS, with COGS, shipping, returns and fees netted out before anything gets called a winner.
▪Multi-touch attribution & Performance View. Acquisition and retention are credited differently instead of pooled, which is how retargeting stops looking like growth.
▪PRISM4 marketing mix modeling and Budget Allocator. A genuine ML-driven MMM, not a rule that redistributes direct traffic across channels. It isolates upper-funnel and offline impact, diagnoses saturation channel by channel, and says where the next euro returns the most.
▪Creative and influencer analytics. Fatigue tracked against concrete thresholds — CTR decay, frequency, CPM drift — with Hook Rate, Thumbstop Rate and CM2 per asset. The same logic extends to creator partnerships.
▪Ad Pilot and Ava. A native MCP Server and Data API let AI agents query performance and execute budget or bidding decisions, with Ava sitting on top as an always-on analyst.
▪Cohort and retention analytics. Cohort Analysis, Product Affinity and Repeat Order Probability connect acquisition spend to the LTV it produced.
Strengths
One system instead of a stack. Tracking, attribution, BI, MMM, budget allocation and execution live in one product. Most brands assemble this from three or four vendors plus a spreadsheet that reconciles them.
The signal loop is closed. Recovering conversions is table stakes. Feeding them back into Meta and Google so the bidding algorithm optimizes against real buyers is where the 10–20% lifts in target metrics come from, and it's the step most dashboard-first tools skip.
A deep bench of BI and MI modules. E-Commerce BI, Profit Analytics, LTV Analytics, Product Analytics, Return Analytics, and Cohort Analysis sit under one roof, covering questions down to SKU and cohort level that a standard attribution dashboard never touches.
Real Marketing Mix Modeling. PRISM4 runs ML-driven MMM, isolating upper-funnel and offline impact and diagnosing budget saturation channel by channel, not a rule-based approximation bolted onto an attribution model.
A Budget Optimizer. Turns attribution and MMM output into concrete cross-platform budget moves, so the translation from insight to action doesn't live in a separate spreadsheet.
An AI agent layer with native MCP. Ava and Ad Pilot connect the data warehouse directly to an MCP Server and Data API, letting AI agents query performance and execute budget or bidding decisions autonomously.
Limitations
Built around the ecommerce data model. Shopify, WooCommerce, Magento and similar. B2B teams with 9-month sales cycles and CRM-anchored revenue should look at Dreamdata or HockeyStack.
The agentic layer is young. Ava and the MCP server are recent. Automation depth is expanding rather than finished.
Pricing scales with ad spend. Each package includes a spend threshold, then charges a percentage above it. Fast-scaling brands need to model that variable rather than expect one flat number.
Pricing
Admetrics prices against monthly ad spend rather than seats. Growth starts at $399/month and covers the first $20,000 of monthly spend, with 1.5% above. Business starts at $899/month, covers up to $70,000, and charges 1% on the excess. Above $100K/month, pricing goes custom along with feature and support options. Every tier includes a 14–21 day trial, no card required.
Reviews
The G2 profile averages 4.97 out of 5, and the reviews are unusually consistent about why. Two things recur: the tracking numbers hold up under scrutiny, and support doesn't stop at implementation. The case studies carry numbers rather than adjectives: Ehrenkind's performance marketing lead credited a 60% ROAS increase, and DTC brand Nyfter reported tripling the volume of data it could reliably track after switching. "Admetrics helped us overcome scaling challenges and set a new benchmark for paid-ads. The AI integration solved attribution complexity, so we slashed CAC by 70% and boosted revenue by 81%."
Bottom line
Every other tool on this list hands you a number and stops. Admetrics is the only one that collects the signal server-side, prices the result in contribution margin rather than revenue, and then moves the budget. If you sell physical products and spend real money on paid media, the question isn't whether it's the strongest entry here. It's what you're still paying four other tools to do.
Best for: ecommerce and DTC brands spending six figures a month or more on paid media that need a first-party, cross-channel source of truth for daily budget decisions.
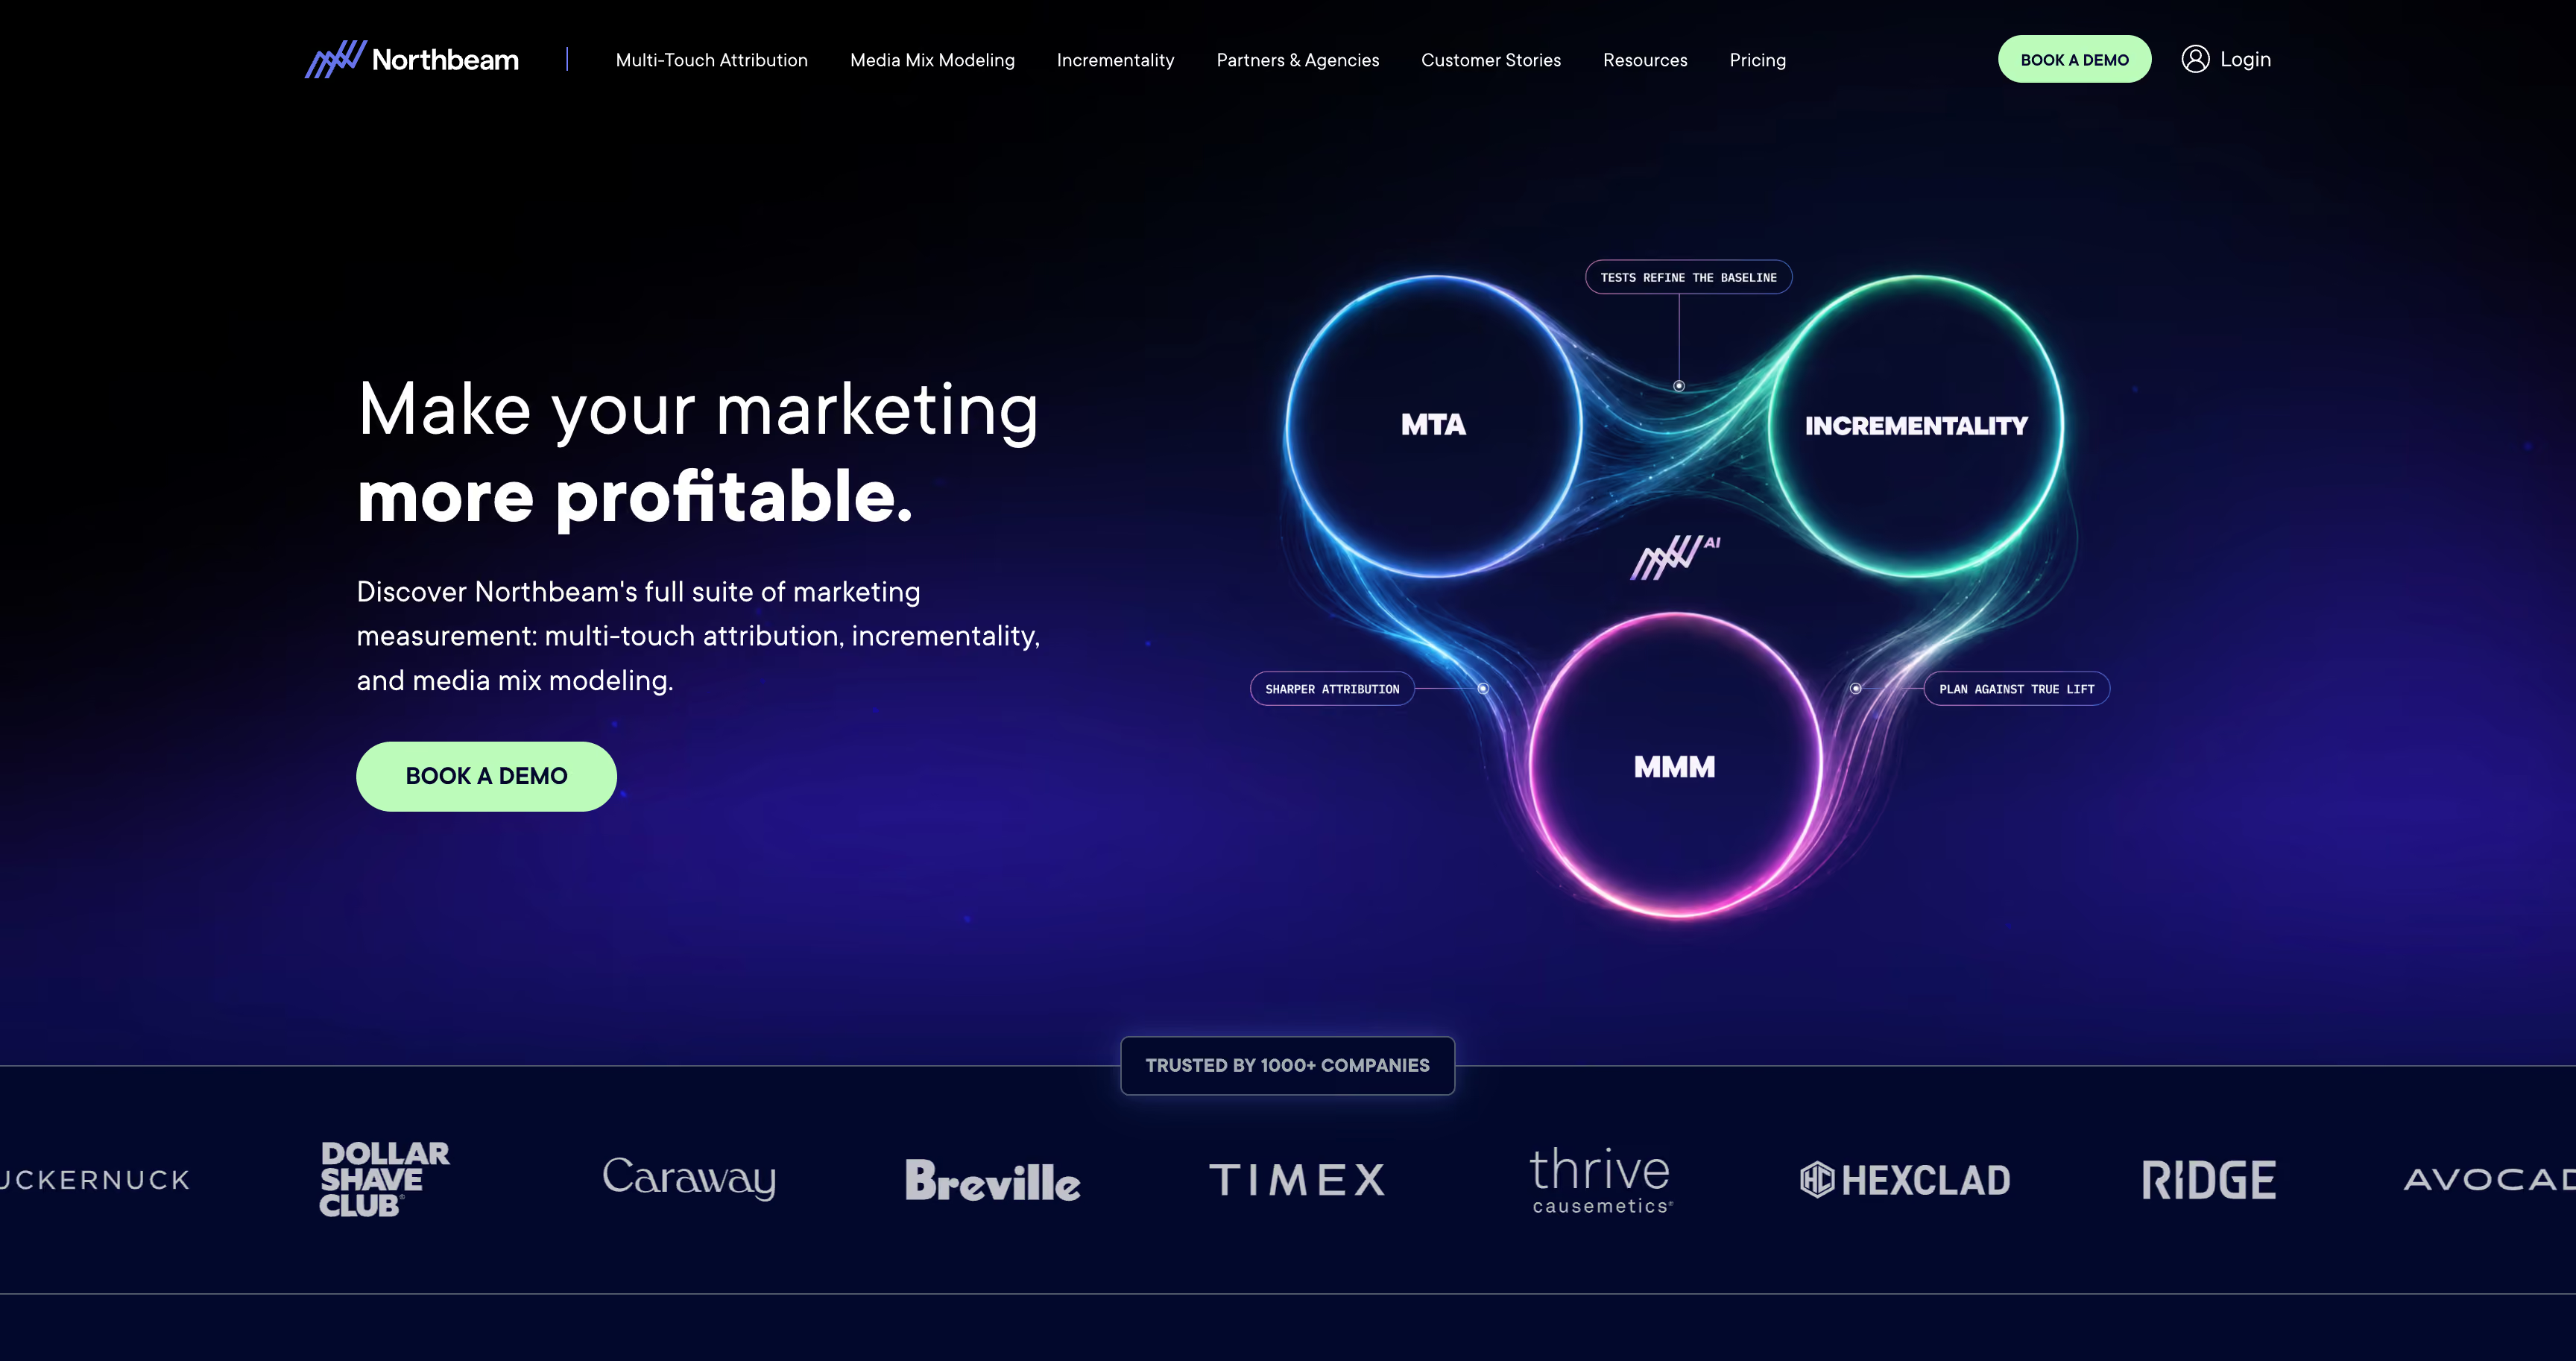
Northbeam is an enterprise-grade, machine-learning attribution platform for mid-market and enterprise ecommerce. It maps multi-touch journeys across Meta, Google, TikTok, YouTube, affiliate, programmatic and TV using first-party data, with the explicit goal of removing in-platform bias from the numbers media teams allocate against. It's what brands graduate into when last-click stops being defensible and the spend is large enough that a 5% misallocation costs more than the software.
Key features
▪Multi-touch attribution dashboards. Customizable, first-party-data views that track every channel, campaign, and ad against revenue, refreshed daily so teams catch performance shifts before they compound.
▪Clicks + Deterministic Views. A view-through methodology that connects ad impressions, not just clicks, to conversions, giving upper-funnel and CTV campaigns credit that click-only models miss.
▪Northbeam Apex. Feeds first-party conversion data back into ad platform algorithms, a layer deeper than a standard conversions API, aimed at improving delivery and targeting quality over time.
▪Profit Benchmarks. Sets and tracks performance targets against profitability goals rather than raw ROAS.
▪Creative Analytics. Ad-level insight into thumbstop rate, hook rate, and other creative metrics across every channel, useful for deciding which assets to scale or retire.
▪Product Analytics. SKU-level performance data tied back to ad spend, helpful for merchandising and spotting which products convert best from which channels.
▪Metrics Explorer / Correlation Analysis. Built-in statistical tooling to test halo effects between channels, like whether upper-funnel spend is quietly lifting branded search or direct traffic.
▪Media Mix Modeling+ (MMM Plus). An add-on from the Professional tier up that layers incrementality, seasonality, and promotional-impact modeling on top of the MTA data, backed by dedicated media strategy support on Professional and Enterprise plans.
Strengths
Attribution accuracy is the standout. Across dozens of reviews, the number-one thing people credit Northbeam for is a number they trust more than what Meta or Google report, used daily to decide where budget goes.
It functions as an actual source of truth. Multiple accounts describe standardizing all channel reporting around Northbeam once it's live, replacing spreadsheets stitched from five platform dashboards.
Fast & Clean UI for Media Teams. Speed and flexibility in the main reporting view allow media teams to make quick, daily budget allocation adjustments.
Limitations
The price floor excludes most brands — $1,500/month at entry, no free plan, no self-serve trial. Reviewers put the sensible threshold around $5M in annual revenue.
MMM is an add-on starting at the Professional tier. The layer that makes attribution forward-looking isn't in the Starter price. Below $250K/month in spend, you're buying multi-touch attribution and nothing beyond it.
The learning curve is real and universally flagged. "Complex," "overwhelming," "steep" recur across nearly every review, including the five-star ones.
Pricing
Three tiers, spend-based rather than flat SaaS. Starter targets brands under roughly $250K/month in media spend, begins at $1,500/month billed on data volume, and integrates directly with Shopify. Professional targets advertisers above $250K/month, switches to flat-rate annual billing, and adds a dedicated media strategist plus support for any ecommerce platform. Enterprise, above $500K/month, is fully custom and adds a dedicated CSM, MMM+ as an option, and enhanced data refresh and export.
Reviews
The pattern is clean. People who get through setup become long-term advocates and call Northbeam their standard for all attribution. People who don't never last long enough to write a positive review, and the handful of critical entries are all about onboarding, not the product afterward. Read the praise and the compliment is always the same: it tells them what's actually making money so they can scale what's profitable. Read the complaints and they're always complexity and cost, never accuracy.
Bottom line
The strongest pure attribution engine here for large ecommerce spenders. The gaps are everything after the measurement — no blended view, no budget execution, MMM sold separately.
Best for: Shopify-native DTC brands that want revenue, spend and margin in one dashboard without building a data stack to get there.
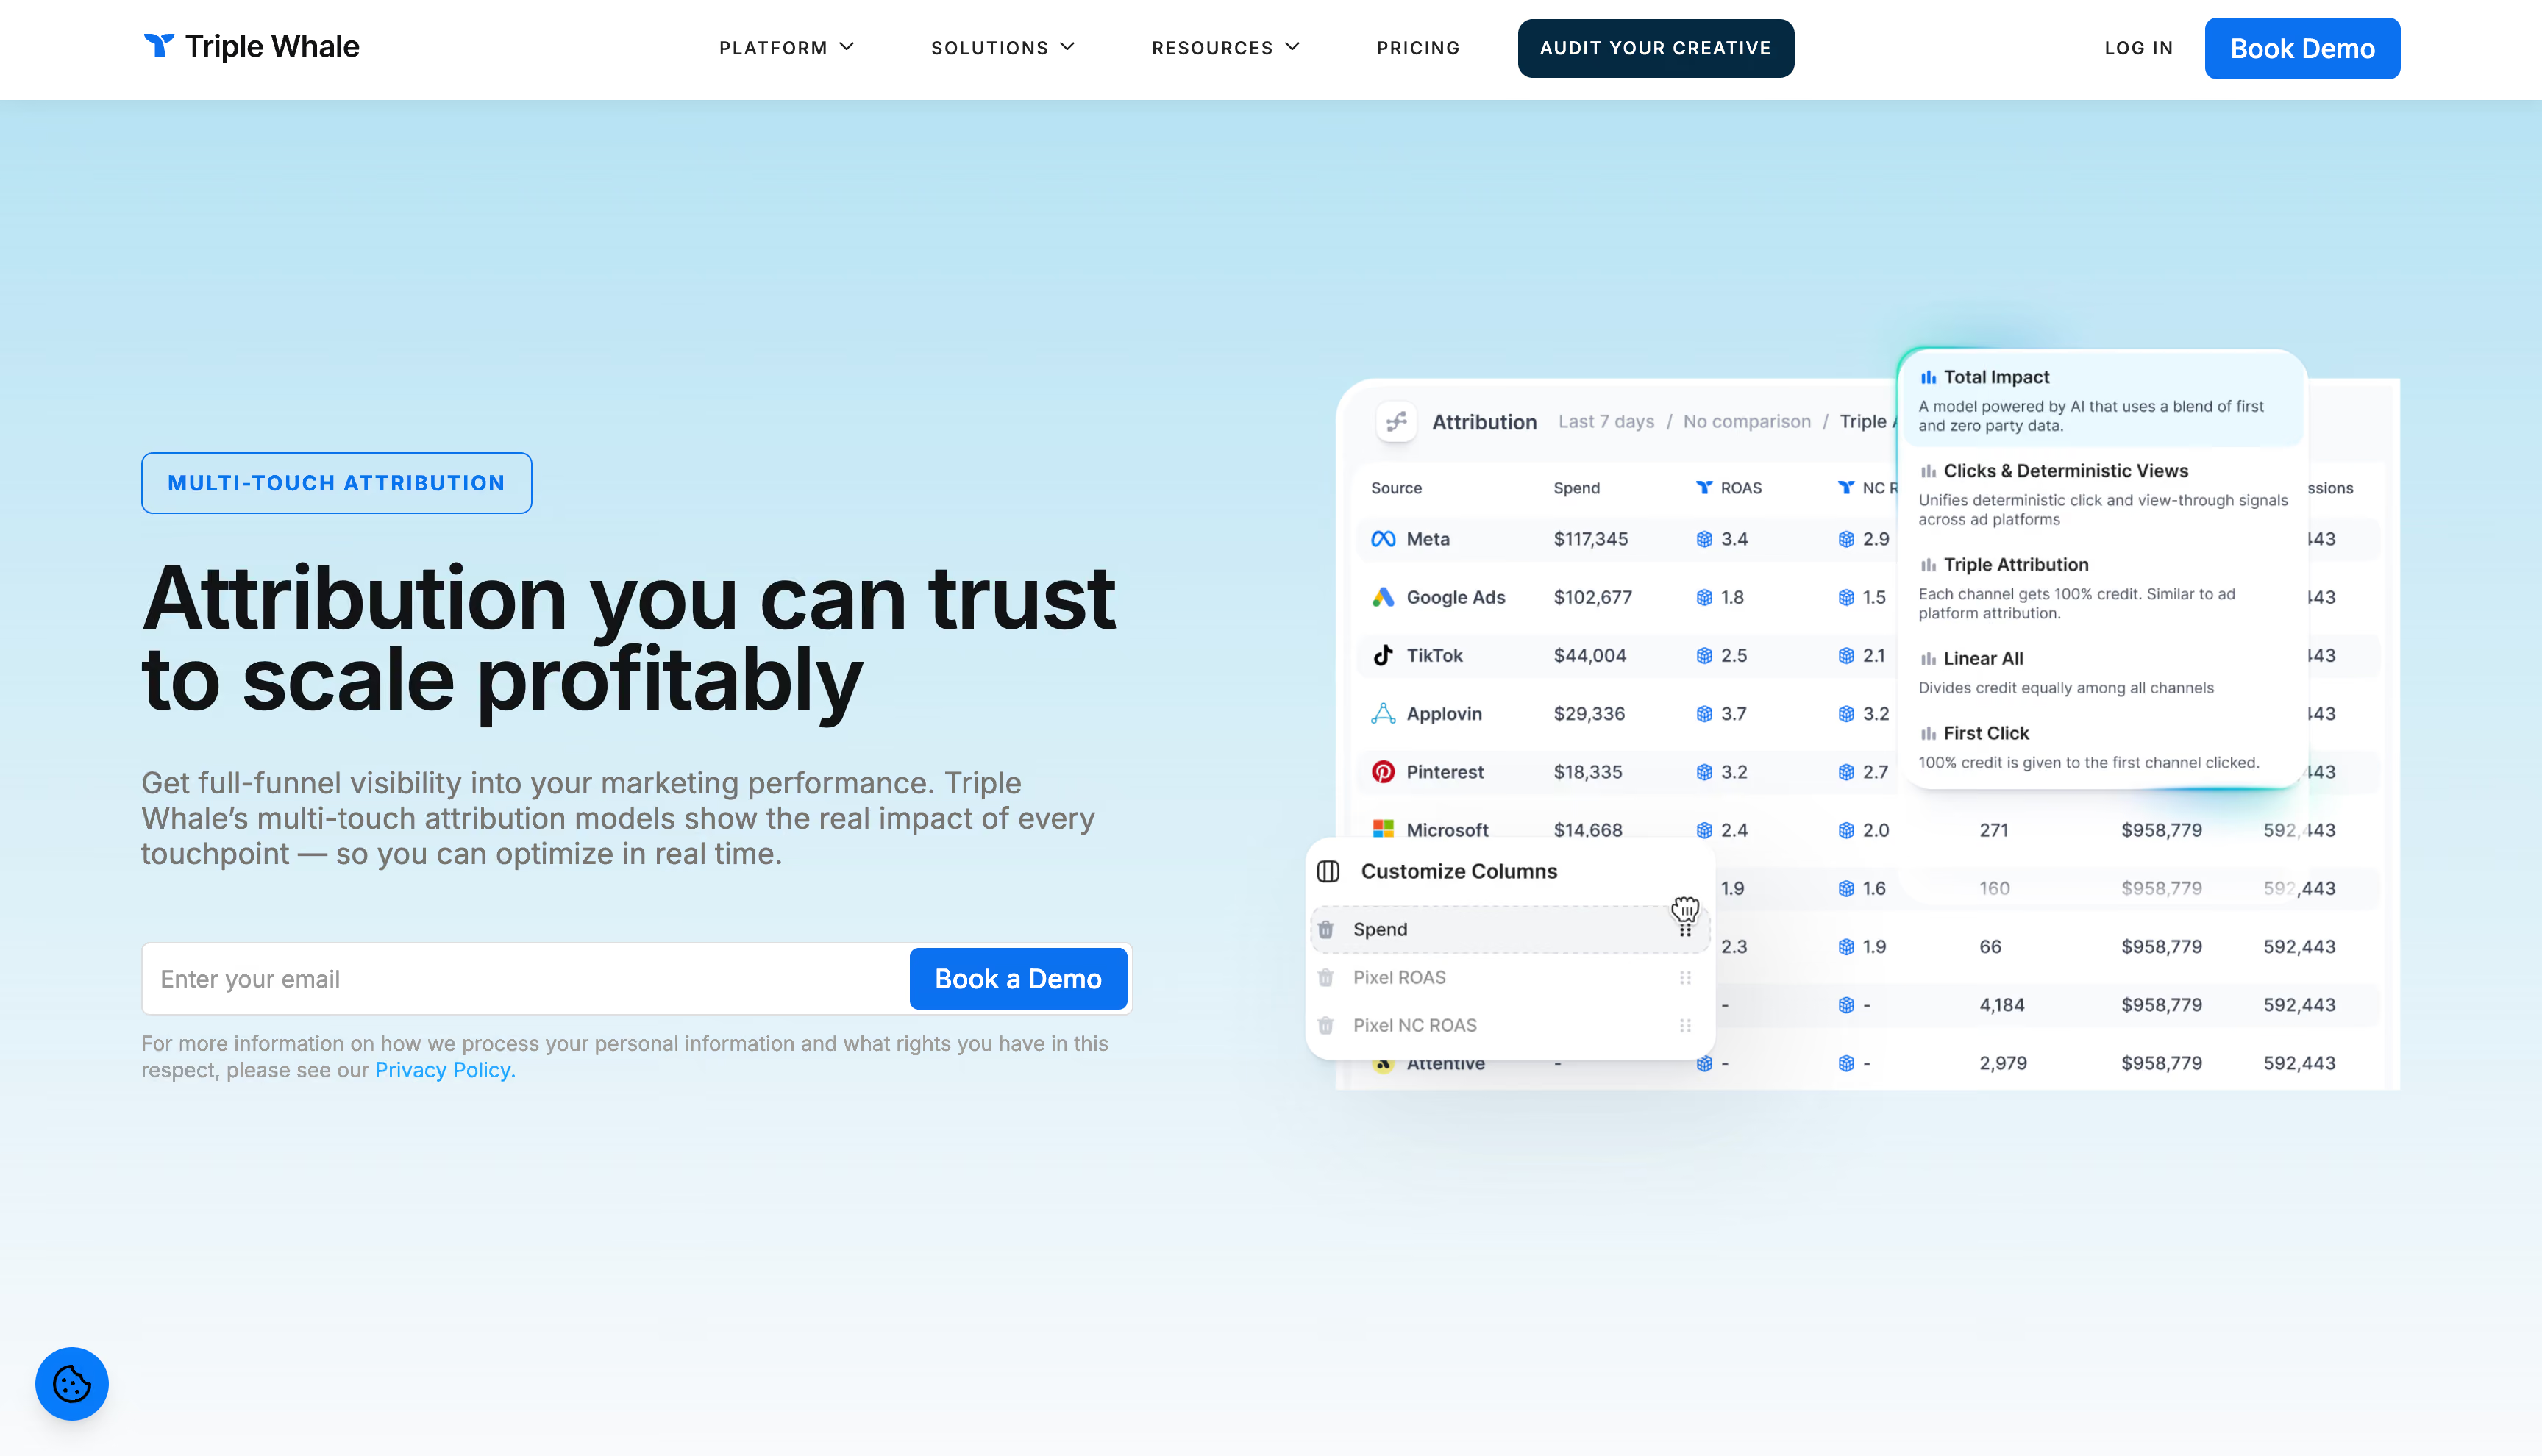
Triple Whale started in 2021 as a real-time ROAS tracker for Shopify stores and grew into a full ecommerce intelligence platform. Storefront, ad platform and customer data land in one view, with a first-party pixel underneath and an AI assistant, Moby, on top. The pitch is consolidation: stop tab-switching between Shopify, Meta and Google, get one number. For a brand running Shopify plus three ad channels, that's a real upgrade over spreadsheets. The harder question is what happens when order volume climbs and the channel mix stops being simple — and that's where the reviews start pulling in opposite directions.
Key features
▪Triple Pixel. A first-party tracking script that attributes orders to their source channel, positioned as a workaround for iOS 14 and cookie loss.
▪Multi-touch and Total Impact attribution. Blends pixel data, platform APIs, and post-purchase survey responses into one credit model.
▪Post-purchase surveys. Self-reported "how did you hear about us" data to catch word-of-mouth and dark-funnel discovery.
▪Moby. A chat-based AI assistant for querying store and campaign data without building a custom dashboard.
▪Cohort, LTV, and product-level analytics. Subscription cohorts, repeat-purchase behavior, and margin by product or SKU.
▪Compass add-on. Marketing mix modeling and incrementality testing, sold on top of the base plan.
▪Integrations. Shopify, BigCommerce, and WooCommerce on the commerce side; Meta, Google, TikTok, Snapchat, Pinterest, and Microsoft Ads on media; plus Klaviyo, Recharge, Gorgias, and warehouse exports to BigQuery and Snowflake.
Strengths
Single dashboard for Shopify, ad spend, and blended ROAS. Removes the manual spreadsheet-matching many teams did before.
Real-time margin visibility. Allows founders to estimate net profitability rather than relying solely on vanity ROAS reported by individual ad managers.
Limitations
Attribution accuracy is the most repeated complaint. Marketplace and offline orders credited to paid campaigns with no on-site journey behind them, and support pointing at dashboard filters instead of the ingestion problem underneath.
Moby gets credit for direction but is repeatedly called buggy on complex queries.
Billing and cancellation come up too often to be noise. Annual contracts that resist cancellation, charges continuing afterward, slow refunds.
P&L stops at COGS. Product costs come in from the store; broader operating expenses don't. "Profit" here is a gross margin view, not contribution margin.
Pricing is called high relative to value by smaller stores and agencies, and complexity can outpace what a typical DTC brand needs for weekly budget decisions.
The pixel is client-side, and it doesn't feed the algorithms. Triple Whale doesn't pass pixel data back to Facebook to improve optimization, so it stays a dashboard for media buyers rather than a system that improves delivery. Without server-to-server conversion enrichment, the measurement layer and the bidding layer never talk.
Pricing
There's a free plan covering basic Shopify and ad spend data. Paid tiers scale with store GMV rather than a flat rate: entry plans generally start around $130–$220/month and climb steeply. One brand at roughly $6M annual GMV reported paying over $1,100/month on a mid-tier plan. Compass and some retention analytics are add-ons. Tiers move often, so confirm current numbers directly.
Reviews
Ratings split sharply rather than cluster in the middle. Users who land on a clean data setup and a good support rep call Triple Whale their source of truth for daily spend decisions; users who don't describe attribution numbers they can no longer trust and contract terms that make cancellation hard. Several long-term customers admit they're staying for sunk cost in built-out reporting, not because they'd choose the platform again today.
Bottom line
Strong for a Shopify brand that wants consolidated reporting and can live with a dashboard that observes rather than acts. Weak if Amazon is material, if you need measurement to improve ad delivery, or if you want profit calculated below the gross margin line.
Best for: mid-market and enterprise advertisers spending $50K+/month who want behavioral session-level attribution paired with automated budget rebalancing.
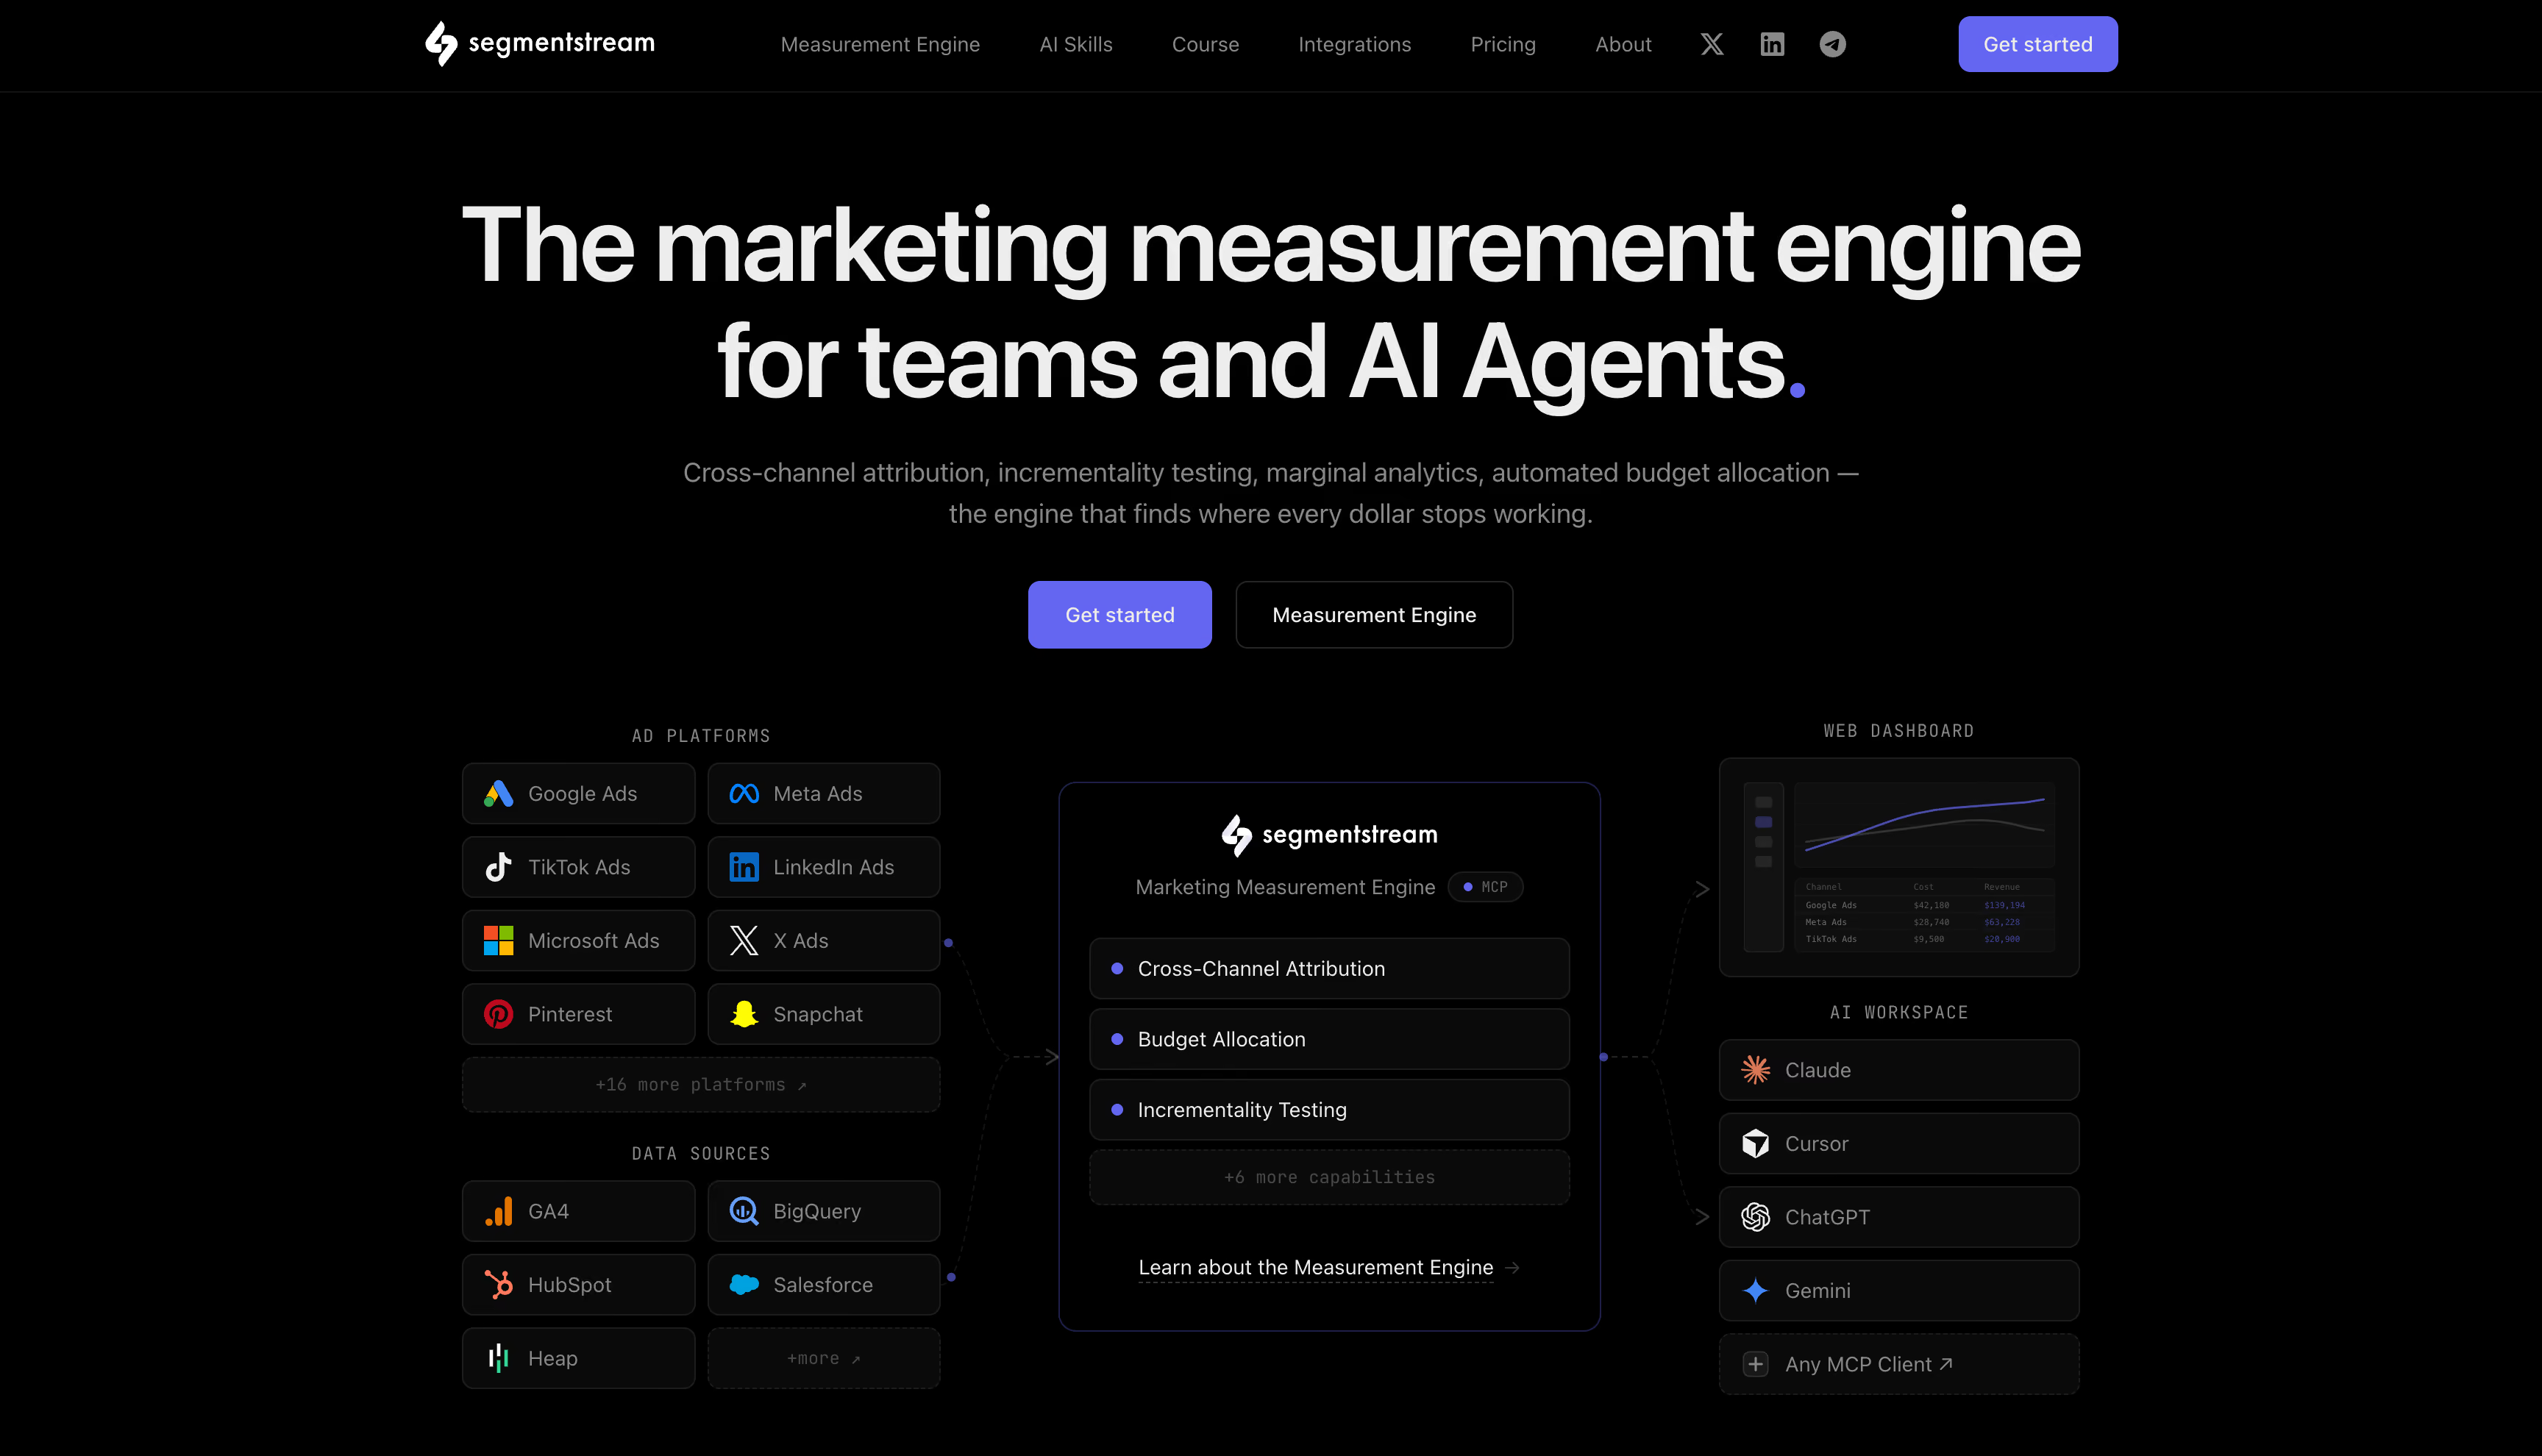
Most attributions assign credit by position in the journey. SegmentStream scores every individual site visit for how much it moved conversion probability, then distributes credit by that score. Reviewers single it out as something they hadn't seen anywhere else. The output doesn't stop at a report. Predictive conversion signals get pushed back into Google and Meta, and the platform runs weekly budget reallocation across ad platforms. That places it at the upper end of the market: custom pricing, expert-led onboarding, and a spend floor that rules out smaller advertisers.
Key features
▪Behavioral session scoring, evaluating every visit for incremental lift rather than crediting by fixed position.
▪Predictive conversion signals fed back into Google and Meta bidding.
▪Automated weekly budget rebalancing, recommended and, with approval, executed across platforms.
▪Cookieless, consent-aware measurement, plus a native MCP server letting AI agents query attribution data directly.
Strengths
Support is consistently hands-on — fast responses, named account contacts, and a team willing to re-explain the model until it clicks; the most frequently cited reason customers stay.
Surfaces upper-funnel channel value that last-click hides — multiple accounts use SegmentStream specifically to justify prospecting and awareness spend other tools credited at zero.
Fast to get live — implementation is described as quick relative to other enterprise measurement platforms, with more than one account noting it didn't require a developer.
Feeds decisions, not just dashboards — the predictive-conversion and budget-rebalancing layer makes the output closer to a recommendation than a report, which several long-term users value over Google's data-driven attribution.
Limitations
The core method depends on seeing a click. A reviewer states the constraint precisely: the most differentiated part of the approach requires a site visit. There's an MMM for no-click media, but by that same customer's account it's less distinctive than the behavioral engine. If a large share of your media is impression-only, you're buying the weaker half.
No ecommerce profit layer. No COGS, returns, SKU margin or cohort LTV against product mix. Budget optimizes toward conversions and revenue rather than contribution margin, so a high-return-rate SKU can win an allocation it shouldn't.
No real-time data, plus flagged gaps for specific campaign types, video in particular.
Steep learning curve — the model and its terminology are hard for non-technical stakeholders to grasp unassisted; several accounts lean on the SegmentStream team to interpret their own data.
Reporting flexibility lags the analytics — comparing custom date ranges, filtering by specific metrics, and getting real-time (rather than near-real-time) data are recurring friction points.
Pricing
Nothing is published. SegmentStream sells as a custom, expert-led engagement rather than a self-serve subscription, with onboarding and ongoing measurement support built into the contract. It's positioned for teams spending at least $50K/month on paid media, with a stated sweet spot closer to $100K+. Below that, the platform plus its optimization layer costs more than it can plausibly return.
Reviews
The consistency is almost entirely about people rather than software. Review after review names the account team, praises their patience, and describes them as the reason the tool produces value. The most repeated single compliment is that they'll explain the methodology as many times as it takes. That's a genuine strength and a signal worth reading carefully. When a measurement platform's most praised feature is the humans who interpret its output, the product is doing less of that interpretive work on its own than the marketing suggests.
Bottom line
Segment rebalances budget, which most of this list doesn't — but it optimizes toward revenue with no COGS, returns or margin underneath. Weakest where revenue depends on impressions, product margin, or marketplace channels.
Best for: media buyers running manual bid strategies on large daily budgets who need attribution that updates in near real time.
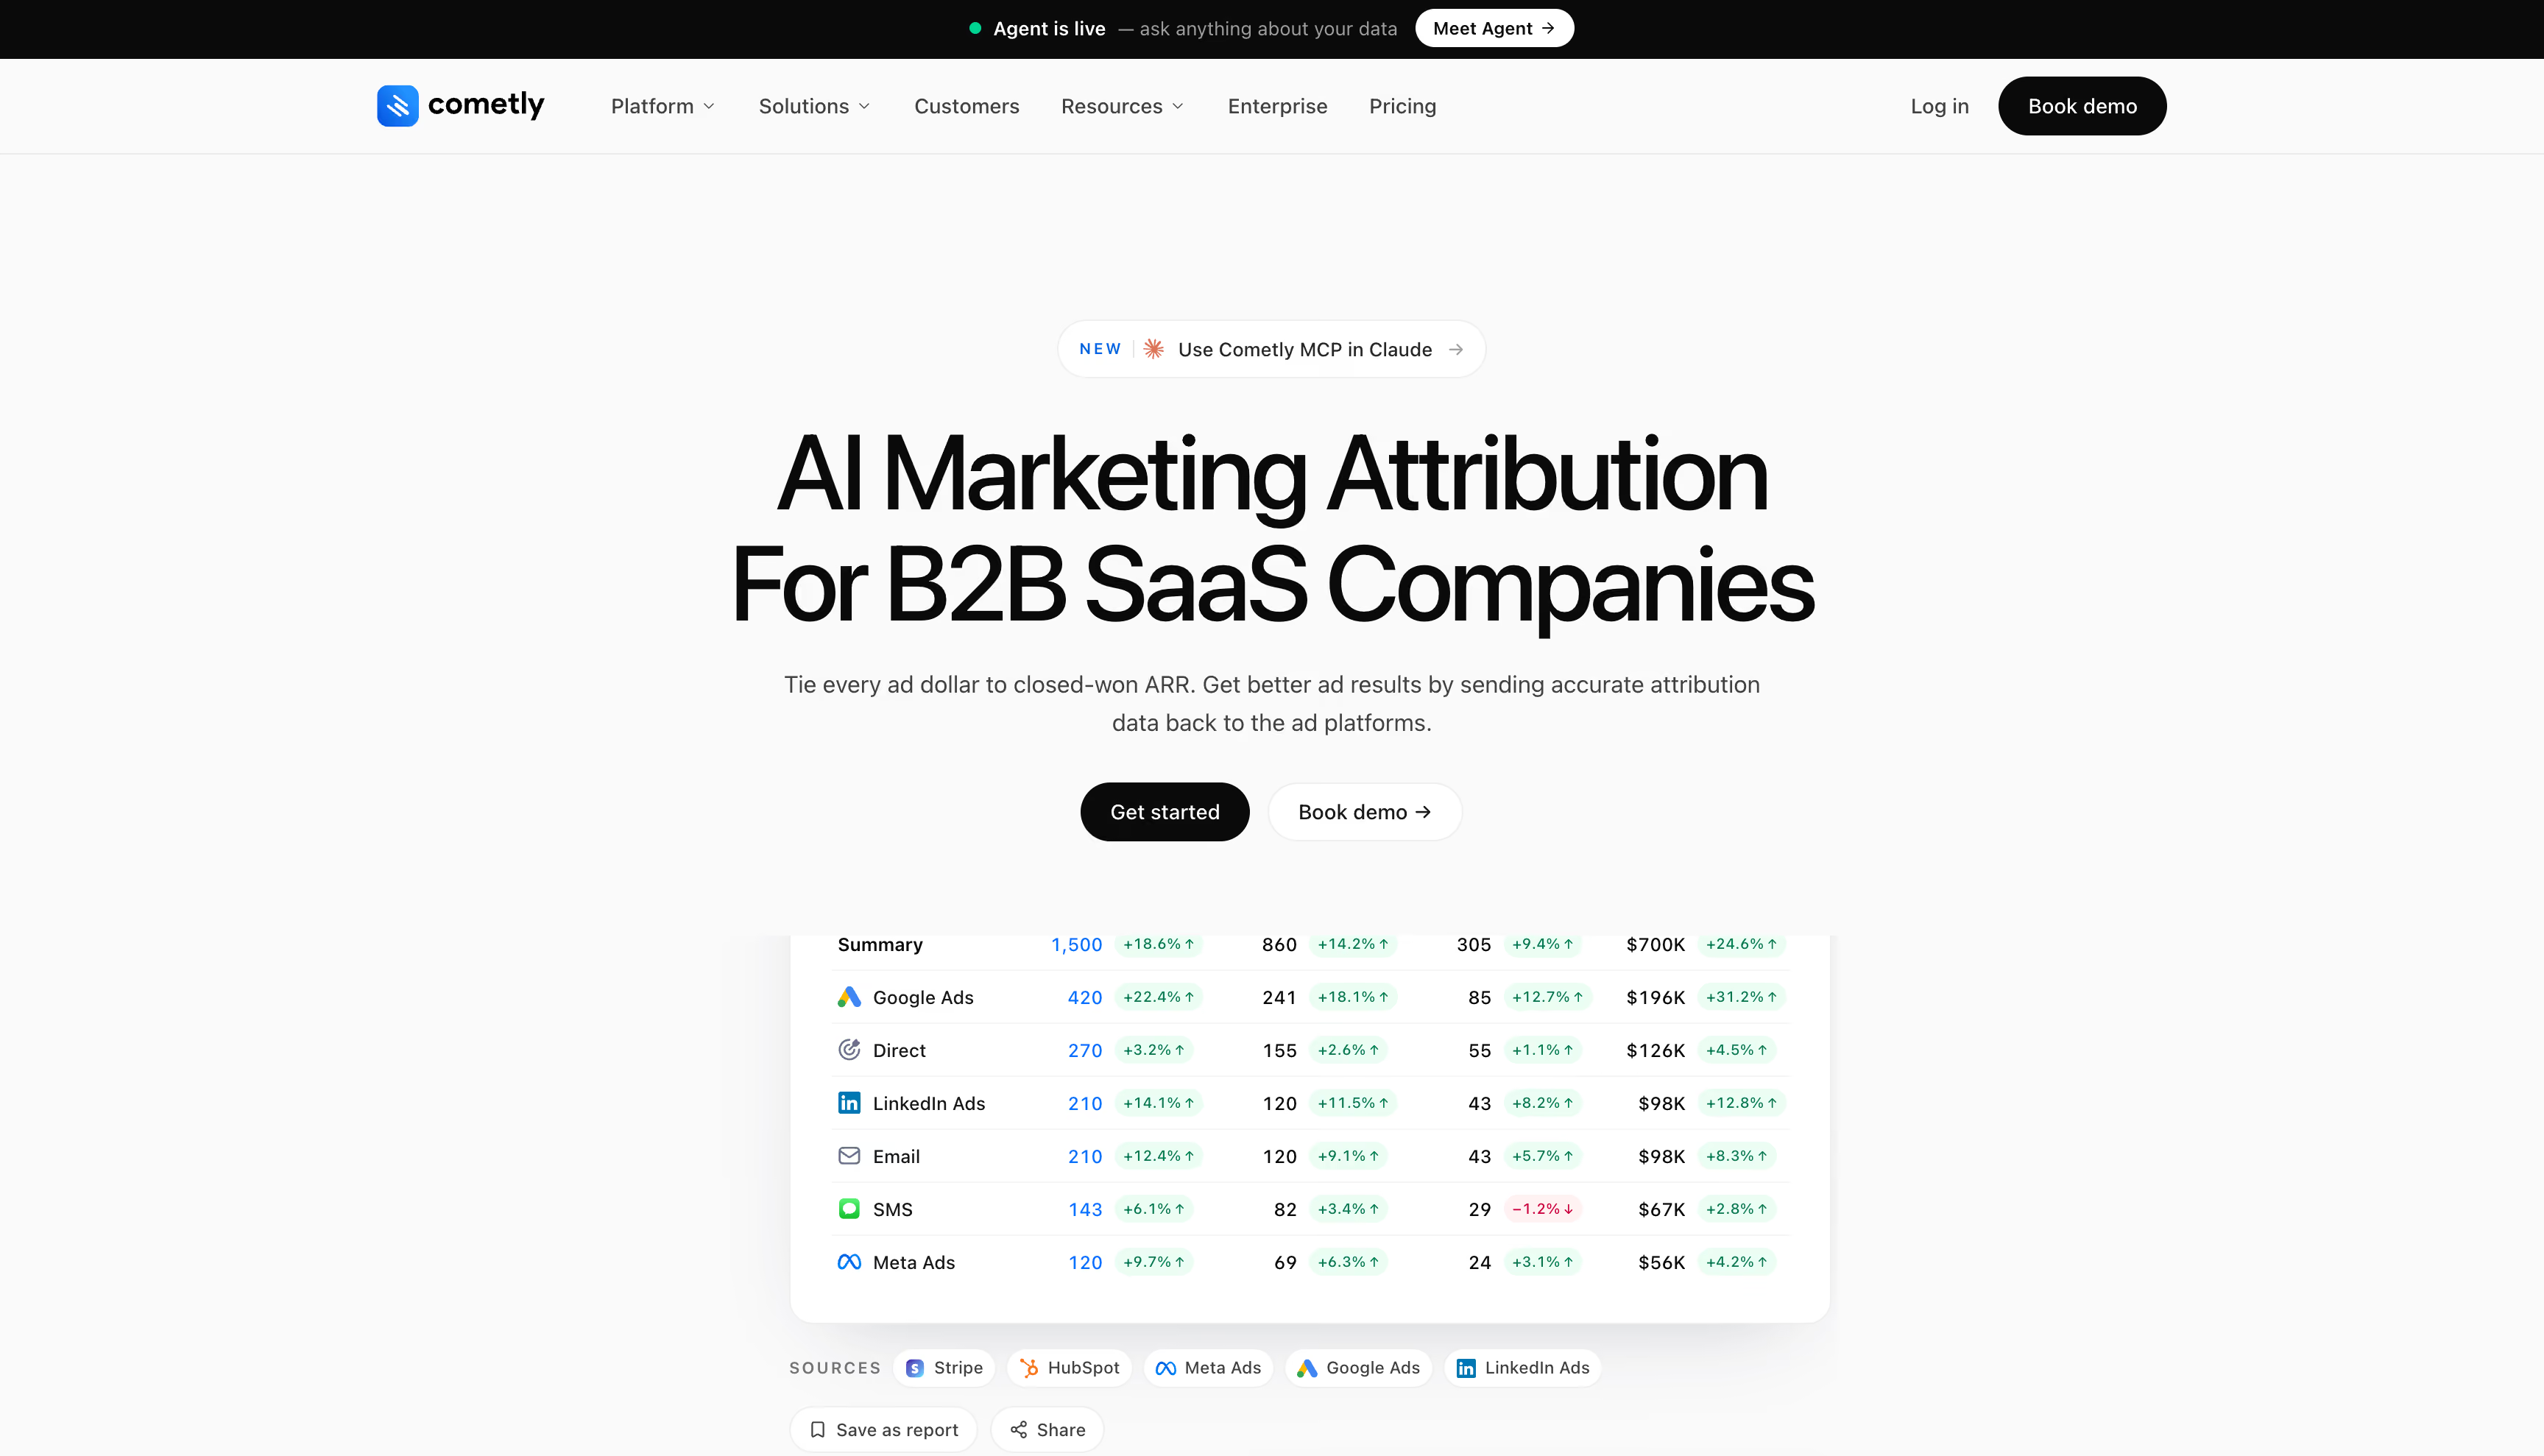
A media buyer spending five figures a day opens Meta Ads Manager and sees a fraction of the purchases. Shopify tells a completely different story: real revenue, real orders, none of it visible where the bidding decisions get made. That gap is what Cometly exists to close. The platform pairs a cookieless, server-side pixel with CRM and Stripe data to stitch the path from ad click to paid customer, then feeds enriched conversion data back into Meta, Google and LinkedIn so the algorithms optimize against real outcomes. It started with ecommerce media buyers scaling Meta spend and has widened into B2B SaaS revenue attribution.
Key features
▪Comet Pixel + server-side tracking. A fingerprint-based, cookieless pixel tracks visitors across devices and ad blockers, stitching sessions from first touch through conversion even weeks later.
▪Conversion Sync (offline conversion API). Sends enriched, CRM- and Stripe-backed conversion events back to Meta, Google, LinkedIn, TikTok, Microsoft, Reddit, and Snapchat, so ad platform algorithms optimize toward customers who actually paid.
▪Multi-touch attribution modeling. Runs across eight models (first-touch, last-touch, linear, data-driven, and others), tying every pre- and post-form touchpoint to closed-won revenue.
▪Stripe revenue attribution. Trials, MRR, expansions, and LTV connect directly back to the ad, campaign, and keyword that produced them, closing the loop between spend and cash collected.
▪CRM two-way sync. Native, bidirectional integration with HubSpot and Salesforce keeps pipeline and closed-deal data flowing both directions.
▪AI Ads Manager and AI Chat. A conversational interface surfaces campaign-level insights and budget recommendations, flagging where spend should shift based on observed patterns.
▪Data warehouse export (Enterprise). Live syncs to Snowflake, BigQuery, and Redshift, plus an MCP server for AI agents to query attribution data directly.
Strengths
Attribution accuracy beats native ad-platform reporting for users who get it running smoothly. One brand cited attribution roughly 30% higher than Facebook's native reporting, closer to what actually shows up in Shopify.
Real-time data supports aggressive manual bidding. The half-hour data refresh cycle matters most to media buyers running manual bid strategies, where waiting a day for accurate numbers means guessing with real budget.
Setup is fast for standard Meta and Google stacks. Several reviewers describe accurate tracking live within days, no in-house developer needed.
Feeds Learning Models. Enriches ad platform algorithms with offline/first-party conversion data to improve targeting.
Limitations
The scope is narrow by design. Direct-response paid ad tracking, done well. No P&L reporting, no MMM, no incrementality testing, no cohort or return analytics. It answers "which ad produced this customer," not "what should next quarter's budget look like."
No profit layer. COGS, shipping, fees and returns aren't modeled, so a campaign optimized in Cometly is optimized toward revenue, not margin.
Inconsistent & Slow Customer Support. Multiple users cite long wait times (24+ hours or days) and unhelpful support articles when technical issues occur.
A 12-month contract and a $1,500 onboarding fee, with no free trial. The first-year cost of finding out whether it works is high.
US-hosted, with no EU residency option.
Pricing
Tiered and usage-based rather than per-seat. Core starts at $750/month for up to 50,000 monthly sessions and five seats, rising to roughly $1,349/month at 150,000 sessions, $1,949/month at 300,000, and around $3,149/month approaching a million. A one-time $1,500 onboarding fee applies on top. Both tiers include unlimited platform connections and server-side conversion API. Enterprise is quote-based for businesses spending over $5M/year on digital ads. Annual billing saves 20%.
Reviews
The enthusiastic reviews come overwhelmingly from one persona: media buyers managing seven- and eight-figure accounts who describe the stress of spending thousands a day while seeing a fraction of purchases attributed. For them the half-hour data pull is the whole value proposition. The dissenting reviews are fewer but pointed, and cluster on two things rather than accuracy: support that's hard to reach, and pricing that feels steep for a tool that isn't an all-rounder.
Bottom line
An excellent instrument for one job, priced like a platform. If your problem is live tracking accuracy for manual bidding, it's a strong buy. If you need profitability or planning, it isn't the tool.
Dreamdata
★4.7
Best for: B2B SaaS and tech companies with long, multi-stakeholder sales cycles that need marketing touchpoints tied to pipeline and closed-won revenue.
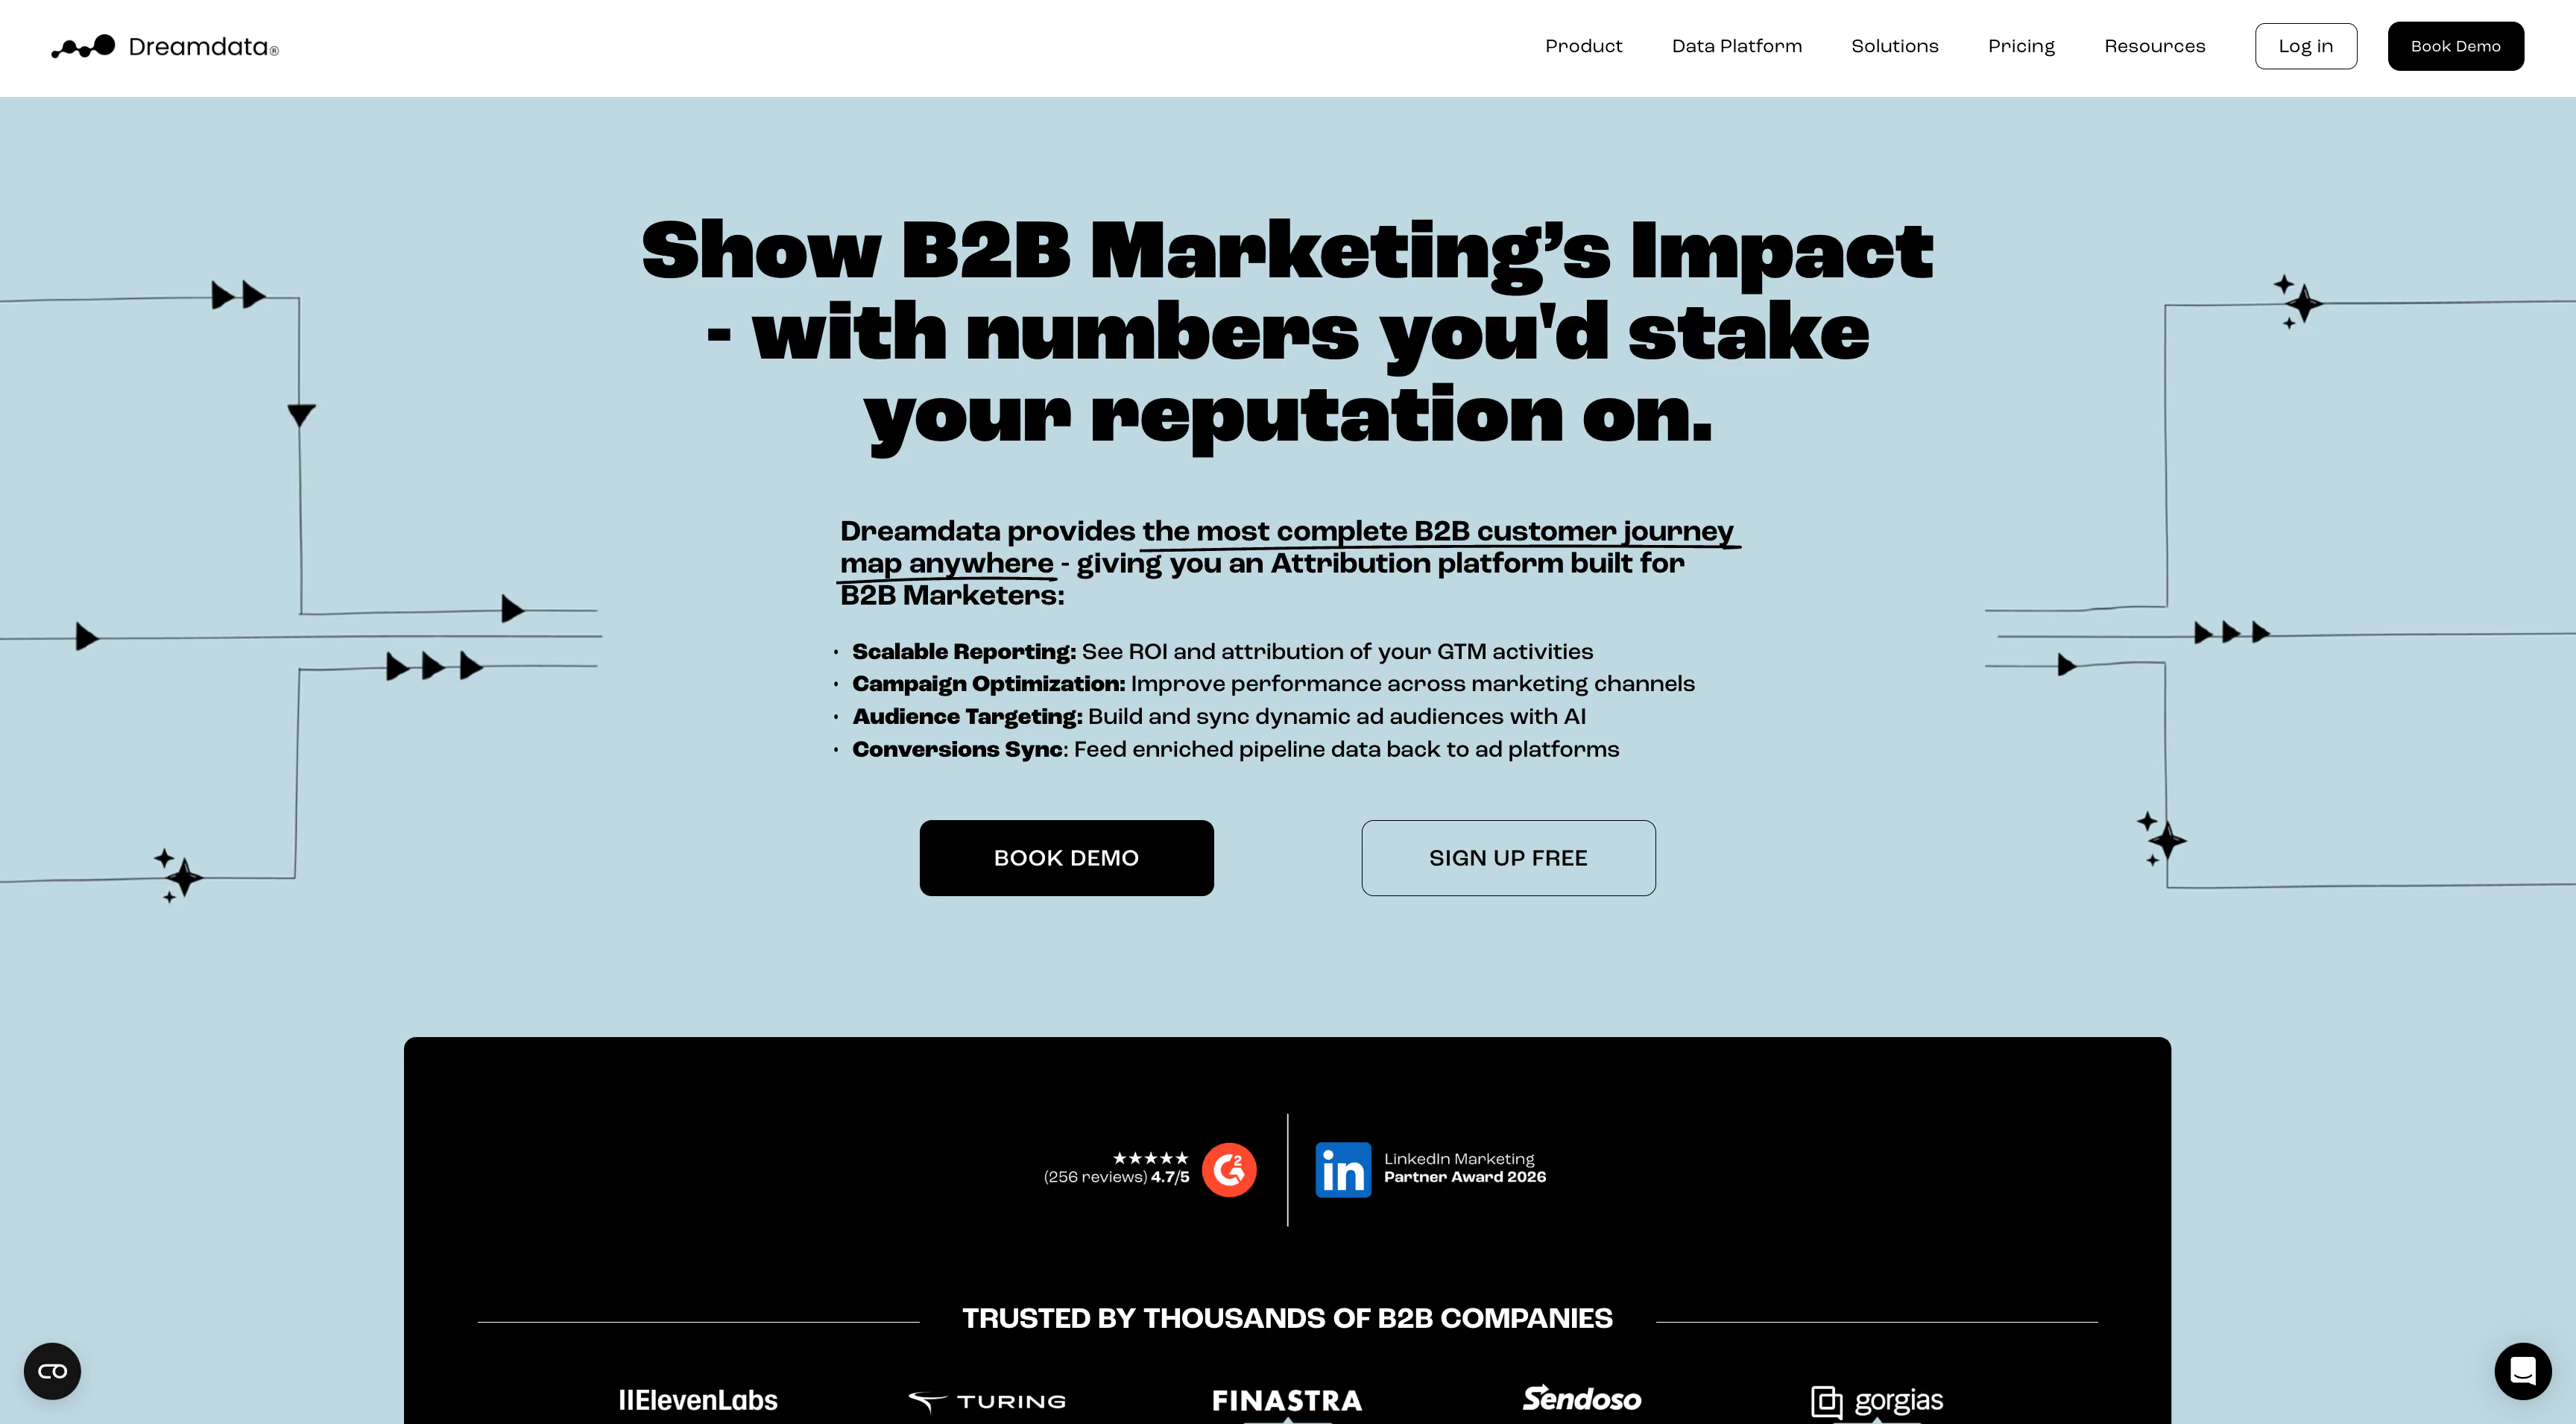
Dreamdata is a Copenhagen-built B2B revenue attribution platform. It pulls from the CRM, ad platforms, marketing automation and the website, joins everything into account-level journeys, and shows which touchpoints were actually present in the deals that closed. First anonymous visit to signed contract, with every stakeholder in between. What began as pure attribution has widened into a go-to-market data layer, with audience building, AI intent signals and ad platform activation now sitting alongside the core reports.
Key features
▪Multi-touch, account-level attribution across the full buying committee rather than first or last touch.
▪Customer journey visualization mapping every touchpoint per account or deal.
▪Native HubSpot, Salesforce, Pipedrive and Microsoft Dynamics integrations.
▪Audience Hub, building audiences from attribution data and pushing them to LinkedIn and Google.
▪Warehouse access to BigQuery and Snowflake on higher tiers, across 40+ integrations.
Strengths
Ties campaigns and content to revenue, not just traffic or MQLs — closing the gap most attribution tools leave open.
The account-level journey view is the standout feature: every stakeholder and touchpoint behind a won deal sits in one place, which gets marketing and sales looking at the same numbers.
Salesforce and HubSpot sync pipeline and revenue data with minimal friction once connected.
Audience Hub pushes attribution insight straight into LinkedIn and other ad platforms for retargeting, without adding a tool to the stack.
The free plan — web analytics, company identification, audience building — is a credible standalone option for teams not ready to pay for full attribution.
Limitations
Fundamental B2C / DTC Architecture Mismatch. Dreamdata is hardcoded around B2B CRM structures (leads, contacts, deals, pipeline stages). It completely lacks native e-commerce workflows like Shopify GMV tracking, SKU-level margin calculations, return/refund adjustments, or subscription cohort analytics.
No Server-Side Ad Platform Optimization (CAPI Gap). Dreamdata reports on attribution; it doesn't send enriched events back through Meta CAPI or Google Enhanced Conversions to improve bidding. The insight stays inside the platform.
No MMM, no incrementality testing, no budget execution. It tells you which touchpoints appeared in closed deals. It won't model saturation, run geo holdouts, or move a euro.
Heavy Technical Implementation & CRM Data Dependencies. Setup requires substantial developer time, pixel deployment, and precise CRM hygiene. If CRM fields or deal stages are misconfigured, the attribution output becomes instantly corrupted.
Steep-Tier Price Wall. Although a limited free plan exists, paid tiers scale up aggressively (starting around $750–$1,500+/month for advanced capabilities), creating a steep pricing hurdle for smaller brands.
Pricing
Dreamdata publishes its entry tier and nothing else. Free covers B2B web analytics, cookie and cookieless tracking, engagement scoring, Reveal and the audience builder, with no CRM-linked revenue attribution. Activation Starter is listed at $750/month and adds full 360° customer journeys, AI Signals and audience syncing. Advanced and Enterprise are quote-based on Monthly Tracked Users and CRM account volume. Third-party procurement data puts small-team annual spend around $15,000–$28,000, with mid-market deployments of 5,000–20,000 CRM accounts landing between $25,000 and $45,000 a year.
Reviews
Forty-one rated reviews averaging just above 4, and not a single one at or below 2. That's the most stable distribution in this comparison, and it says something specific: Dreamdata rarely fails outright, it just frustrates. The praise is uniform. People finally see which activity contributes to closed revenue, and support gets credited by first name for making a complex product workable. One reviewer who had used four or five attribution platforms called it far and away their favorite. The criticism is equally uniform, and it's all interface rather than architecture: UI inconsistency between reports, a learning curve that assumes analytical comfort, load times behind newer tools.
Bottom line
The strongest choice here for B2B pipeline attribution, and structurally the wrong tool for anyone selling physical products. If revenue arrives as orders rather than deals, this isn't a close call.Compare to Admetrics →
HockeyStack
★4.5
Best for: B2B marketing and RevOps teams with a technical owner who can build the data model, and the patience to get through implementation.
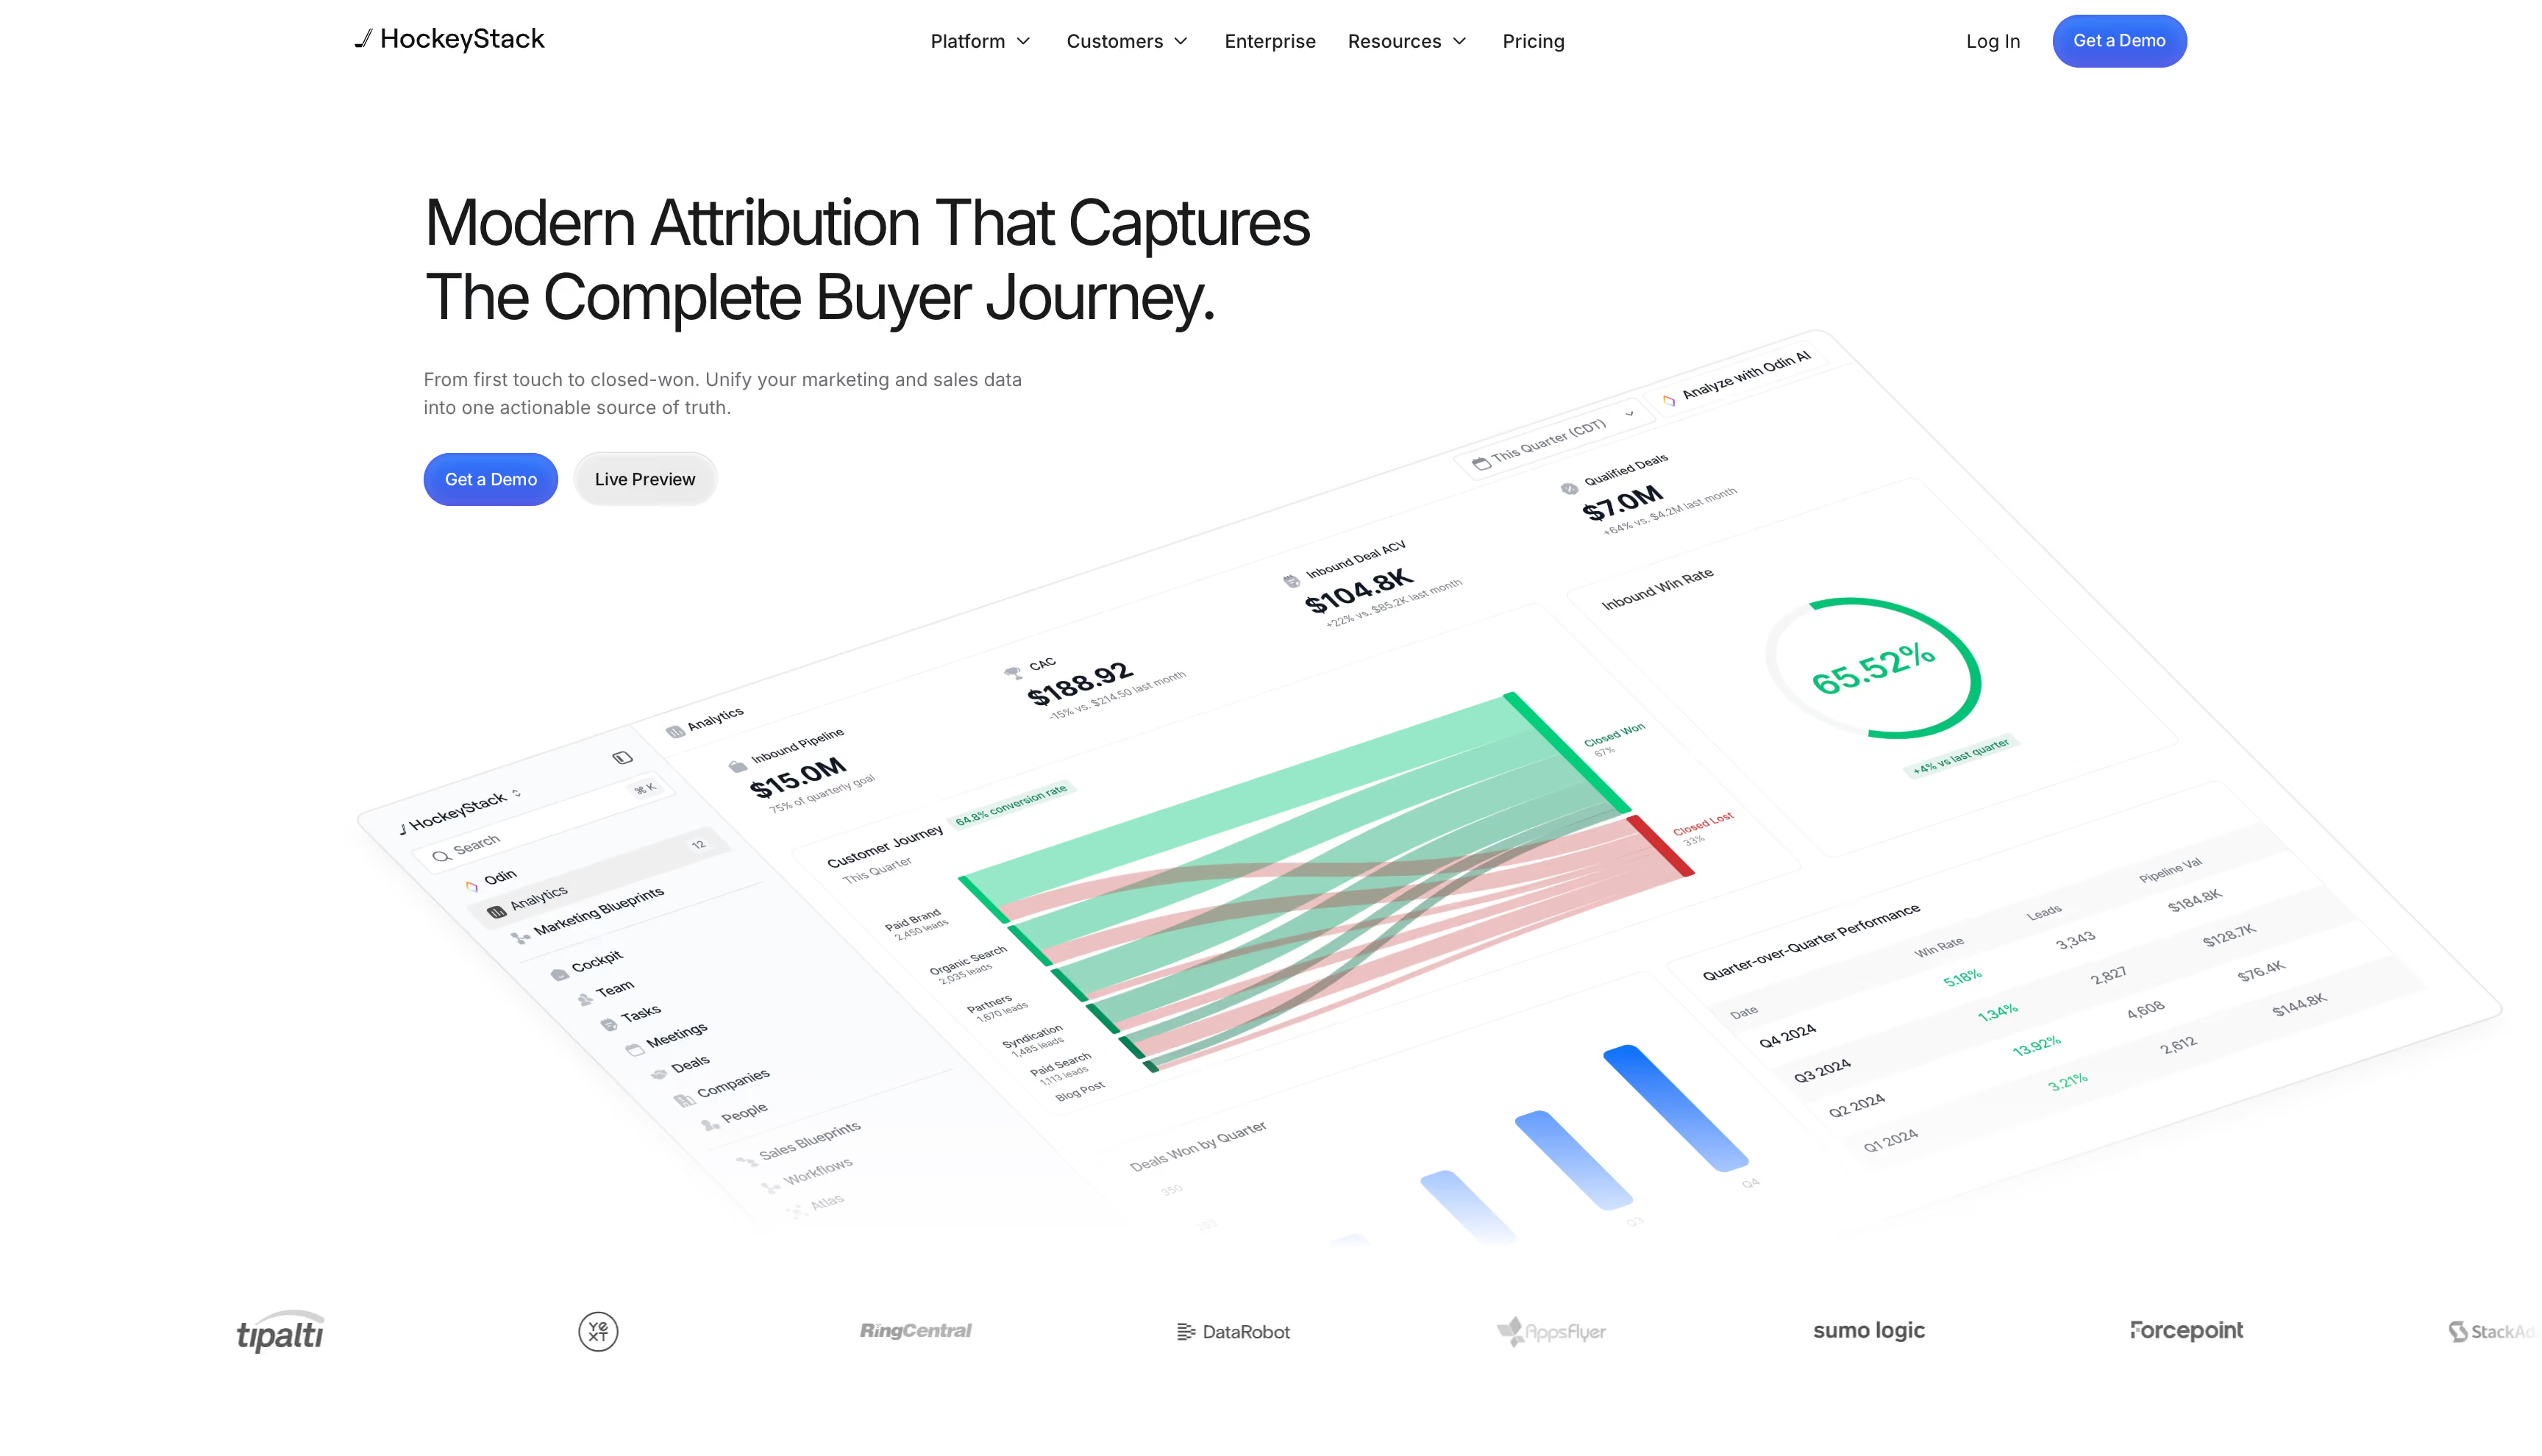
HockeyStack began as cookieless web analytics with multi-touch attribution and has repositioned as a "Revenue AI Platform" for B2B go-to-market teams. CRM, ad platform and website data get stitched into account- and contact-level journeys, with AI agents on top: Odin for analysis, Nova as a rep copilot, plus a set of Revenue Agents. The pitch is a single source of truth for what drives pipeline. Whether you get one depends almost entirely on how cleanly your own data model maps to HockeyStack's, and that fault line runs straight through the review set.
Key features
▪Full-funnel, multi-touch attribution. Tracks every buyer touchpoint (ads, email, website, content, sales activity) across the full journey, not just first or last click, with custom attribution models on top.
▪No-code dashboard builder. Reports and dashboards get built without engineering, with deep customization of segments, funnels, and goal definitions once setup is done.
▪Odin AI. A conversational analyst layer that answers ad hoc questions about pipeline, channel performance, and funnel velocity directly from HockeyStack's data.
▪Salesforce and HubSpot native integration. Attribution and account-journey data surface inside Salesforce itself, including an iFrame view so reps see engagement history without leaving the CRM.
▪Cookieless tracking. First-party, code-based tracking that holds up better under privacy regulation and ad-blocker adoption than cookie-dependent analytics.
▪Account and contact-level journey mapping. Consolidates every session, email open, ad click, and CRM event tied to a company into one view.
▪Revenue Agents. Newer AI-driven workflows aimed at applying a company's own winning patterns across prospecting, new business, and expansion — HockeyStack's push toward agentic GTM execution rather than pure reporting.
Strengths
Unifies Disparate B2B Systems. Solves B2B reporting constraints by consolidating ad networks, web analytics, and CRM records in a single interface.
Deep Account-Level Journey Mapping. Gives go-to-market (GTM) and Demand Gen teams visibility into complex multi-touch buyer paths across long sales cycles.
Attribution flexibility. Nearly every definition (channel, campaign, touchpoint, goal) is configurable, so the platform adapts to how a business actually operates rather than forcing a fixed model.
Limitations
That flexibility has a price, and the price is setup. Almost nothing works out of the box. Segmentations, goal definitions and touchpoint definitions get built from scratch, and multiple reviewers describe needing a technical SME on hand plus six months before they were moving quickly.
Data connectivity is the recurring failure mode, not a rare one. Several accounts never got past ingestion. One team spent January to April without working core dashboards, described their own systems as straightforward, made their demand gen, ops and data teams fully available, and still cancelled. Another spent two months and gave up.
No ecommerce model at all. No GMV, no COGS, no returns, no SKU margin, no product analytics. Reviewers also flag that it can't read sales volume as opposed to sales count.
No conversion feedback to ad platforms. It reads from them; it doesn't enrich them. Reviewers specifically ask to push insights back out into Salesforce and ad tools, and it isn't there.
No MMM, no incrementality. Attribution and reporting only.
Product direction is visibly shifting. As the company pushes into agentic AI, existing customers report the core attribution experience getting less attention — new features shipping while old bugs stay.
Pricing
No published self-serve pricing. Plans are quoted on tracked volume, integrations and support level, with third-party trackers listing entry packages around $2,200/month. Every tier includes CRM and ad platform integrations, a dedicated success team, and custom setup for complex data environments — which, given the implementation stories above, is less a perk than a necessity.
Reviews
Everything depends on one variable. Customers whose CRM and ad accounts mapped cleanly describe a genuine step change and stay enthusiastic years in. Customers whose data didn't connect describe months of unanswered questions and a cancelled contract. The concept isn't what's disputed — even the harshest reviewers call the attribution model sound. Execution is: connectivity, support bandwidth, and clarity during the pivot toward AI agents.
Bottom line
High ceiling, high variance. With a RevOps owner who can drive implementation and a clean CRM, the payoff is real. If you're hoping the vendor will carry that weight, read the one-star reviews before signing.
Ruler Analytics
★4.6
Best for: lead-generation businesses, agencies and B2B service companies where a meaningful share of conversions happen on the phone rather than in a checkout.
A prospect clicks a Google ad, browses, then picks up the phone. The deal closes three weeks later in a CRM. Google Ads sees a click that went nowhere. That gap is what Ruler was built to close. It's a closed-loop attribution and lead tracking platform aimed at high-touch lead-gen rather than ecommerce: capture visitor journey detail, map it to CRM records in Salesforce, HubSpot, Pipedrive or Zoho, then push closed revenue back into ad platforms and BI dashboards. Narrower than a full multi-touch suite, and the narrowness is the point.
Key features
▪Dynamic number insertion. Attributes individual phone calls to campaign, keyword, and source.
▪Form and live chat tracking alongside calls, so every inbound lead type feeds the same reporting layer.
▪Multiple attribution models. First-touch, last-touch, linear, time-decay, and U/W-shaped.
▪Visitor-level tracking with 60+ marketing variables captured per session.
▪Native connections to Google Ads, Microsoft Ads, Meta, TikTok, and LinkedIn for offline conversion upload, plus Zapier support for 500+ additional integrations.
▪Company-level tracking that identifies real businesses visiting the site, not just anonymous traffic.
Strengths
Unmatched for Lead-Gen & Phone Conversion. Fills critical tracking gaps for businesses where a significant portion of conversions happen via phone calls, chat, or sales reps rather than online checkout.
Broad CRM & Tech Stack Integrations. Out-of-the-box connectors for major CRMs and marketing automation systems make it easy to pass UTM data directly into deal records.
Responsive Support & Guided Onboarding. The customer support and account management teams receive high praise for hands-on assistance during setup and pipeline integration.
Cost-Effective Alternative to Enterprise Attribution. Provides robust closed-loop attribution at a price point significantly lower than enterprise B2B attribution platforms.
Limitations
It shows you the ends, not the middle. Several reviewers make the same point: you get first and last click, not a genuine end-to-end path. For a multi-touch view of a long consideration cycle, that's a ceiling rather than a UI complaint.
No MMM, no incrementality testing. Ruler measures what it observes. It doesn't model saturation, upper-funnel contribution or offline media, and won't tell you whether spend caused revenue or just preceded it.
Revenue-focused, not profit-focused. No COGS, return or margin layer, so "which channel drives revenue" never becomes "which channel drives profit."
The reporting layer is where most teams give up. A consistent pattern: teams pipe raw data into Looker Studio, BigQuery or their CRM and report there. The native dashboard is described as dated, slow, and thin above the lead level.
Not built for ecommerce. No cart integration, no SKU analytics, no spend management. Reviewers also flag a four-hour lag between a call landing and the CRM updating.
Pricing
Tiered by monthly website visits on 12-month terms, with a discount for annual billing. Small Business runs roughly £179–199/month at around 5,000 visits, Medium Business around £649/month at 50,000, Large Business around £1,149/month at 100,000, custom above that. Call tracking numbers and minutes bill as usage on top — the line item that surprises people.
Reviews
For phone-heavy businesses, nothing else here competes. Agencies name it as the tool they deploy when a client can't tie calls back to media, and the reviews reflect it: long-tenured customers who bought it for one job and got that job done. Support and onboarding come up constantly, and pricing sits well below enterprise B2B attribution platforms.
Bottom line
Buy Ruler for calls, forms and chat feeding a CRM. Don't buy it expecting a full multi-touch picture, a profit view, or a reporting layer you'll want to live in.
Funnel
★4.5
Best for: marketing and data teams running spend across many platforms who need a no-code pipeline into a BI tool or warehouse, and already have the reporting layer figured out.
Funnel isn't an attribution tool, and it's worth being clear about that before comparing it to anything else here. It's a marketing data hub and ETL platform: collect raw performance data from hundreds of sources, normalize it, hand it to whatever sits downstream. That job is genuinely hard and Funnel does it better than most — currencies converted, fields aligned, schemas consistent, refreshed on a schedule without anyone touching a spreadsheet. Whether that's what you're shopping for is a different question.
Key features
▪Marketing Data Hub — 600+ pre-built connectors across ad platforms, analytics tools, CRMs, and offline sources, with a data guarantee: if a connector doesn't exist yet, Funnel commits to building it.
▪No-code data modeling — custom dimensions and metrics, currency normalization, and field mapping without writing a query, so data lands in a consistent shape across every source.
▪Automated data refresh — scheduled syncs keep connected data current without manual re-pulls, the main mechanism behind the time savings most customers report.
▪Funnel Dashboards — built-in reporting for teams that want a lightweight visualization layer without standing up a separate BI tool.
▪Export destinations — native exports to Looker Studio, Tableau, Power BI, Google Sheets, Excel, and warehouses including BigQuery, Snowflake, and Redshift.
▪Advanced measurement (add-on) — optional attribution, incrementality, and marketing mix modeling layered on top of the data hub, sold separately from the core connectors-and-export product.
▪Activation destinations — pushes modeled data back out to platforms like Meta and Google Ads through their Conversions APIs.
Strengths
Eliminates manual spreadsheet reporting: Automates multi-channel data collection, saving teams hundreds of manual reporting hours.
Extensive connector coverage: Connects across niche advertising and sales platforms far beyond standard Google and Meta stacks.
User-friendly ETL layer: Enables non-technical marketing teams to clean and map complex data without dedicated data engineers.
Limitations
No native attribution. Funnel moves and cleans data. Attribution, incrementality and MMM are a separate add-on, and the core product has no opinion about which channel deserves credit.
No profit tracking. No COGS, returns or margin. Data in, data out, and the P&L logic lives somewhere else.
You still need the reporting layer. Teams budget for Looker Studio, Tableau, Power BI or Snowflake on top. Reviewers describe this as fine but under-communicated.
Flexpoint pricing escalates faster than people expect. Every connector, destination and refresh draws down credits. Reviewers report that needing several breakdowns for one data source multiplies its cost, that agencies burn allowances quickly, and that Tableau or Snowflake connections cost extra.
Pricing
Flexpoint-based and usage-driven rather than a flat monthly fee. Starter opens around $200/month with a limited connector set. Business, the recommended tier, runs roughly $800/month and opens the full connector library, warehouse exports and deeper transformations. Enterprise is custom. Every tier bills against a flexpoint allowance, and running out means paying more. There's no permanent free tier, just a 14-day trial. Reviewers consistently describe the real number growing faster than they modeled.
Reviews
The positive reviews are notably long-tenured — eight years, ten years, people who set it up once and stopped worrying about data collection. The compliment is always operational rather than analytical: it centralizes everything, the mappings hold, reports build consistently. The negative reviews aren't about whether it works. They're about the commercial relationship: pricing that climbs, support that's harder to reach, connectors disappearing without notice.
Bottom line
The right tool if your problem is getting data out of 40 platforms into one place. The wrong tool if your problem is deciding what to do with it, because that's a separate purchase, a separate skill set, and in Funnel's case a separate line item.
Google Analytics (GA4)
★4.5
Best for: an on-site behavior baseline, with a dedicated attribution tool layered on top for anything involving paid media budget.
GA4 is the default, and that's most of the story. Almost every website runs it, not because it's the best attribution tool available but because it's free, already installed, and switching means abandoning the only historical baseline most teams have. For on-site analytics — who visited, what they did — it still works. For attribution specifically, GA4 measures what happens inside Google's ecosystem considerably better than it measures anything outside it. That's not an implementation bug; it's a consequence of what data Google can see.
Key features
▪Event-based data model. Every interaction (pageview, click, scroll, purchase) is logged as an event with parameters, replacing the old pageview/session structure. Up to 300 custom events can be built directly in the interface without developer help.
▪Data-driven attribution. Google's machine-learning model assigns conversion credit across touchpoints based on observed behavior, now the default setting rather than an opt-in.
▪AI Assistant channel. A dedicated channel in acquisition reports isolates traffic arriving from AI tools like ChatGPT, Gemini, and Claude, separate from generic referral traffic.
▪BigQuery export. Raw, event-level data pipes into BigQuery for free on standard properties, giving unsampled data and retention beyond GA4's own 14-month cap in the UI.
▪Explorations. A custom report builder for funnels, path analysis, and cohort analysis, meant to replace fixed dashboards with something more flexible.
▪Predictive metrics. Purchase probability, churn probability, and predicted revenue surface automatically once a property has enough event volume and eligible conversion data.
▪Audience sync to Google Ads. Behavioral and predictive audiences built in GA4 push directly into Google Ads for targeting and remarketing.
Strengths
Free, universal, and deeply integrated with Google Ads. Attribution inside Search, Display and YouTube is native and needs almost no configuration, and the documentation and community are unmatched. For a business in its first year, it remains the most complete analytics tool available without spending anything.
Limitations
The interface fights the user, and reviewers are not gentle about it. The move from Universal Analytics broke muscle memory for a generation of marketers.
Standard reports sample data at scale. High-traffic properties hit the threshold in the UI, which quietly changes numbers depending on how a report is filtered. The unsampled version exists only once BigQuery export is configured separately.
Attribution structurally favors Google's own channels. Cross-device journeys, view-through conversions and Meta touchpoints consistently get less credit than the equivalent Google touchpoint. A reviewer describes the case exactly: email opened on phone, purchase completed on desktop, credited as organic.
The numbers don't reconcile. Against ad platforms, against other analytics tools, sometimes against itself. That alone disqualifies it as a single source of truth for budget decisions.
Support is effectively nonexistent on the free tier. No help line to call when something breaks; the fallback is documentation and community forums.
No MMM, no incrementality, no budget recommendation. GA4 reports what happened. It doesn't model what would have happened without the spend.
No profit layer of any kind. No COGS, returns, shipping or margin. Revenue in, nothing netted out.
Pricing
Free for standard properties, which covers the vast majority of implementations. Google Analytics 360 adds unsampled reporting at higher volumes, SLAs and support, priced custom at the enterprise level.
Reviews
The praise is narrow and always the same word: free. Beyond that, people credit it for high-level traffic monitoring and channel trends. Almost nobody praises the attribution. The complaints arrive in a consistent order. Data inaccuracy first. Attribution reliability second, with cross-device journeys splitting into disconnected sessions and non-Google channels undercounted. Usability third, and here the language gets emotional in a way no other tool here provokes.
Bottom line
Keep it. Nobody is suggesting you rip out GA4. But treat it as the on-site baseline it is, and don't ask it to arbitrate where next month's media budget goes, because it has a structural interest in the answer.
The top marketing attribution tools for 2026: final verdict
Most of the top marketing attribution tools for 2026 measure something real. What decides your budget is what happens next — whether the number becomes a move, or dies in a dashboard you interpret by hand every week.
Admetrics wins on that line. It's the one tool here that runs the whole chain for an ecommerce brand: server-side tracking that survives cookie loss, attribution carried through COGS and returns to profit per channel, an ML mix model that finds saturation, and budget execution that acts on it. Everything else stops short and hands you the last mile.
The alternatives earn their place for narrower jobs: Triple Whale for a fast Shopify ROAS picture, Northbeam for creative-level performance, Dreamdata and Ruler for B2B pipeline attribution, GA4 as the free baseline, Funnel for warehouse-native setups.
If you're an ecommerce or DTC brand deciding where next quarter's budget goes, Admetrics is the place to start. Book a demo, or run a two-week trial on live data and watch whether the profit picture changes which campaigns you'd scale.
++
Frequently Asked Questions
Which is the best software for tracking marketing attribution?+
Admetrics is the best marketing attribution software for ecommerce and DTC brands in 2026, because it closes the full chain most tools leave broken: server-to-server tracking that survives cookie loss, profit-level attribution down to SKU, ML-driven mix modeling, and automated budget execution. Tools like Triple Whale, Northbeam, or GA4 each cover a slice of that — Admetrics runs it end to end. The right pick still depends on your stack, so read the comparison above against your own channel mix.
What's the best AI-powered marketing attribution tool?+
Admetrics is the strongest AI-powered marketing attribution tool for ecommerce, and the reason sits underneath the AI rather than in it. PRISM4, its machine-learning mix model, isolates upper-funnel and offline impact and diagnoses saturation channel by channel — but a model is only as trustworthy as the data it reads. Admetrics runs on server-side tracking and profit-level attribution, so the AI reasons over recovered conversions and real margin instead of a thinning pixel dataset. That's the foundation its next AI layer is built on: Ava, an analyst you can ask profit and performance questions in plain language, and a native MCP server that will let assistants like ChatGPT or Claude query your attribution and budget data directly — both rolling out on top of the same clean signal.
What's the best marketing attribution tool for ecommerce?+
For ecommerce, Admetrics is the best marketing attribution tool in 2026 because it was built for the ecommerce P&L rather than adapted to it — COGS, shipping, fees, and returns are netted out before any channel is called a winner. That's the difference between a tool that reports revenue and one that reports profit. Shopify-native brands often start with Triple Whale for speed, but tend to hit its ceiling on profit depth and channel breadth.
What's the best attribution tool for a small business?+
The best attribution tool for a small business is the one that pays back the setup, so weight ease and price over model sophistication early on. Triple Whale and Cometly are common starting points for lean Shopify teams that need a fast, readable picture. Admetrics fits the moment growth makes profit-per-channel a real budget question and a shallow dashboard starts costing you money — usually the point where mis-allocated spend outweighs the subscription.
What's the best lead attribution software for B2B?+
For B2B, the best lead attribution software connects marketing touches to pipeline and closed revenue in your CRM, not to ecommerce orders — which puts Dreamdata and Ruler Analytics ahead of the DTC-focused tools on this list. Dreamdata suits account-level, buying-committee journeys in Salesforce or HubSpot; Ruler suits inbound teams where phone calls and form fills drive revenue. Admetrics is built for ecommerce and DTC, so it isn't the B2B answer here.
Which attribution model should you use?+
Start with the model your data can actually support, then upgrade. Single-touch models (first-click, last-click) are fast to read but systematically over-credit one end of the funnel, which is why most attribution modeling tools have moved toward multi-touch. The best attribution modeling for marketing weights each touchpoint by its measured effect on the odds of purchase rather than its position — but even the sharpest model is only as honest as the tracking underneath it, so fix data capture before you shop for a model.
Is GA4 enough for marketing attribution?+
GA4 is enough to start, not enough to run a paid-media budget on. It's free, near-universal, and genuinely good at on-site behavior — but its attribution favors Google's own channels, it loses visibility as consent opt-outs climb, and it stops at revenue, so it won't show you channel profit or where the next dollar should go. Most ecommerce teams keep GA4 for site analytics and add a dedicated attribution tool for cross-channel profit and budget calls. If Google Ads is your only real channel it stretches further; across Meta, TikTok, and CTV, the gaps show fast.