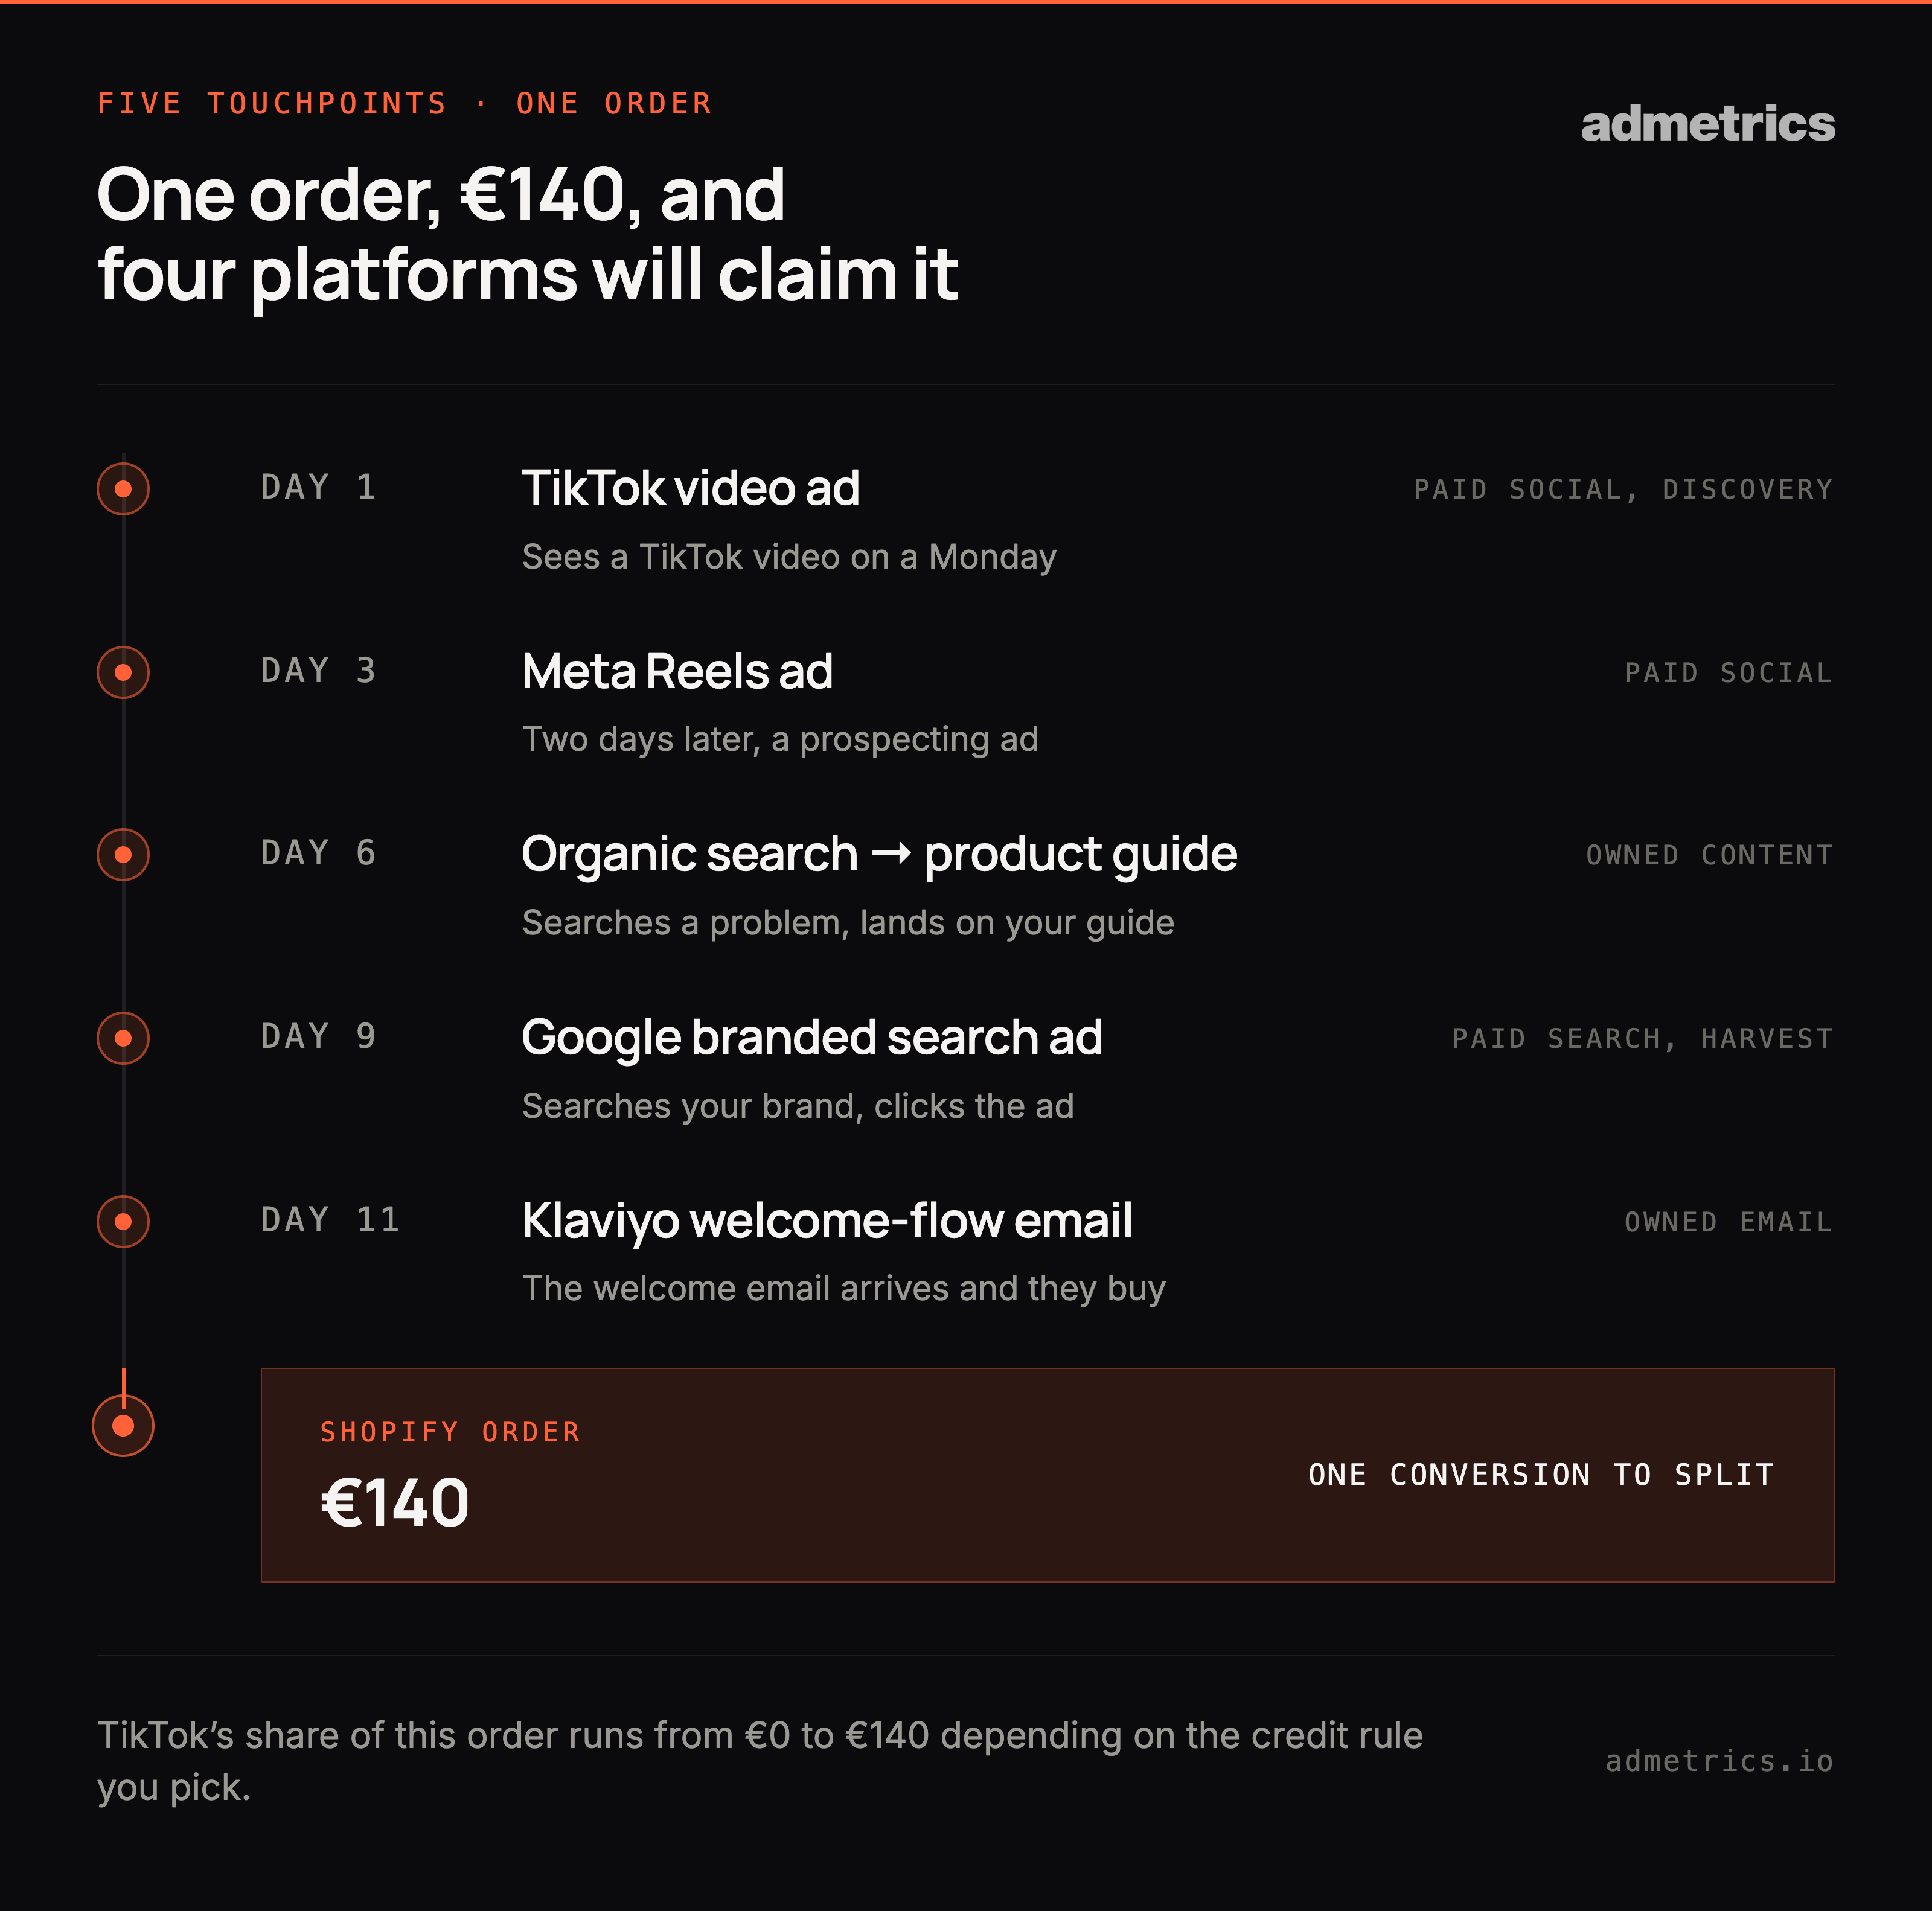
A customer sees a TikTok video on a Monday. Two days later, a Meta Reels ad. On day 6 they search a problem and land on your product guide. On day 9 they search your brand name and click the ad sitting above your own listing. On day 11 the welcome email arrives and they buy. One order, €140, and four platforms will claim it.
Multi-touch attribution (MTA) splits the credit for one conversion across every touchpoint on the path to it, instead of handing all of it to one. Each touchpoint gets a fraction of the order's value according to a rule you choose: equal shares, more weight to recent contact, more weight to the first and last. The split is a rule, not a discovery.
Every model below answers that order differently. TikTok's share runs from €0 to €140 depending on the rule, and that spread is still narrower than the one your untracked orders create. If you want the wider view first — how MTA sits alongside marketing mix modeling and experiments — start with the marketing attribution.
We're Admetrics. We help ecommerce brands measure their marketing independently and move budget toward what actually earns — attribution, marketing mix modeling and experiments on one side, contribution profit and governed budget allocation on the other. More than 100 brands run on it, on Shopify and Shopware.
This guide comes out of that work. The coverage figures, the reconciliation gaps and the model comparisons below are what we see in customer accounts, and the limitations are the ones we run into ourselves.
Key takeaways
- Coverage beats model choice. How many of your orders carry a usable source signal moves channel rankings further than the difference between linear and time decay.
- Every model weight is hand-picked. Nobody derived 40/40/20 from your data, or from anyone's.
- A model can only reallocate what it can see. At 77% tracked-order coverage, switching models redistributes credit inside 77% of your revenue and leaves the rest sitting in Direct.
- Revenue credit and margin credit crown different winners. A campaign at 4x return on ad spend can lose money while one at 2.5x makes it.
- MTA describes sequence, and sequence isn't cause. For cause you need a holdout or a marketing mix model.
- Last click answers a real question badly understood. It measures who closed the sale, and gets read as who earned it.
What is multi-touch attribution?
Multi-touch attribution splits one conversion's value across the touchpoints that came before it. Single-touch attribution asks which touchpoint closed the sale; MTA asks which ones were involved and what each is worth. The multi touch attribution definition stops there on purpose. It's a division rule applied to contact you managed to record, and the word "worth" is doing work the data can't verify.
Here's why that matters on a Monday morning. Your last-click report calls branded search and retargeting your best channels, so you move budget into both. Six weeks later new-customer growth has stalled while blended ROAS looks fine. Great ROAS, flat growth. You defunded the channels that created demand and fed the ones that collected it.
Single-touch vs multi-touch attribution
Single-touch models hand 100% of an order to one touchpoint. Last click is the ecommerce default, and it over-credits branded search, retargeting and email, because all three intercept demand that already exists. Someone searching your brand name has already been convinced by something; last click credits the interception and files the persuasion under Direct.
Paul Keil leads paid social and affiliate at The Quality Group, the company behind ESN and More Nutrition. He's blunt about what that costs you: "You will not get proper scaling done with a last-click model." Multi-touch attribution gives those earlier contacts a share, without telling you whether they earned it.
What multi-touch attribution isn't
Three limits shape everything below, and most multi touch attribution marketing content skips all three. MTA records sequence, so it can't prove cause: a customer who'd have bought anyway still walks a path, and every touchpoint on it still gets paid. It isn't a forecast either: credit assigned last month says nothing about what your next €10,000 into that channel returns. And it's never complete, because it models the orders that arrived carrying a usable signal and quietly absorbs the rest.
How does multi-touch attribution work?
MTA runs in four steps: collect the touchpoints, resolve them to one identity, anchor the path to the store order, then apply a credit rule. Three-quarters of the accuracy is decided before that last step runs, and the Shopify order ID is what makes it revenue you're attributing rather than sessions.
Where the touchpoint data comes from
UTM parameters are your own labels on your own links: cheap, fragile, and only as disciplined as whoever built the campaign. Click IDs (gclid, fbclid, ttclid) come from the platform instead, so they survive some of the cases where UTMs get stripped, and they tie a session back to a specific ad. Server-side events travel from your server to the platform through the Conversions API or its equivalent, outside the browser's restrictions, which is why they recover signal the pixel loses. Browser and server events have to share an event ID, or the platform counts the purchase twice.
Better signal changes delivery as well as reporting. Baby-products brand Ehrenkind ran its own pixel against a server-side one in comparable Meta campaigns and measured 60.3% higher ROAS, 25.2% lower cost per order and 19.8% higher order value, then moved every campaign over.
Coverage decides the answer before the model does
If 23% of your orders arrive with no usable source signal, no model can rescue them. It splits what it can see and reports the result with exactly the confidence it would bring to a complete one.
Here's a month at a store doing 2,000 orders on a €140 average order value.
| Order group | Orders | Share | What the model does with them |
|---|---|---|---|
| Usable click ID or UTM on a touchpoint | 1,540 | 77.0% | Modeled. Credit splits across the recorded path. |
| Session recorded, no campaign signal | 250 | 12.5% | Collapsed into Direct, or silently redistributed. |
| No analytics signal — consent declined, blocker, stripped parameters | 150 | 7.5% | Invisible. Never enters the model. |
| Impression only, never a click | 60 | 3.0% | Invisible to click-based MTA by design. |
| Total | 2,000 | 100% | — |
That's €215,600 of revenue inside the model and €64,400 outside it. The €64,400 doesn't leave your P&L. It leaves the report that decides next month's budget.
Call the limit it creates the coverage ceiling: whatever model you pick, it can only reallocate credit inside the orders it can see. At 77% coverage, moving from last click to position-based redistributes money across three-quarters of your revenue and leaves the remaining quarter exactly where it was.
The gap isn't theoretical, and it isn't evenly spread. Barefoot-shoe brand Freiluftkind ran a one-month parallel trial against the US attribution tool it had used for years and recovered 30% of the conversions that tool had missed, with the widest gaps on Meta and native, the two places where discovery happens. Campaigns that were working had already been switched off, because the old tool couldn't see them working. Discovery channels lose more signal than branded search does, so the channels you most want to evaluate are the ones coverage damages first. Check tracked-order coverage before you argue about models.
Multi-touch attribution models, run on the same €140 order
One order, 5 touchpoints. Every model below runs on that same journey in euros, so you can see how much money each rule moves and how arbitrary the weights behind it are.
| # | Day | Touchpoint | Type |
|---|---|---|---|
| 1 | Day 1 | TikTok video ad, prospecting | Paid social, discovery |
| 2 | Day 3 | Meta Reels ad, prospecting | Paid social |
| 3 | Day 6 | Organic search → product guide | Owned content |
| 4 | Day 9 | Google branded search ad | Paid search, harvest |
| 5 | Day 11 | Klaviyo welcome-flow email → purchase, €140 | Owned email |
Euro columns sum exactly to €140.00; the last row of each split carries the rounding difference. Percentages are rounded to one decimal and may not add to exactly 100.
Linear and time decay
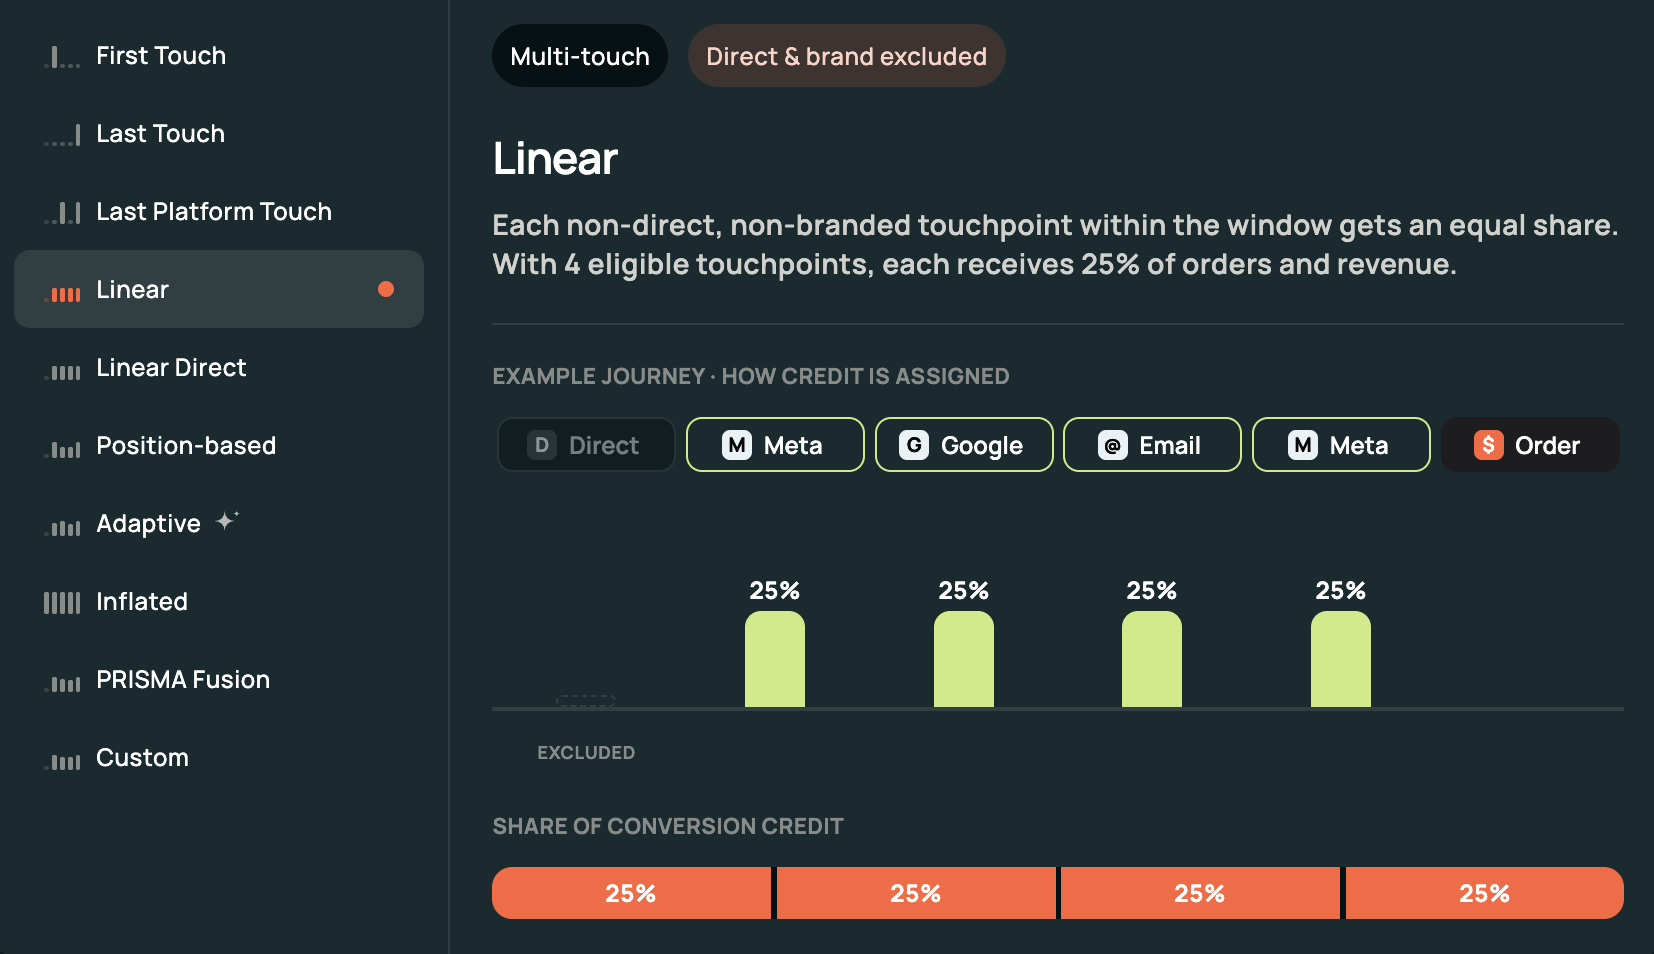
Linear splits the order equally: €28 each. It makes no claim about which contact mattered, which is its weakness and also its one use — read it as an assist report.
Time decay raises credit the closer a touchpoint sits to the purchase, and a half-life sets how fast. A touchpoint one half-life before the order is worth half a touchpoint at the order. With a 7-day half-life, weight = 2^(−days before conversion / 7), then each weight divided by the sum of all weights.
| Touchpoint | Days before order | Raw weight | Share | Credit |
|---|---|---|---|---|
| TikTok | 10 | 0.3715 | 11.4% | €15.98 |
| Meta | 8 | 0.4529 | 13.9% | €19.48 |
| Organic search | 5 | 0.6095 | 18.7% | €26.22 |
| Branded search | 2 | 0.8203 | 25.2% | €35.29 |
| 0 | 1.0000 | 30.7% | €43.03 | |
| Total | 3.2542 | 100% | €140.00 |
The half-life is the whole model. At 7 days the TikTok ad keeps 11.4% of the order. Drop to 3 days and it falls under 4%; stretch to 21 and it climbs past 20%. Nobody measured your half-life — you picked it, so pick it against your real journey length. Outdoor-gear brand Heimplanet sells at a €230 average order value, sees journeys run 7 to 14 days and often longer, and works on a 120-day window. A 7-day half-life there would price the tent ad at close to nothing.
Position-based (U-shaped)
40% to the first touchpoint, 40% to the last, the remaining 20% spread evenly across everything in between.
| Touchpoint | Position | Share | Credit |
|---|---|---|---|
| TikTok | First | 40.0% | €56.00 |
| Meta | Middle | 6.7% | €9.33 |
| Organic search | Middle | 6.7% | €9.33 |
| Branded search | Middle | 6.7% | €9.34 |
| Last | 40.0% | €56.00 | |
| Total | 100% | €140.00 |
Now ask where 40/40/20 came from. Nobody derived it from your data. It's an estimate of nothing — it encodes a belief that discovery and closing matter most and the middle is filler, and that belief gets repeated identically across most pages ranking for this term without one of them asking where the constants originated. W-shaped extends the same convention to 30/30/30/10. The belief suits ecommerce well enough to start from if you sell on discovery-led channels, but a convention is a poor place to stop. The Quality Group keeps the U-shape and weights new-customer, existing-customer and influencer touchpoints differently inside it, with a marketing-mix-modeled layer on top.
W-shaped and full path
W-shaped gives 30% each to the first touch, the lead-creation touch and the opportunity-creation touch, with 10% across the rest; full path adds the closing touch. Both were built for B2B pipelines with named CRM stages, and an ecommerce journey has no equivalent of an opportunity being created. Run b2b multi touch attribution against a real pipeline and they have a job; run them on a Shopify store and they impose a shape the data doesn't have.
Data-driven models
Data-driven attribution derives the weights from your own conversion paths instead of assuming them, usually through Markov chains, which measure what happens to conversions when you remove a channel from the graph, or Shapley values, which average a channel's marginal contribution across every ordering of the others.
Two cautions. They need volume to stay stable — on a few hundred converting paths a month the weights swing between refreshes. And a model you can't inspect is one you can't defend; when the CFO asks why TikTok moved 8 points, "the algorithm updated" ends the conversation badly.
The same order, six ways
| Touchpoint | First click | Last click | Linear | Time decay | Position-based | Data-driven* |
|---|---|---|---|---|---|---|
| TikTok (Day 1) | €140.00 | €0.00 | €28.00 | €15.98 | €56.00 | €33.60 |
| Meta (Day 3) | €0.00 | €0.00 | €28.00 | €19.48 | €9.33 | €25.20 |
| Organic search (Day 6) | €0.00 | €0.00 | €28.00 | €26.22 | €9.33 | €21.00 |
| Branded search (Day 9) | €0.00 | €0.00 | €28.00 | €35.29 | €9.34 | €16.80 |
| Email (Day 11) | €0.00 | €140.00 | €28.00 | €43.03 | €56.00 | €43.40 |
| Total | €140.00 | €140.00 | €140.00 | €140.00 | €140.00 | €140.00 |
One order, the same 5 touchpoints, and TikTok's credit ranges from €0.00 to €140.00 on nothing but the rule you picked. Across 2,000 orders a month, two equally defensible rules produce a six-figure disagreement about which campaigns to fund — and at 77% coverage every column above is splitting €215,600 rather than €280,000.
Admetrics in practice: Admetrics applies multi-touch attribution models to the recorded journeys rather than committing you to one fixed rule. Switch the model and every figure moves with it, each one drilling down to the individual orders behind it. The point isn't that a single model is correct; it's watching how much of your channel ranking survives the switch. See Multi-Touch Attribution.
Which multi-touch attribution model should you use?
Pick the simplest MTA model you can explain in a budget meeting.
Position-based suits discovery-led channels, because it pays the channel that created demand without pretending the middle does nothing. Time decay suits a consideration cycle under a week, with the half-life at roughly half your median time-to-purchase. Linear is a first look at assists, and nothing should be funded on it. Data-driven becomes worth running past a few thousand converting paths a month, provided you can inspect the output.
The same order in contribution margin
Every model above split revenue. None of the pages ranking for this term split profit, and the moment you do, the channel ranking changes without the model changing at all.
The €140 order isn't €140 of anything you can spend.
| Line | Amount | Share |
|---|---|---|
| Order value | €140.00 | 100.0% |
| Cost of goods | −€53.20 | 38.0% |
| Shipping and fulfillment | −€11.20 | 8.0% |
| Payment fees | −€2.80 | 2.0% |
| Returns allowance | −€14.00 | 10.0% |
| Contribution margin | €58.80 | 42.0% |
| Touchpoint | Credit on revenue | Credit on contribution |
|---|---|---|
| TikTok | €56.00 | €23.52 |
| Meta | €9.33 | €3.92 |
| Organic search | €9.33 | €3.92 |
| Branded search | €9.34 | €3.92 |
| €56.00 | €23.52 | |
| Total | €140.00 | €58.80 |
Proportions hold, because one order carries one margin. What changes is the comparison between orders, and every real store sells products at different margins. Take two campaigns: one returns 4x on ad spend selling a 22% margin product, the other 2.5x on a 48% margin product. Profit on ad spend (POAS) nets the costs out before calling anything a winner: €0.88 of contribution per euro spent against €1.20, on break-evens of 4.55x and 2.08x. The 4x campaign loses money. The 2.5x campaign makes it. A revenue-based credit split ranks them the other way round every single time.
If TikTok-sourced orders come back at 28% and email-sourced orders at 6%, TikTok's €56 of attributed revenue is really €40.32 you keep and email's €56 is €52.64. Most multi touch attribution software splits revenue and stops.
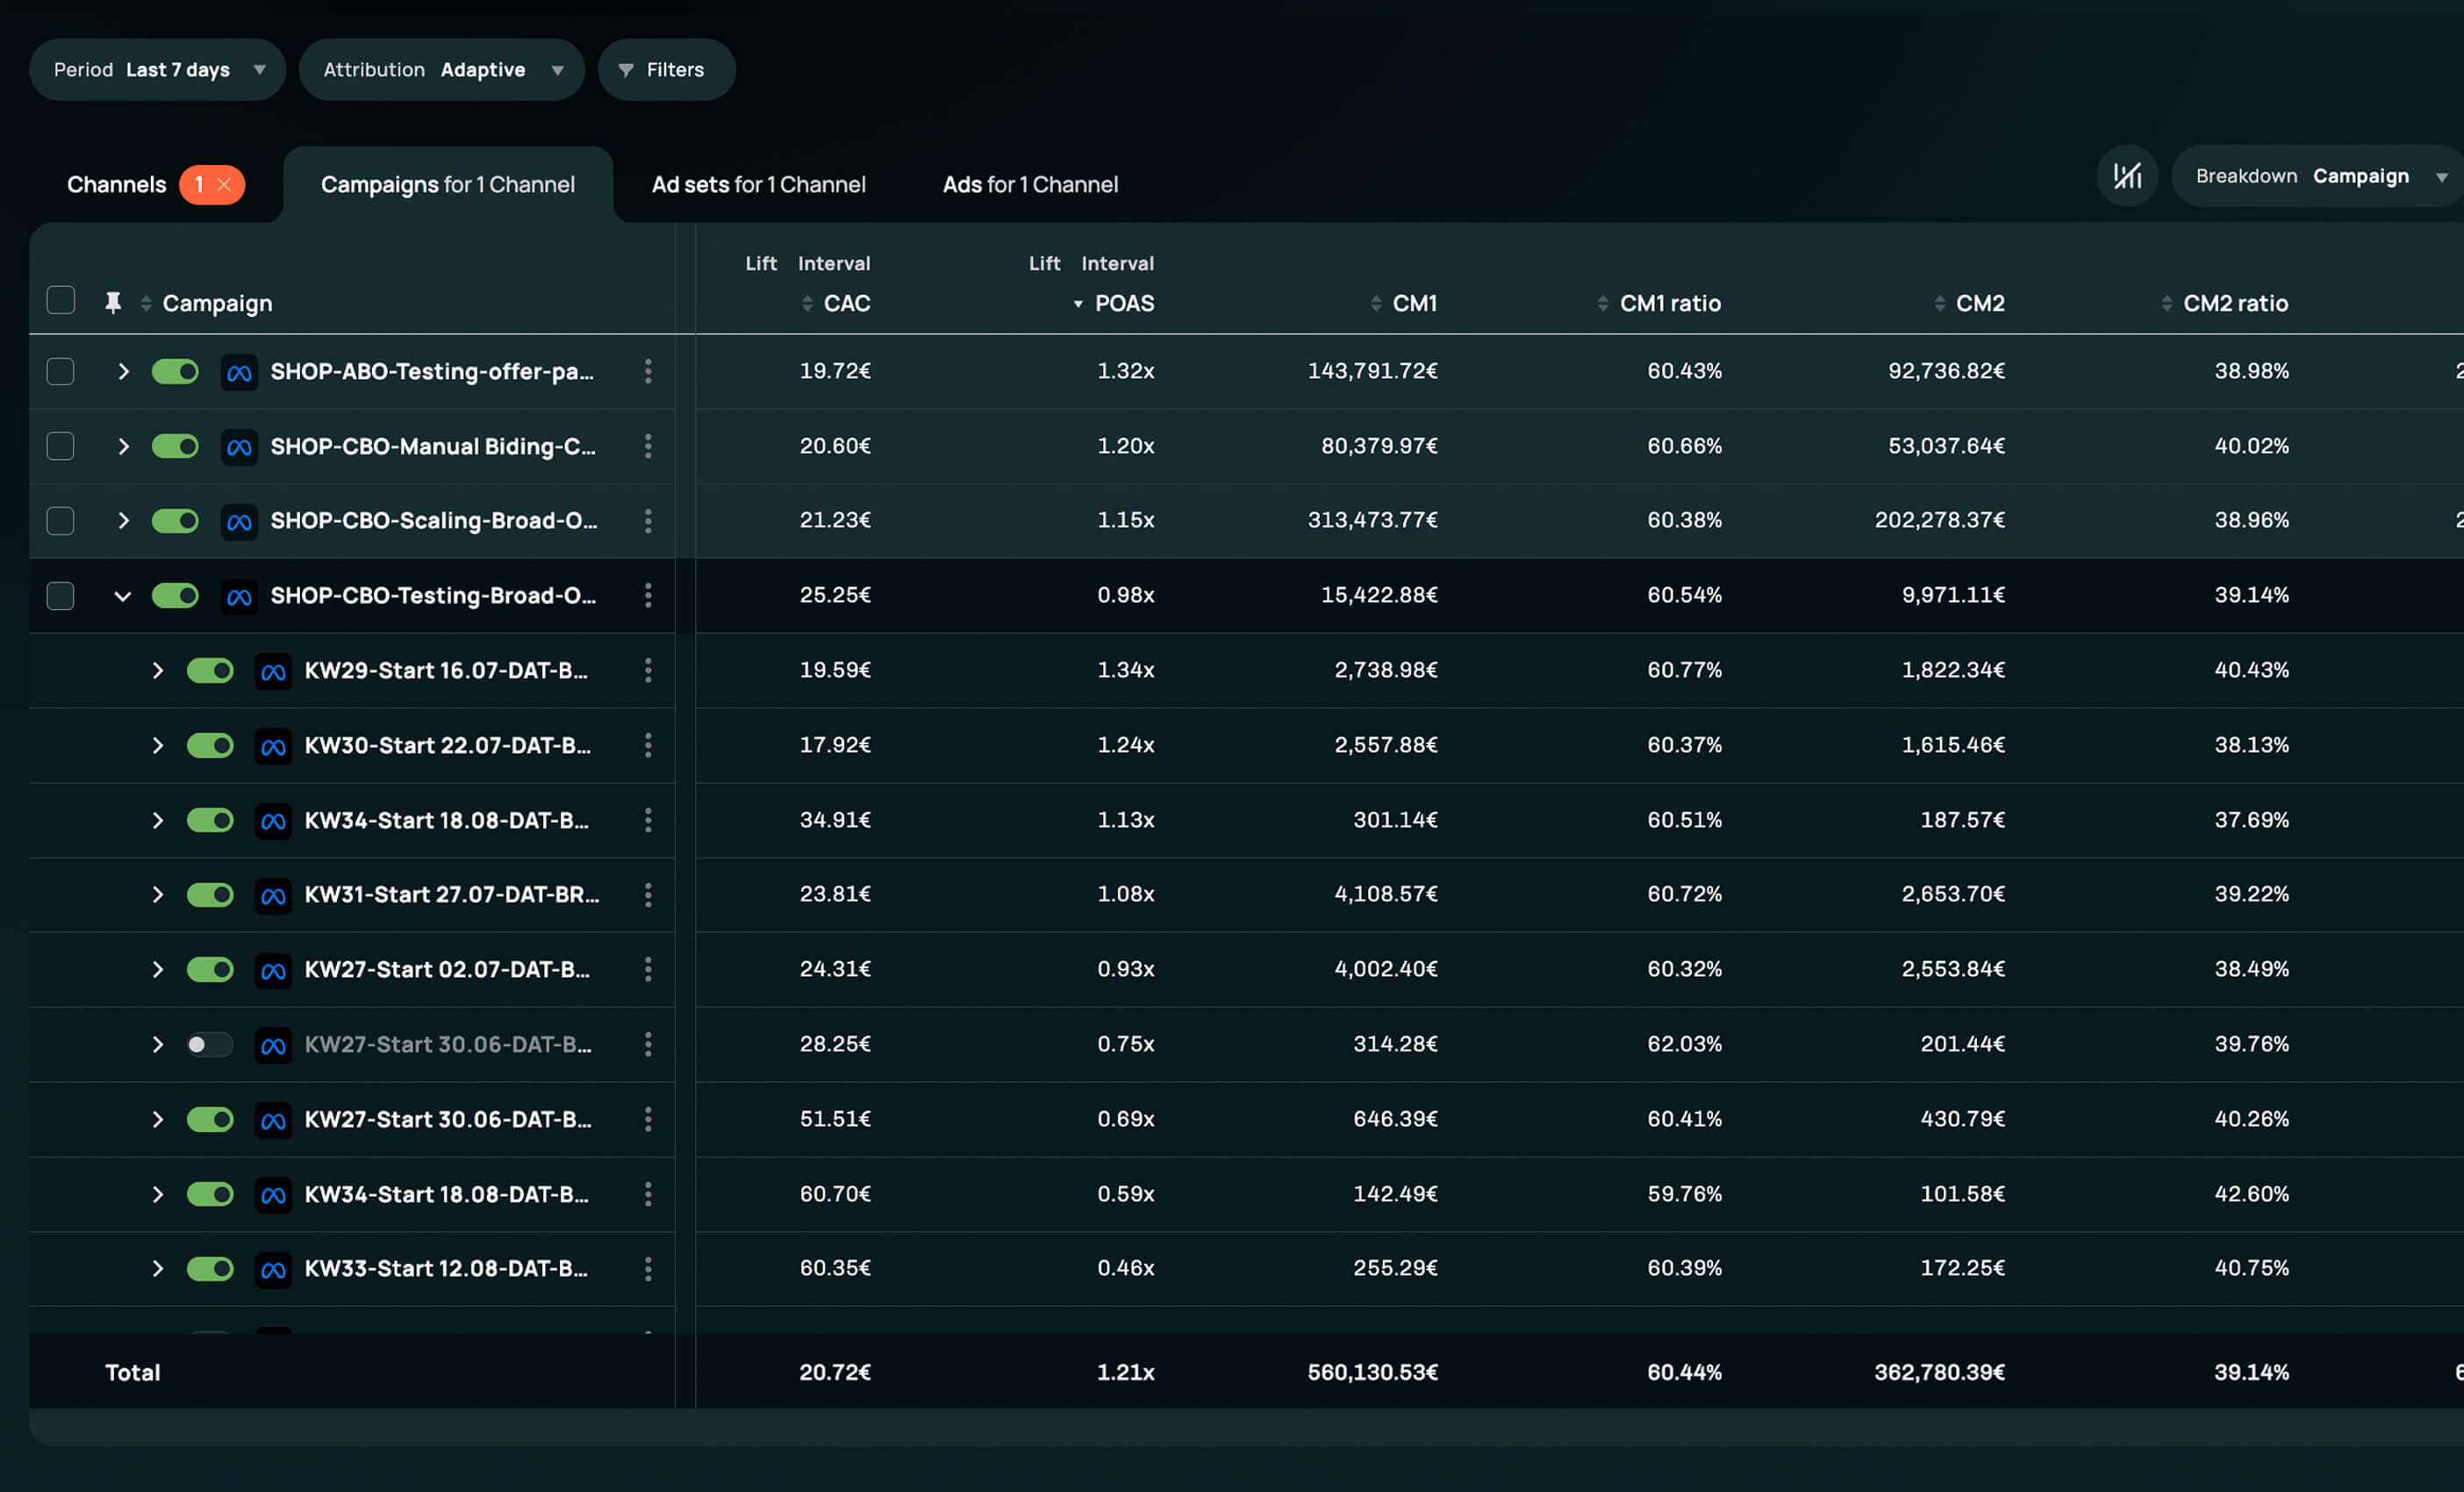
Admetrics in practice: Admetrics prices the split in contribution terms: CM2, POAS and new-customer CAC per channel after cost of goods, logistics, payment fees and returns, shown beside attributed revenue rather than instead of it. The two rankings frequently disagree, and that disagreement is the point. See Profit Intelligence.
Multi-touch attribution examples: what actually changes in the budget
Switching from last click to a multi-touch model doesn't change your revenue. It changes which channel gets defunded on Monday. A useful mta example ends in a budget line rather than an insight.
The branded search correction. Last click credits branded search with 31% of revenue, so it holds 24% of paid budget; under position-based it collects 11%, because it's almost never a first touch. The action isn't to cut brand search but to cap it at coverage of existing demand and move the difference into the prospecting that generates those searches.
The new-versus-existing split. A multi-touch model that doesn't separate new customers from returning ones will keep funding retention and report it as acquisition. The Quality Group hit exactly that across ESN and More Nutrition. Paid social was built around weekly promotions, More on Sundays and ESN on Wednesdays, which mostly reached people who'd already bought, and broad targeting let Meta's algorithm drift further toward existing customers as the brands grew. The last-click report never flagged it, because existing customers convert beautifully. Separating new from existing across creative, influencers and budgets, on top of a custom multi-touch model, moved four numbers: CAC down 70%, paid social revenue up 81%, new-customer rate up 65% and average order value up 19%.
Benefits of multi-touch attribution
The benefit isn't a better report. It's that you stop defunding the channels that create demand in order to feed the ones that harvest it. Prospecting almost never closes the order, so last click reads it as close to worthless and it gets cut first; credit at campaign and creative level also gives the decision a denominator, because "Meta is up" isn't an action and "this hook produces first touches at a third of the cost" is.
Can you do multi-touch attribution in Google Analytics?
GA4 will run a multi-touch model for you. It runs on the orders it can see, in revenue rather than margin, with no view of the impressions that started the journey.
What it genuinely does: data-driven attribution is the default model, alongside paid and organic last click and Google paid channels last click. First click, linear, time decay and position-based were removed in November 2023, per Google's own Analytics documentation, so the multi touch attribution google analytics workflow is data-driven or nothing.
What it misses is everything the coverage table already showed you — orders lost to declined consent and blocked tags, impressions on Meta, TikTok and native — plus everything below the revenue line. Cost of goods, shipping and returns sit outside the calculation, and the weights are Google's and aren't exposed.
Keep it as a free, neutral baseline and a sanity check on direction. Don't ask it to arbitrate where next month's budget goes. Fuller comparison in the marketing attribution guide.
Where multi-touch attribution breaks
MTA has four failure modes, and three of them hand you a confident number rather than an obvious error. That's what makes them expensive.
Platform claims don't reconcile
Each platform counts inside its own attribution window, with its own view-through rules and no knowledge of the others. Add them up and you get more orders than your store recorded.
Confectionery brand SugarGang watched this happen after iOS 14, when four or five platforms each reported a purchase that appeared exactly once in the Shopify backend. Each platform was answering its own question correctly. The question is "did I touch this order," and four of them could honestly say yes. SugarGang's fix was deduplicating across Google, TikTok, Instagram and Meta against one independently measured set of orders, held in their own data layer, which the platforms report into rather than about. Window mechanics on attribution windows.
Privacy, consent and signal loss
Apple's App Tracking Transparency requires apps that track people across other companies' apps and websites to ask permission first, and when it's denied the identifier is gone. Safari caps cookies set through document.cookie at one day of storage when the visitor arrives on a decorated link from a domain it has classified as having cross-site tracking capability. In the EEA, Google's consent mode v2 requires ad_user_data and ad_personalization signals before personal data is used for advertising. Chrome's April 2025 decision to keep third-party cookies is a reprieve for the browser and none at all for the consent layer. All of it lands in the coverage row above, and none of it produces an error message. Cross-device journeys go the same way: a path that starts on a phone inside the TikTok in-app browser and finishes on a laptop is two journeys unless a login or an email click stitches it.
Correlation isn't cause
MTA records what preceded a purchase. It can't tell you what caused it. A platform reporting that a channel is burning money, and a business that loses revenue the week you switch that channel off, are both consistent with the same underlying data. No credit rule settles that. Moving the budget and watching total orders does, and so does a marketing mix model. See MTA vs marketing mix modeling.
When multi-touch attribution is the wrong tool
Some brands shouldn't bother, and it's worth saying so plainly.
If 90% of your spend sits on one platform, multi touch attribution measurement will confirm what you already know. Algorithmic models also misbehave on small accounts — treat derived weights as unstable below roughly 300 converting paths a month per channel you evaluate separately. Below a certain scale the modeling error exceeds the decisions it informs, and the honest answer is to stay on blended economics and a post-purchase survey until your spend and channel count justify the effort. Long B2B cycles where revenue lands in a CRM months later belong to pipeline attribution rather than an order-anchored model. And there's no honest multi-touch attribution model for TV, podcast or out-of-home, because there's no click to record. That's marketing mix modeling's job.
Multi-touch attribution reporting: what a useful report contains
A multi touch attribution report that doesn't show tracked-order coverage next to the numbers is asking you to trust a percentage of a number it hasn't disclosed.
Five things separate usable multi touch attribution reporting from a chart:
- Tracked-order coverage, on the same screen as the revenue figure it qualifies, rather than buried in a settings page.
- New versus returning, split out, with contribution margin beside revenue. Blended channel revenue hides whether a channel acquires customers or re-sells to them, and a revenue-only ranking hides which of them pays.
- Credit at campaign and creative level as well as channel, with the underlying orders one click away. The Quality Group ships 75 to 100 new ads a week and kills roughly 85% of them; channel-level credit can't run that, and multi touch attribution analysis that can't reach the underlying orders can't be falsified.
How to implement multi-touch attribution
Implementation is four weeks of data plumbing and one afternoon of choosing a model. Teams reliably get that backwards.
Week 1, anchor and audit. Make the Shopify order ID the join key for every source. Pull a month of orders and measure coverage: what share arrive with a click ID or UTM on at least one touchpoint. That number is your baseline and your first target.
Week 2, fix the signal. Server-side collection deduplicated by event ID — Conversions API for Meta, enhanced conversions for Google, the equivalent for TikTok. Configure consent mode so a declined consent gets recorded as declined rather than as Direct.
Week 3, UTM hygiene and identity. One naming convention, enforced at build time. Stitch sessions to customers wherever a login or an email click allows it, then re-measure coverage. The gap since week 1 is what the project actually bought you.
Week 4, economics, then the model. Load cost of goods, shipping, payment fees and returns per product. Only now choose a credit rule, and write down why.
Best practices for multi-touch attribution in ecommerce
- Anchor on the order, never the session. Sessions are the input; orders are the unit of truth, and coverage belongs beside every number you publish.
- Split new and returning before you rank channels, and price the result in contribution margin. Otherwise retention flatters acquisition and revenue credit ranks the wrong campaigns.
- Set the lookback window to your real time-to-purchase. Heimplanet measured 7 to 14+ day journeys and runs a 120-day window. Measure your own median instead of inheriting a platform default, then validate with a holdout before any large reallocation. Multi touch attribution modeling proposes; a test confirms.
A Shopify checklist
- Order ID as the anchor. Every touchpoint, every platform postback and every cost line joins on it.
- UTM collisions between apps. Review, referral and subscription apps append their own parameters and overwrite campaign data. Audit what each one writes, and verify the purchase event fires once, server-side, carrying the order ID.
- Subscriptions and repeat orders. Decide up front whether recurring orders carry the original acquisition path or none at all. Either is defensible; drifting between them isn't.
- Treat creator discount codes as one signal among several rather than a replacement for the path.
- Expect Shopify's own channel report to disagree, because it reads last non-direct session and knows nothing about impressions or windows. Document the gap.
Admetrics in practice: Admetrics connects to Shopify at order level and runs first-party and server-side collection with server-to-server pushback, so the improved signal feeding your reporting also feeds platform optimization. See Conversion Signals.
MTA, marketing mix modeling and experiments
MTA answers which touchpoints preceded an order. It can't answer what happened because of the ad. Those are different instruments, and mature teams run all three.
| Method | Question it answers | Where it fails |
|---|---|---|
| Multi-touch attribution | Which touchpoints preceded the order, and what each is worth under a stated rule | No causality; sees only what it tracked |
| Marketing mix modeling | How channel spend relates to total outcome, including unclickable media | Aggregate, slow to update, no campaign detail |
| Experiments and holdouts | What changed because of a specific intervention | Costs budget and time; one question at a time |
Use MTA for weekly campaign decisions, marketing mix modeling for quarterly channel allocation, and experiments to settle the disagreements between them. Full comparison: MTA vs marketing mix modeling.
Choosing multi-touch attribution software
Three questions decide it, and none of them is how many models the tool ships.
How much of my revenue does it actually see? Ask for tracked-order coverage on your own data during the trial, because everything else is a percentage of that number. The multi touch attribution market competes on model names; coverage is where the real differences sit. Run a parallel trial on your own orders rather than a demo.
Does it price the result in margin or in revenue? If cost of goods, shipping and returns aren't in the system, the ranking isn't a profit ranking.
Does anything happen after the number lands? A tool that hands you a number and stops has moved the work rather than done it.
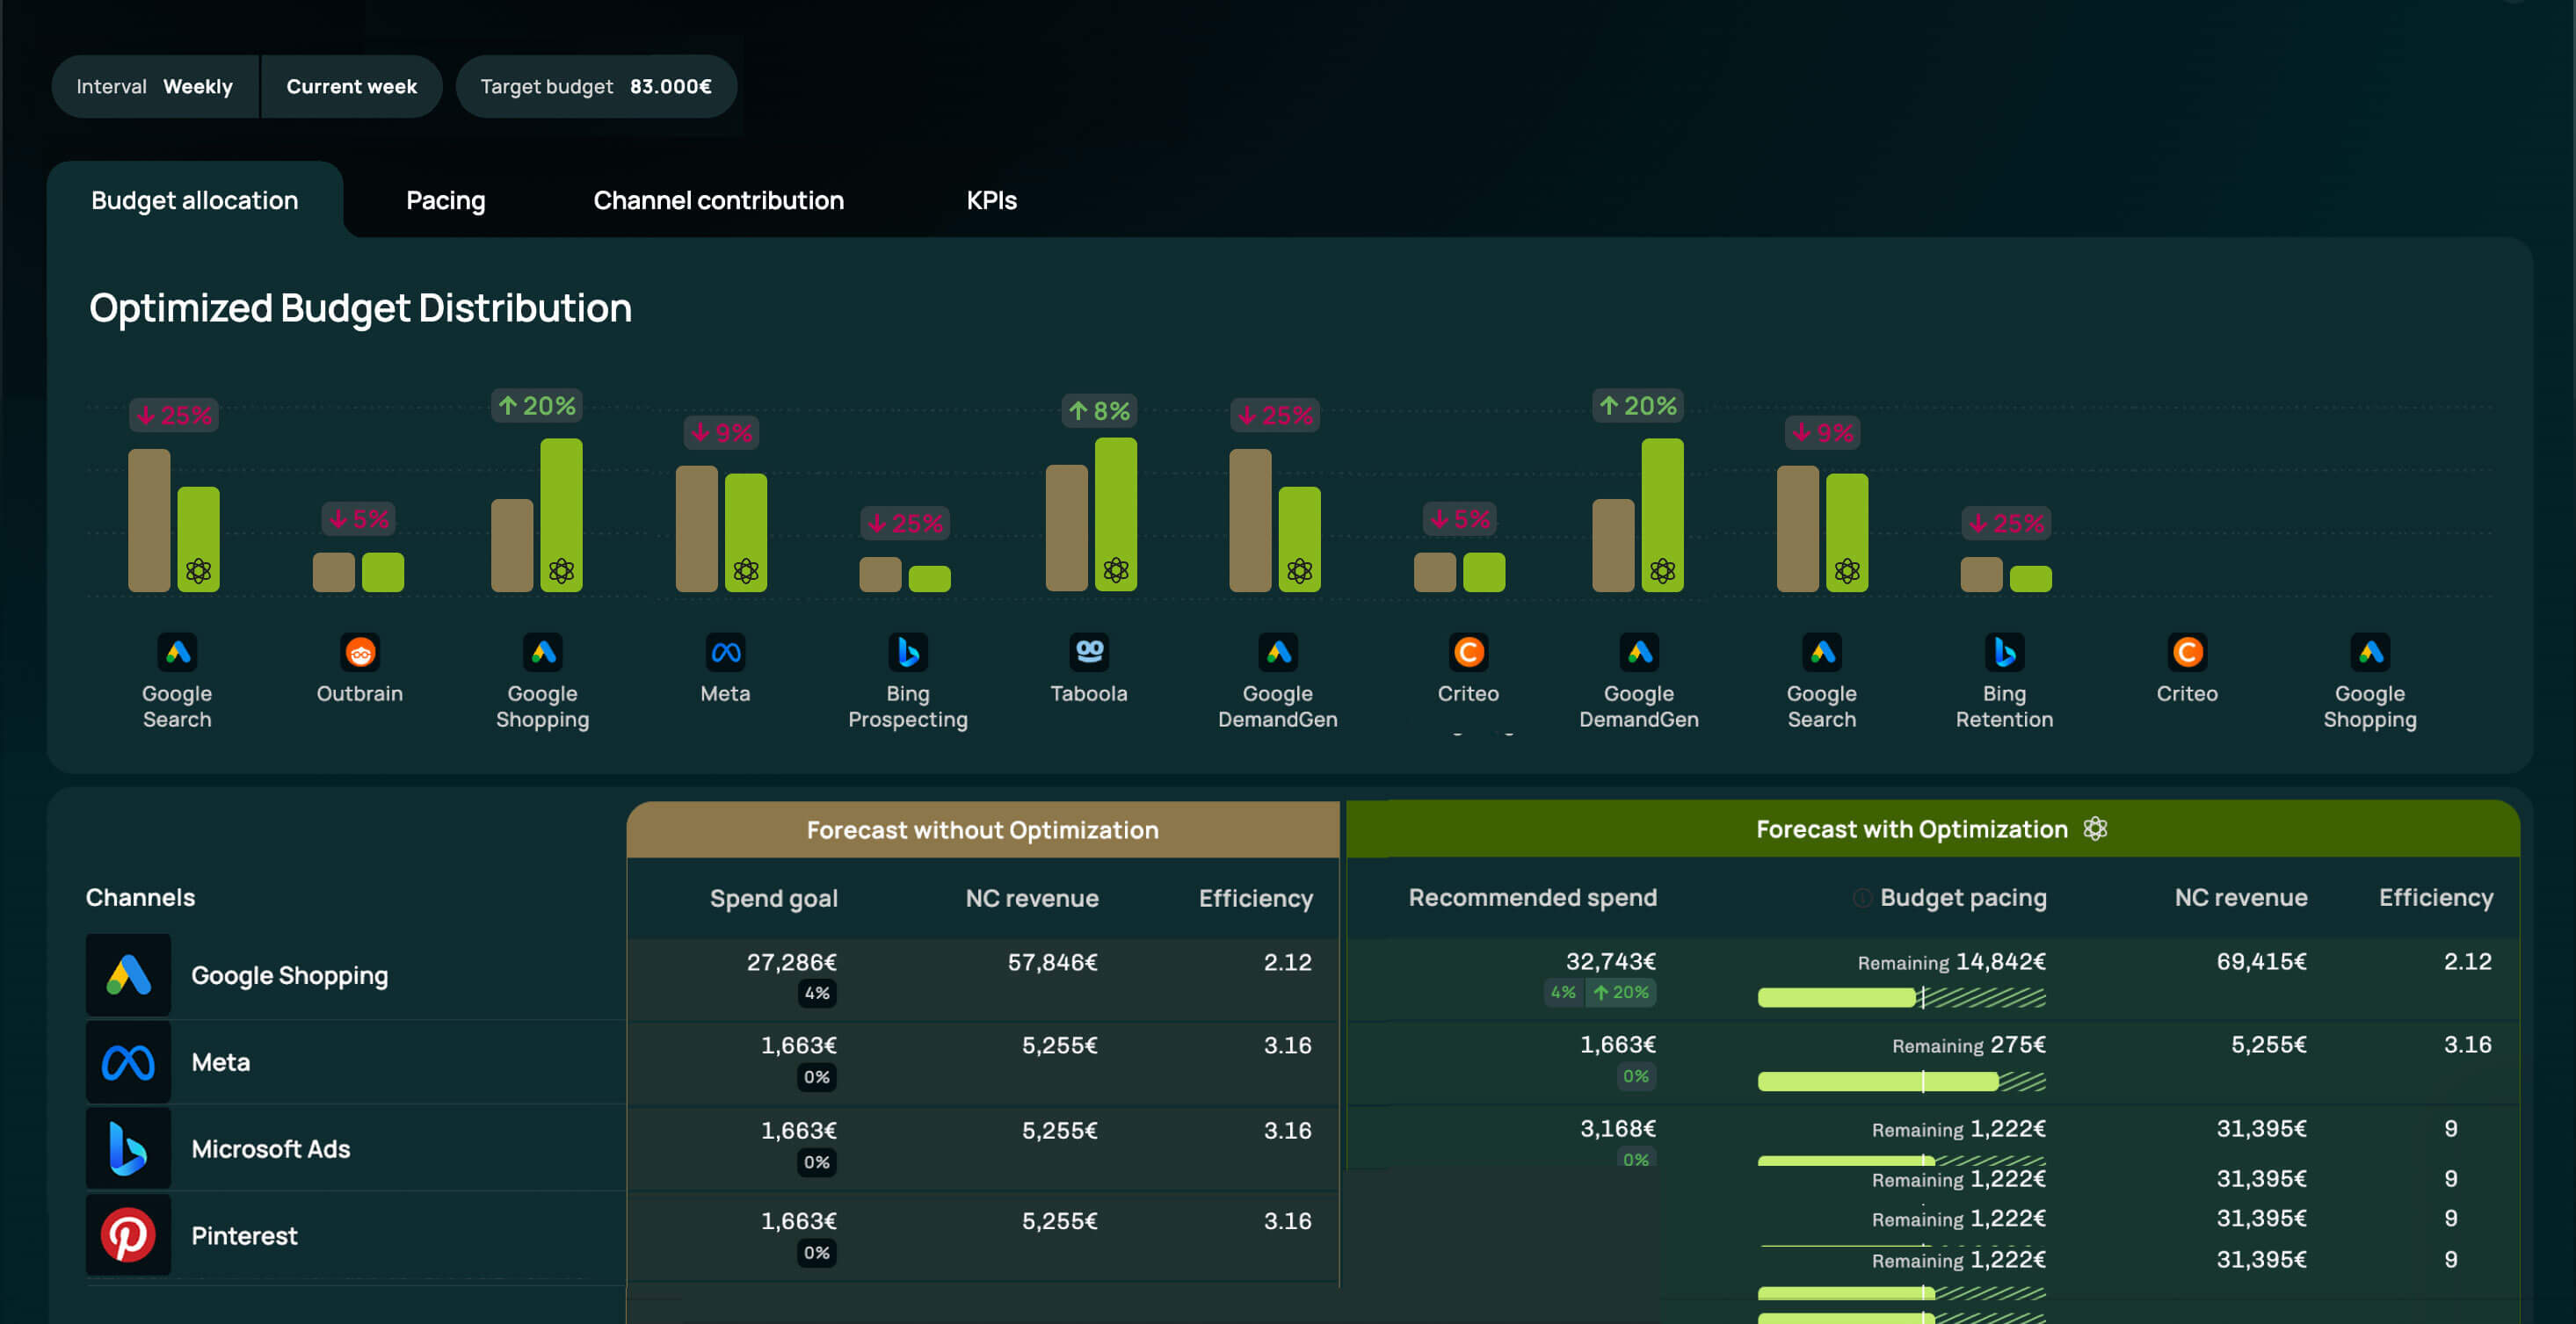
Admetrics in practice: In Admetrics the measurement doesn't end at the report. Budget Optimizer proposes a cross-channel split with its reasoning shown, and AdPilot activates it inside explicit constraints, with approvals, rollback and a decision log. Models and rules execute; AI explains and recommends. That sequence is what ProfitOps means. See Budget Optimizer and AdPilot.
Check our guide for a detailed feature by feature comparison: the 10 best multi-touch attribution tools.
FAQ
What is multi-touch attribution, and what are the models?
Multi-touch attribution splits the value of one conversion across every touchpoint that preceded it, instead of giving all of it to one. The models are linear, time decay, position-based (40/40/20 across first, last and middle), W-shaped and full path for B2B stages, and data-driven models using Markov chains or Shapley values. Each is worked on the same €140 order above.
What does MTA mean in marketing?
MTA stands for multi-touch attribution. Asked the other way: what is MTA in marketing? It means splitting one conversion's value across the touchpoints that preceded it, under a stated rule. MTA models, MTA modeling and MTA measurement all name the same practice. You'll also see it written multitouch attribution, multi touch marketing attribution, multi-touch marketing attribution, attribution multi touch, mta attribution, mta multi touch attribution and multi touch attribution mta.
Can Google Analytics do multi-touch attribution?
Yes, through data-driven attribution, which is GA4's default model. First click, linear, time decay and position-based were removed in November 2023. GA4 models the orders it can see, in revenue rather than contribution margin, with no view of impressions.
Does multi-touch attribution work with iOS 14 and cookie restrictions?
Partially, and only with server-side collection. SugarGang rebuilt Facebook performance to roughly 3x ROAS after iOS 14 by sending conversions server-side and deduplicating across platforms. Measure your tracked-order share before trusting any split built on it.
Multi-touch attribution vs marketing mix modeling — which do I need?
MTA for weekly campaign and creative decisions; marketing mix modeling for quarterly channel allocation and unclickable media. They answer different questions, and disagreement between them is normal rather than a fault.
How long does it take to implement multi-touch attribution?
About four weeks on a Shopify store, one per stage in the plan above. Choosing the model takes an afternoon.