
Supermetrics moves data from Meta, Google, TikTok, Shopify and other platforms into Google Sheets, Looker Studio, Excel, Power BI and AI chats. The numbers arrive as each platform reported them. Meta and Google can both count the same order as their own, and revenue lands before product costs and returns.

This list compares 10 Supermetrics alternatives, from connector tools that do the same job to ecommerce analytics platforms that track and attribute on their own data. Each alternative to Supermetrics is ranked on tracking and attribution, data foundation, profit, what happens after the report, and how the data gets out to Sheets, BI tools and warehouses.

Key Takeaways

Admetrics is the best Supermetrics alternative for ecommerce brands that want their own numbers in the Sheet. First-party tracking, independent multi-touch attribution, contribution margin down to the SKU, conversions sent back to the ad platforms server-to-server and budget moves all run on the store's own orders, then sync live to Google Sheets or export to a warehouse, from $399/month.
Most Supermetrics competitors move the same platform-reported numbers. Seven of the ten have no tracking of their own, and the conversions in their reports start as each platform's own count. Meta and Google each claim the same order through view-through credit, their own attribution windows and modeled conversions, and a Sheet that adds the two together shows more purchases than the store took. Budget then drifts toward whichever platform credits itself most.
Only two tools report contribution margin. None of the other eight reaches contribution margin, and most report revenue before product costs and returns. A campaign moving discounted stock that comes back in the mail can top the ROAS column while losing money. Admetrics reports CM2, CM3 and POAS by campaign and product, down to the SKU.
Half the tools send no conversions back to the ad platforms. They take numbers out of Meta, Google and TikTok and send nothing in return, and each platform's bidding keeps learning from what its own pixel caught. Admetrics sends conversions to Meta, Google, TikTok and other ad platforms server-to-server.
Most tools leave budget changes to a person. Three have no ad-platform actions at all, and in most of the rest a change waits for someone to make or approve it while spend keeps running on yesterday's split. Admetrics' Ad Pilot moves Meta budgets toward a CAC, POAS or new-customer ROAS target.

Why ecommerce brands leave Supermetrics

Three drawbacks push ecommerce teams already running Supermetrics to look for something else.

Platform-reported numbers. Supermetrics moves each platform's own reported conversions and applies no attribution model. Meta and Google each credit themselves with the same order, through view-through credit, their own attribution windows and modeled conversions. Add up the channel columns and the total can run well past the orders Shopify recorded, and the next budget split gets decided on credit that was counted twice.

No product costs or returns. The Supermetrics Shopify connector puts store data in the same Sheet as ad spend, but there's no COGS or contribution margin in the product. ROAS runs at full revenue, before product costs and returns. Getting margin per campaign means a cost tab, lookup formulas and someone keeping both current every time a price or supplier changes.

Plan limits on sources, accounts, destinations and stored history. Supermetrics pricing caps Starter at three data sources, three accounts per source, one core destination and one user, and Growth at six sources and seven accounts per source. Three sources fill up with Meta, Google and Shopify before TikTok or Klaviyo gets a slot, and adding a channel, an account or a teammate means a plan upgrade or a paid add-on. BigQuery, Snowflake and Supermetrics Storage are Enterprise only. Supermetrics doesn't permanently store the data you load, leaving history wherever the plan lets you send it.

How we ranked Supermetrics alternatives

We scored every tool on five criteria. Prices and features are as of November 2026.

▪Attribution and tracking accuracy. Whether the tool tracks on its own (a pixel, server-side collection, a first-party domain), matches conversions to real store orders and credits channels with its own model, or passes through each platform's self-reported conversions.
▪Data foundation. Which ad, store and retention sources connect, custom stores included, how often data refreshes and where it's hosted.
▪Profit over revenue. Whether product cost, shipping, payment fees and returns reach campaign reports, or the numbers stop at revenue and ROAS.
▪What happens after the report. Whether conversions go back to the ad platforms server-to-server, and whether anything pauses ads or moves budget.
▪Getting the data out. Which destinations each plan includes (Google Sheets, Looker Studio, BI tools, warehouses, AI chats through MCP) and what it costs to add more.

Supermetrics alternatives compared

#
PLATFORM
ATTRIBUTION
PROFIT CONTROL
S2S PUSHBACK
ACTION
DATA OUT
1
Admetrics
Own tracking, 8 models incl. Adaptive
CM2, CM3, POAS to SKU
Yes (paid add-on)
Budget controls; Ad Pilot on Meta
Sheets sync, warehouse, S3, Data API, MCP
2
Funnel
Measure add-on, no own pixel
No
Google Ads, Meta and others
Measure recommends budget moves
Sheets, Looker Studio; BI and warehouses from Business; MCP
3
Windsor.ai
No
No
No
Pause campaigns, adjust budgets
Every destination on every plan, incl. MCP
4
Dataslayer
No
No
No
No
Sheets, Excel, Looker Studio, Power BI; warehouses with row limits
5
Coupler.io
No
No
No
No
Sheets, Looker Studio, Power BI, BigQuery, Snowflake, MCP
6
Porter Metrics
Platform-level conversions
COGS imported from Sheets
No
AI tasks, with permission
Looker Studio, Sheets, Power BI, BigQuery, MCP
7
Polar Analytics
Polar Pixel, 10 models
CM by channel and product
Meta and Google
Operator, after approval
Snowflake per brand, BI; Sheets add-on; MCP
8
Triple Whale
Triple Pixel, multi-touch, Total Impact
Profitability analysis
Sonar; Meta passback (beta)
Ad platform controls; Moby after approval
Sheets & CSV (Advanced); warehouse sync (Enterprise+)
9
Adverity
No
No
LinkedIn offline conversions
No
40+ incl. Sheets, Looker Studio, warehouses
10
Improvado
Add-on from $20k/yr, no pixel
No
No
Agent drafts changes, approval required
Warehouses, Looker Studio, BI, Sheets, MCP

Admetrics

★5.0

Best for: ecommerce and DTC brands that report in Google Sheets, Looker Studio or a warehouse and want the attribution and contribution margin in those reports measured on their own orders.
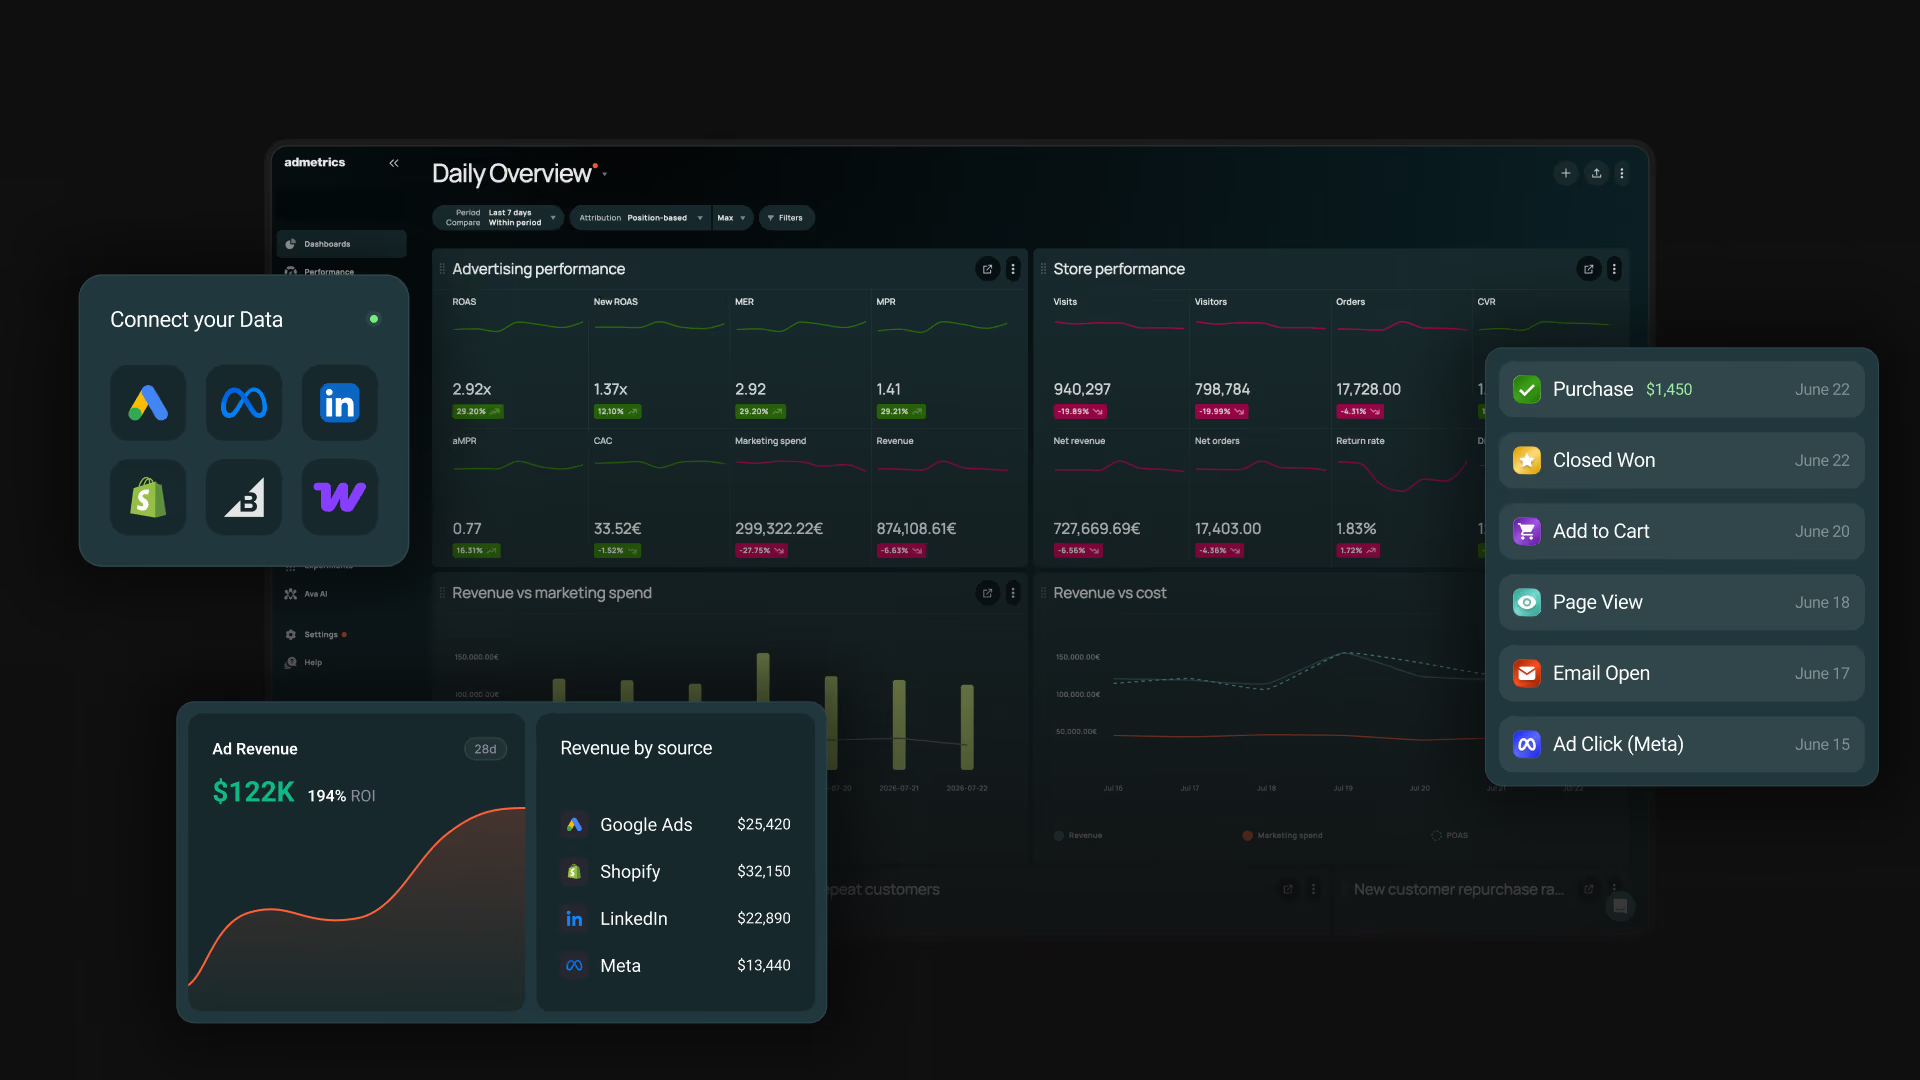
Admetrics dashboard with attribution, contribution margin and POAS by campaign

Admetrics is a measurement and budget allocation platform for ecommerce. It tracks clicks and orders first-party, matches each journey to the real shop order, credits channels with its own attribution, prices every campaign in contribution margin and sends the results to Google Sheets, a warehouse or wherever else the team reports.

The Sheet still fills on schedule. What changes is where its numbers come from: conversions counted once against store orders, and campaigns ranked on what they earned after costs. Over 30 native integrations cover stores, marketplaces, ad platforms and retention tools, with unlimited shops, integrations and users on every plan, and each source shows when it last synced.

Key features

▪Tracking. First-party, server-side tracking on your store's own domain ties each journey to a real shop order, with the visitor's consent state respected.
▪Conversion Signals. Conversions sent back to Meta, Google, TikTok and other ad platforms server-to-server.
▪Multi-Touch Attribution. Eight attribution models, including the data-driven Adaptive model, on order-level journeys. A Chrome extension shows Admetrics numbers inside the Meta, Google Ads and TikTok ad managers.
▪Profit Intelligence. A P&L from GMV through CM1, CM2 and CM3 to EBITDA, with CM2, CM3 and POAS by campaign and product down to the SKU, built from COGS, shipping, payment fees and returns per order.
▪Data Exports. A live-connected Google Sheets sync, scheduled deduplicated warehouse exports, AWS S3, Excel and CSV downloads, scheduled email reports and Slack. Reports run off a BigQuery dataset, hosted or in your own GCP, and MCP & Agents and the Data API (REST) are included from Growth.
▪Budget Optimizer and Ad Pilot. Campaign and ad-set budgets on Meta, Google, TikTok and Microsoft change from inside Admetrics, with every change logged. Ad Pilot adjusts Meta budgets toward a CAC, POAS or new-customer ROAS target, and Budget Optimizer is a Custom-plan add-on.

Strengths

Single source of truth. Every metric has one definition across reports, exports and agents, and CM2 is calculated once, so the Sheet and the dashboard show the same figure.
Contribution margin per campaign and SKU. Each campaign and product carries CM2, CM3 and POAS into the export, after product cost, shipping, fees and returns.
Independent attribution next to the platforms' numbers. Admetrics' own credit sits beside what Meta, Google and TikTok claim for themselves, in reports, exports and the ad managers.
Budget automation on Meta. Ad Pilot moves Meta budgets toward a CAC, POAS or new-customer ROAS target and logs every move.
EU data hosting. Data is processed and stored in the EU with no third-country transfer, under a DPA.

Limitations

Fewer sources than a general connector. Admetrics connects ecommerce, ad and retention data through 30+ integrations, not the hundreds of SEO, CRM and social sources a connector tool covers.
S2S pushback is a paid add-on on every plan.
Ad Pilot executes on Meta only. Google, TikTok and Microsoft budgets are changed by hand from Admetrics.

Pricing

Growth: $399/month, including the first $20,000 of monthly ad spend, then 1.5% above that. Data refreshes every 4 hours. Business: $899/month, including $70,000, then 1% above. Ad Pilot is an add-on from this plan. Custom: quoted, from $100,000 of monthly ad spend, with a 2-hour refresh. PRISMA and Budget Optimizer are add-ons here. Annual billing saves 15%, the 21-day free trial needs no card, and setup takes about an hour.

Reviews

Admetrics holds 5.0 on the Shopify App Store and 4.8 on G2. Reviewers point to the onboarding help and reports that are easy to read.

Bottom line

Moving hundreds of SEO, CRM and social sources into a warehouse is a connector tool's job, and most of the tools below are built for it. Admetrics is for the ecommerce brand that wants the Sheet to show which campaigns earned money after costs, measured on its own orders, and wants budget to move on that number.
Book a demo

Funnel

★4.5

Best for: marketing and data teams that report across many sources in BI tools or a warehouse and want conversion uploads to the ad platforms from the same pipeline.
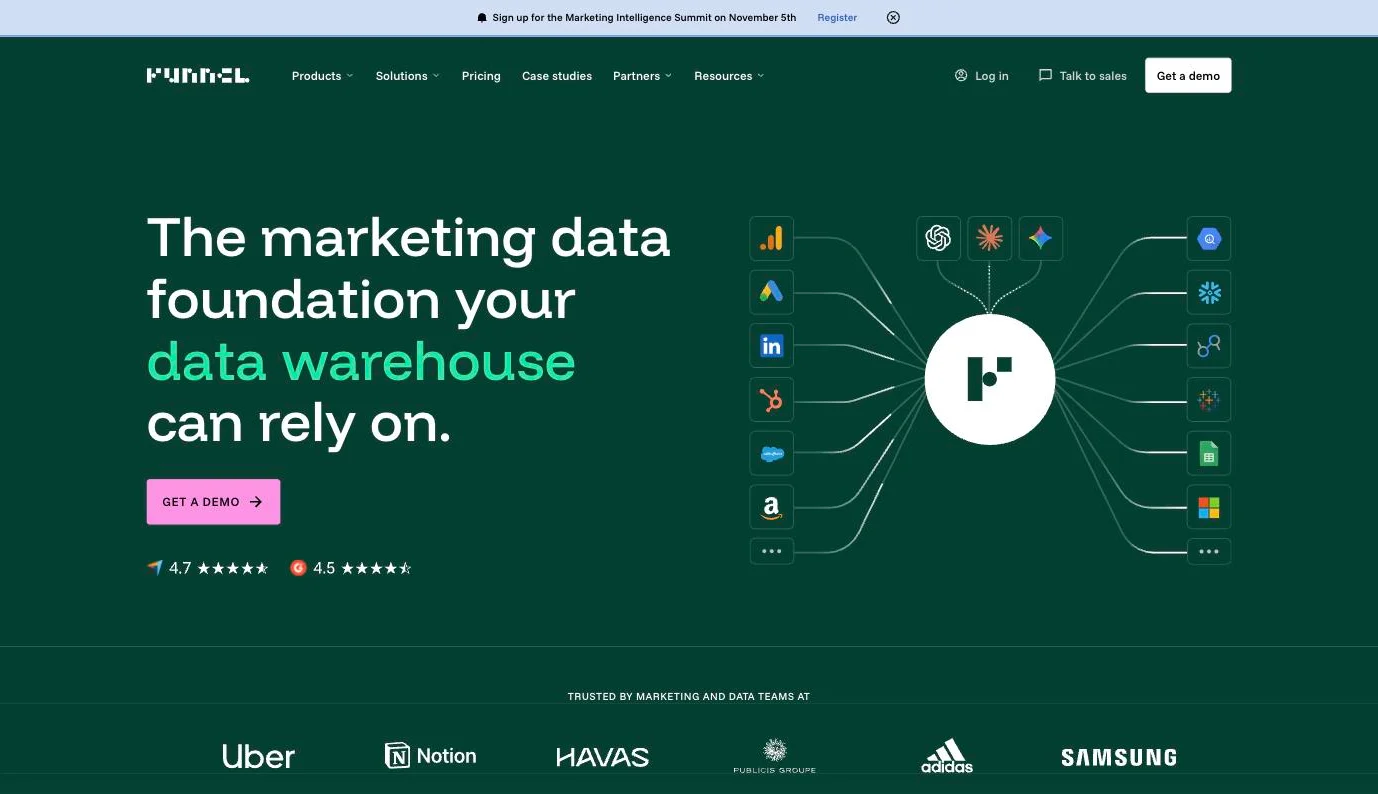
Funnel homepage presenting its marketing data hub and connectors

Funnel moves marketing data from 117 connectors on Starter, 579 on Business and 600+ on Enterprise into Looker Studio, Google Sheets, BI tools and warehouses. Conversions go back to Meta and Google Ads through conversion uploads. Funnel Measure adds mix modeling, multi-touch attribution and incrementality as a paid add-on. There's no contribution margin in the data.

Key features

▪Connectors by plan. 117 on Starter, 579 on Business and 600+ on Enterprise, with the Meta Ads connector, Google Ads and Shopify among them.
▪Destinations by plan. 13 on Starter, 46 on Business with Power BI, Tableau, BigQuery and S3 added, and 47 on Enterprise with Snowflake.
▪Conversion uploads. Conversions sent to Google Ads, to Meta through the Conversions API and to other destinations, uploaded to an existing pixel.
▪Funnel Measure. Mix modeling, multi-touch attribution and incrementality on Business and Enterprise, with AI insights that recommend where to move budget.
▪Funnel AI & MCP. Included on every plan, so AI assistants can work with the data Funnel collects.

Strengths

Connector coverage from Business up. 579 connectors on Business, refreshed every 2 hours, and 600+ on Enterprise.
Conversions back to Meta and Google. The pipeline that feeds reporting also uploads conversions to the ad platforms.
Certified security. ISO 27001 and SOC 2 Type 2, with an EU Data Center on Enterprise.

Limitations

No contribution margin. There's no CM2, CM3 or POAS by campaign, and no P&L built from product costs and returns.
Attribution is an add-on. Funnel Measure comes on Business and Enterprise only, at extra cost.
BI tools and warehouses start on Business. Power BI, Tableau, BigQuery and S3 aren't on Starter, which exports once a day.

Pricing

Starter starts from $300/month, billed annually, with 117 connectors, 13 destinations and daily exports. Business starts from $600/month with 579 connectors and a refresh every 2 hours. Enterprise goes through sales and adds Snowflake and the EU Data Center. Funnel Measure's Digital Measurement tier costs $2,250/month, billed annually, at $500K–$1M of monthly ad spend. There's a 14-day free trial with no card.

Reviews

Funnel scores 4.5 on G2 (297 reviews), 4.7 on Capterra and 2.1 on Trustpilot.

Bottom line

Funnel suits teams that run reporting across many marketing sources in BI tools or a warehouse and want conversion uploads to come from the same pipeline. It stops before profit. There's no contribution margin by campaign, and attribution is an add-on from Business.

Windsor.ai

★4.4

Best for: analysts, agencies and data teams that want 350+ sources and every destination, warehouses and AI chats included, on every plan.
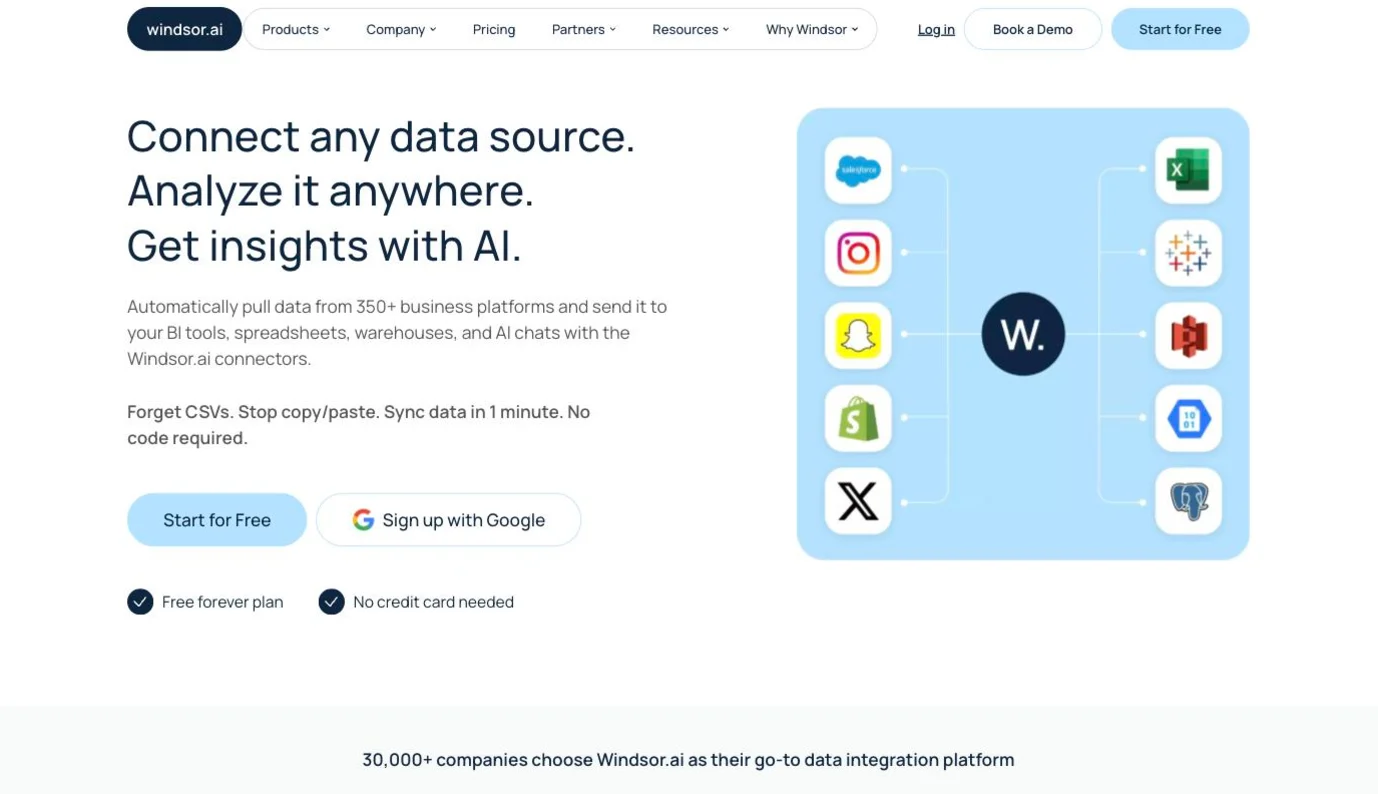
Windsor.ai homepage presenting its connectors from 350+ sources to BI tools, spreadsheets, warehouses and AI chats

Windsor.ai connects 350+ data sources and sends the data to spreadsheets, BI tools, warehouses and AI assistants. Every destination comes on every plan, from the $19 Basic plan up, and read and write access lets you pause campaigns or adjust budgets from Windsor.ai. Reports carry each ad platform's own conversions, with no attribution model, product margin or conversions sent back.

Key features

▪350+ connectors. Shopify, the Meta Ads connector, Google Ads, TikTok Ads, Organic and Shop, Klaviyo, and Amazon Ads, Seller Central, Vendor Central and DSP.
▪Every destination on every plan. Google Sheets, Excel, Looker Studio, Power BI, Tableau, BigQuery, Snowflake, Redshift, Databricks, Fabric, S3, Azure, PostgreSQL and MySQL.
▪Windsor MCP server. Data available in ChatGPT, Claude, Copilot, Gemini and Perplexity.
▪Read and write access. Pause campaigns or adjust budgets in the ad platforms from Windsor.ai.
▪Template gallery. Ready-made reports for Looker Studio, Power BI, Excel, Google Sheets and Tableau.

Strengths

No destination gating. Warehouses and AI chats come on Basic, the same as on Enterprise.
Budget and status changes on every plan. Pausing campaigns and adjusting budgets aren't held back for higher tiers.
Servers in Germany. Hosting in a German data center, with SOC 2 Type II and GDPR compliance.

Limitations

No attribution model of its own. Conversions arrive as each ad platform reports them.
No contribution margin. Shopify's item cost comes through as a field, with no contribution margin or POAS per campaign.
No conversions sent back. Nothing goes back to the ad platforms server-to-server.

Pricing

Basic costs $23/month, or $19/month billed annually, for 3 sources, 75 accounts and a daily sync. Standard is $118/month or $99/month billed annually (7 sources, hourly), Plus $299 or $249 (10 sources, 200 accounts) and Professional $598 or $499 (14 sources, 500 accounts, 15-minute sync). Enterprise is quoted. Paid plans include unlimited users and up to 10 years of history. A 30-day trial covers 10 sources and 15 accounts, then drops to Forever Free: 1 source, 1 account and 5 destination tasks.

Reviews

Windsor.ai scores 4.4 on G2 (90 reviews).

Bottom line

Windsor.ai suits analysts and agencies who want many sources in any destination, warehouse or AI chat, without paying up a tier for it. It stops at the platforms' own numbers: there's no attribution model, no product margin and no conversions sent back.

Dataslayer

★4.8

Best for: PPC teams and agencies that report in Google Sheets, Looker Studio or Power BI and want a like-for-like move off Supermetrics.
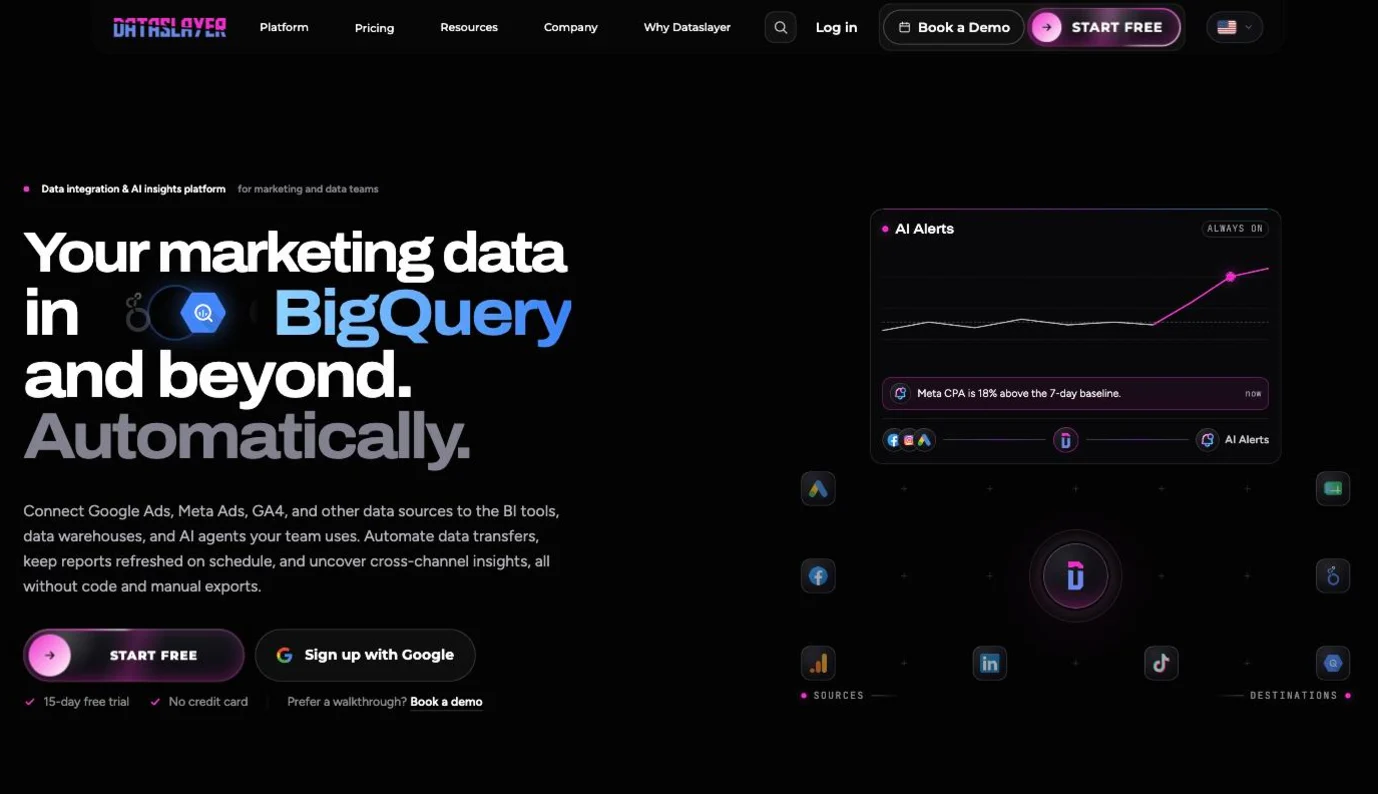
Dataslayer homepage presenting marketing data sent to Sheets, BigQuery and AI agents

Dataslayer pulls marketing data into Google Sheets, Excel, Looker Studio and Power BI, with warehouses and AI chats as further destinations. It connects 50 to 60+ sources, Shopify, WooCommerce, Meta Ads, Google Ads, TikTok Ads, Klaviyo and Amazon Ads among them, and offers a one-click migration for Supermetrics users. The numbers it moves are each platform's own.

Key features

▪Core destinations. Google Sheets, Excel, Looker Studio and Power BI, with unlimited rows on paid plans.
▪Enterprise destinations. BigQuery, Snowflake, Redshift, S3, Google Cloud Storage, Azure and databases, with row limits by plan.
▪AI connections. Claude, ChatGPT, Gemini and Copilot, plus MCP.
▪1-click migration. An existing Supermetrics setup moves across in one step.
▪Ecommerce sources. Shopify with refunds, WooCommerce, Klaviyo, Amazon Ads and Amazon DSP.

Strengths

No row caps in spreadsheets and Looker Studio. Paid plans send unlimited rows to the four core destinations.
A short switch from Supermetrics. The migration tool carries an existing setup over.
ISO 27001 and ISO 27701. Both certifications, plus GDPR compliance.

Limitations

No attribution model of its own. Conversions arrive as each ad platform reports them.
No product costs or margin. Shopify data includes refunds, with no COGS, contribution margin or POAS.
Warehouse exports capped by rows. 5,000 rows on Starter, 100,000 on Advanced and 2 million on Pro. No conversions go back to the ad platforms either.

Pricing

Prices are in euros, billed annually. Starter costs €29/month (3 connectors, 1 user, 3 accounts per connector, daily refresh, 5,000 rows to enterprise destinations), Advanced €99/month (7 connectors, 10 users, 50 accounts, hourly) and Pro €299/month (10 connectors, unlimited users, 100 accounts). Business is quoted. The plan cards on the same page show €20 for every plan, which doesn't match. Annual billing saves about 20%, and bundles of two or more destinations take 10–15% off. After a 15-day trial, the free plan keeps 1 connector, 1 user, 1 account, a manual daily refresh and 1 core destination.

Reviews

Dataslayer scores 4.8 on G2 (313 reviews).

Bottom line

Dataslayer suits PPC teams and agencies that live in Sheets and Looker Studio and want a like-for-like Supermetrics replacement. It stops at platform-reported numbers, with no attribution, product costs or conversions sent back.

Coupler.io

★4.8

Best for: companies that want marketing, sales, finance and operations reporting in one tool, with built-in storage and dashboard templates.
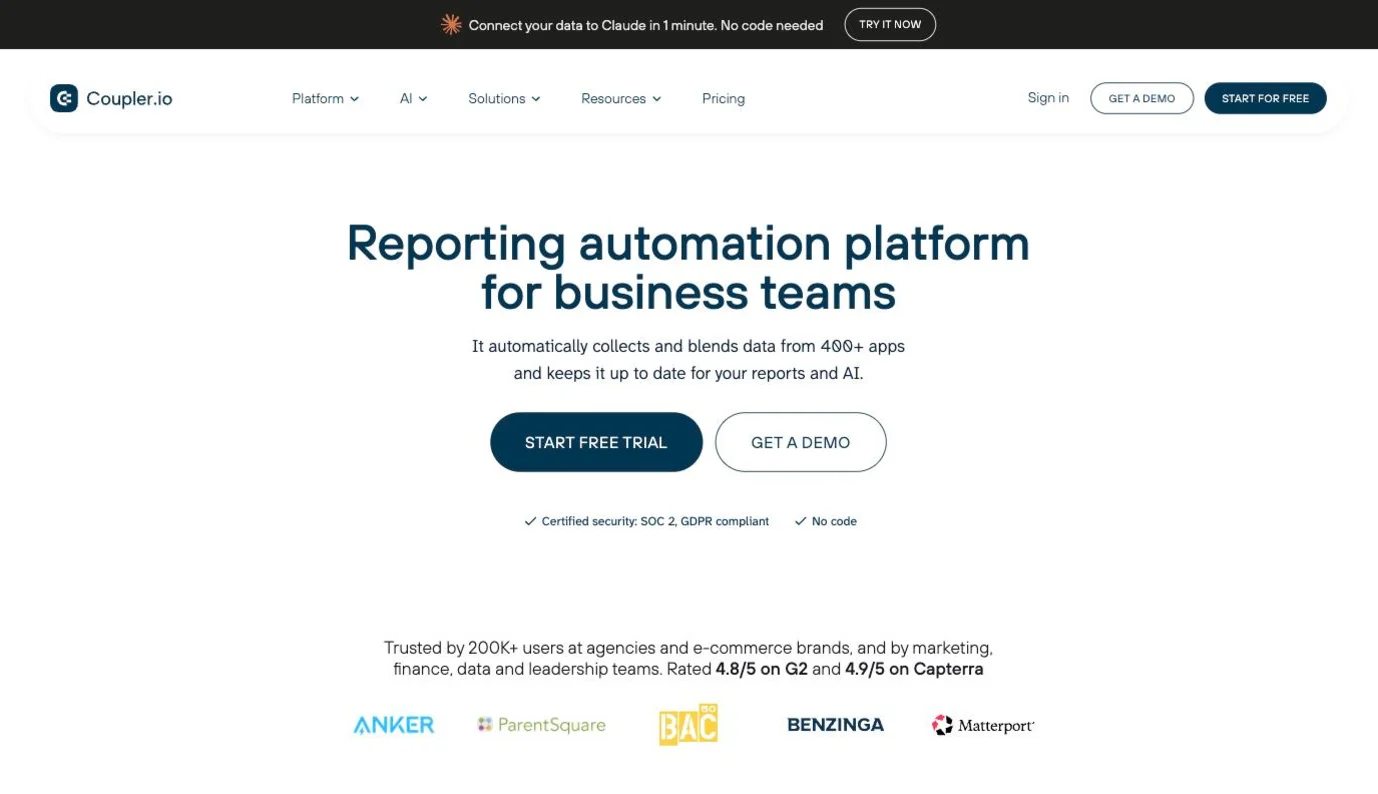
Coupler.io homepage presenting its reporting automation platform for business teams

Coupler.io is a reporting automation platform for business teams. It pulls data from 400+ sources, Meta Ads, Google Ads, TikTok Ads, Shopify, Klaviyo, Amazon Ads and Amazon Seller Central among them, into spreadsheets, BI tools, warehouses and AI assistants, and keeps a copy in its own storage for dashboards. It reads from source systems and writes nothing back to them.

Key features

▪400+ sources. Ad platforms, Shopify, Klaviyo and Amazon next to sales, finance and operations tools.
▪Destinations. Google Sheets, Excel, Looker Studio, Power BI, BigQuery, Snowflake, PostgreSQL, Redshift and Supabase.
▪AI integrations. Claude, ChatGPT, Copilot, Gemini and custom MCP clients.
▪Built-in storage and dashboards. Data kept inside Coupler.io, with dashboard templates on top.
▪Automations. Available on Pro and Custom.

Strengths

One tool for several teams. Marketing, sales, finance and operations reports run from one account, with an ecommerce solution alongside.
Unlimited users and volume from Active. No per-seat or per-row charges from $99/month.
SOC 2 Type II. With GDPR compliance.

Limitations

No attribution model of its own. Conversions arrive as each ad platform reports them.
No product costs or margin. No COGS, contribution margin or POAS per campaign.
No write-back. No conversions go back to the ad platforms, and no budget changes from Coupler.io.

Pricing

The free plan covers 1 source, 1 account, 1 destination, manual refresh and 100 rows per run. Starter costs $32/month, or $24/month billed annually, for 3 accounts, 1 destination, a daily refresh, 1 user and 5,000 rows per run. Active is $132/month or $99/month billed annually (15 accounts, 3 destinations, unlimited users and volume), and Pro $259 or $199 (50 accounts, unlimited destinations, hourly refresh). Custom adds a 15-minute refresh and SSO. There's a 7-day trial.

Reviews

Coupler.io scores 4.8 on G2 (104 reviews).

Bottom line

Coupler.io suits companies that want marketing reporting next to sales, finance and operations data, with storage and dashboards included. For ad decisions it stops at the platforms' own numbers, and nothing goes back to the ad platforms.

Porter Metrics

★4.6

Best for: marketers and analysts that build Looker Studio reports from ready-made templates and pay per connected account.
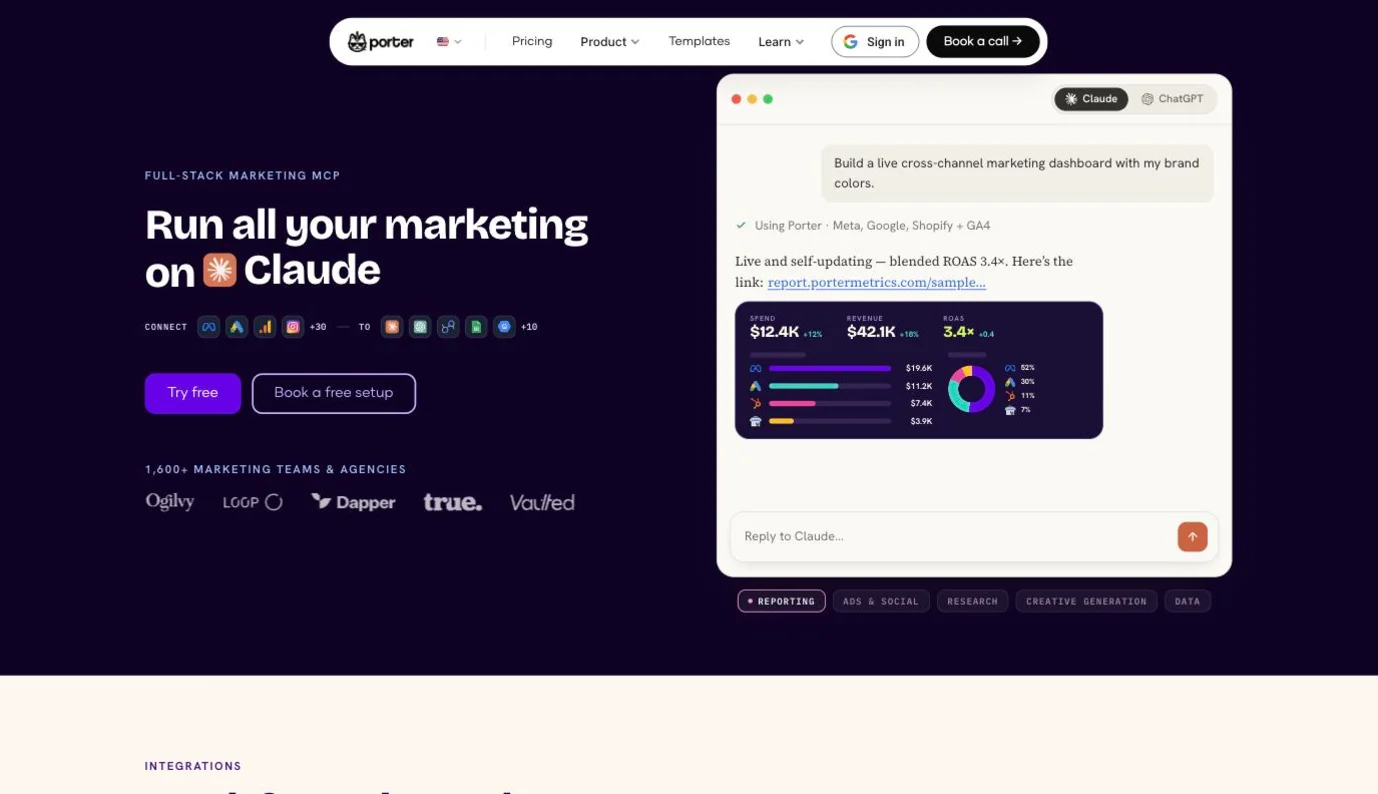
Porter Metrics homepage presenting marketing reports built from Claude and ChatGPT

Porter Metrics is a no-code marketing data warehouse. It connects Meta Ads, Google Ads, GA4, Shopify, HubSpot, TikTok, Instagram and Google Sheets among 20 to 30+ sources, and sends the data to Looker Studio, Google Sheets, Power BI, BigQuery and AI chats. Ecommerce templates cover profit and unit economics with COGS imported from a spreadsheet, and an AI automation can create campaigns and pause ads once you give permission.

Key features

▪100+ free templates. Ecommerce reports included, such as "Profits & unit economics" and "Acquisition & attribution".
▪Destinations. BigQuery, Looker Studio, Google Sheets, Power BI, Slack and Zapier.
▪AI chats. Claude, ChatGPT, Gemini and any MCP client.
▪COGS from Google Sheets. Imported product costs feed profit and ROI metrics.
▪AI automation in the ad platforms. New campaigns are created paused, Porter asks before it writes, and each pause is billed in credits.

Strengths

Five-minute setup. Templates cover the first reports, with nothing to build from scratch.
Per-account pricing. You pay for the accounts you connect, $15 a month for one and less per account at volume.
Profit metrics from your own costs. COGS from a sheet turns revenue reports into profit and ROI.

Limitations

No attribution model of its own. Conversions are each ad platform's own.
No contribution margin. Profit and ROI rest on COGS imported from a spreadsheet, with no CM2, CM3 or POAS.
No conversions sent back. Nothing goes back to the ad platforms server-to-server.

Pricing

A free-forever plan keeps 30 days of history. Grow costs $15/month per account, or $12.50/month billed annually ($150/year), with volume rates of $5 per account from 21 accounts and less at higher volumes. Build and Scale carry no published price. There's a 14-day trial with no card.

Reviews

Porter Metrics scores 4.6 on G2 (303 reviews).

Bottom line

Porter Metrics suits marketers who want ready-made Looker Studio reports and per-account pricing. It stops at platform-reported conversions and spreadsheet COGS: there's no attribution model, no contribution margin and no conversions sent back.

Polar Analytics

★4.9

Best for: commerce brands with analysts who want a dedicated Snowflake database with SQL access, Amazon and NetSuite data next to the store, and AI agents working on it.
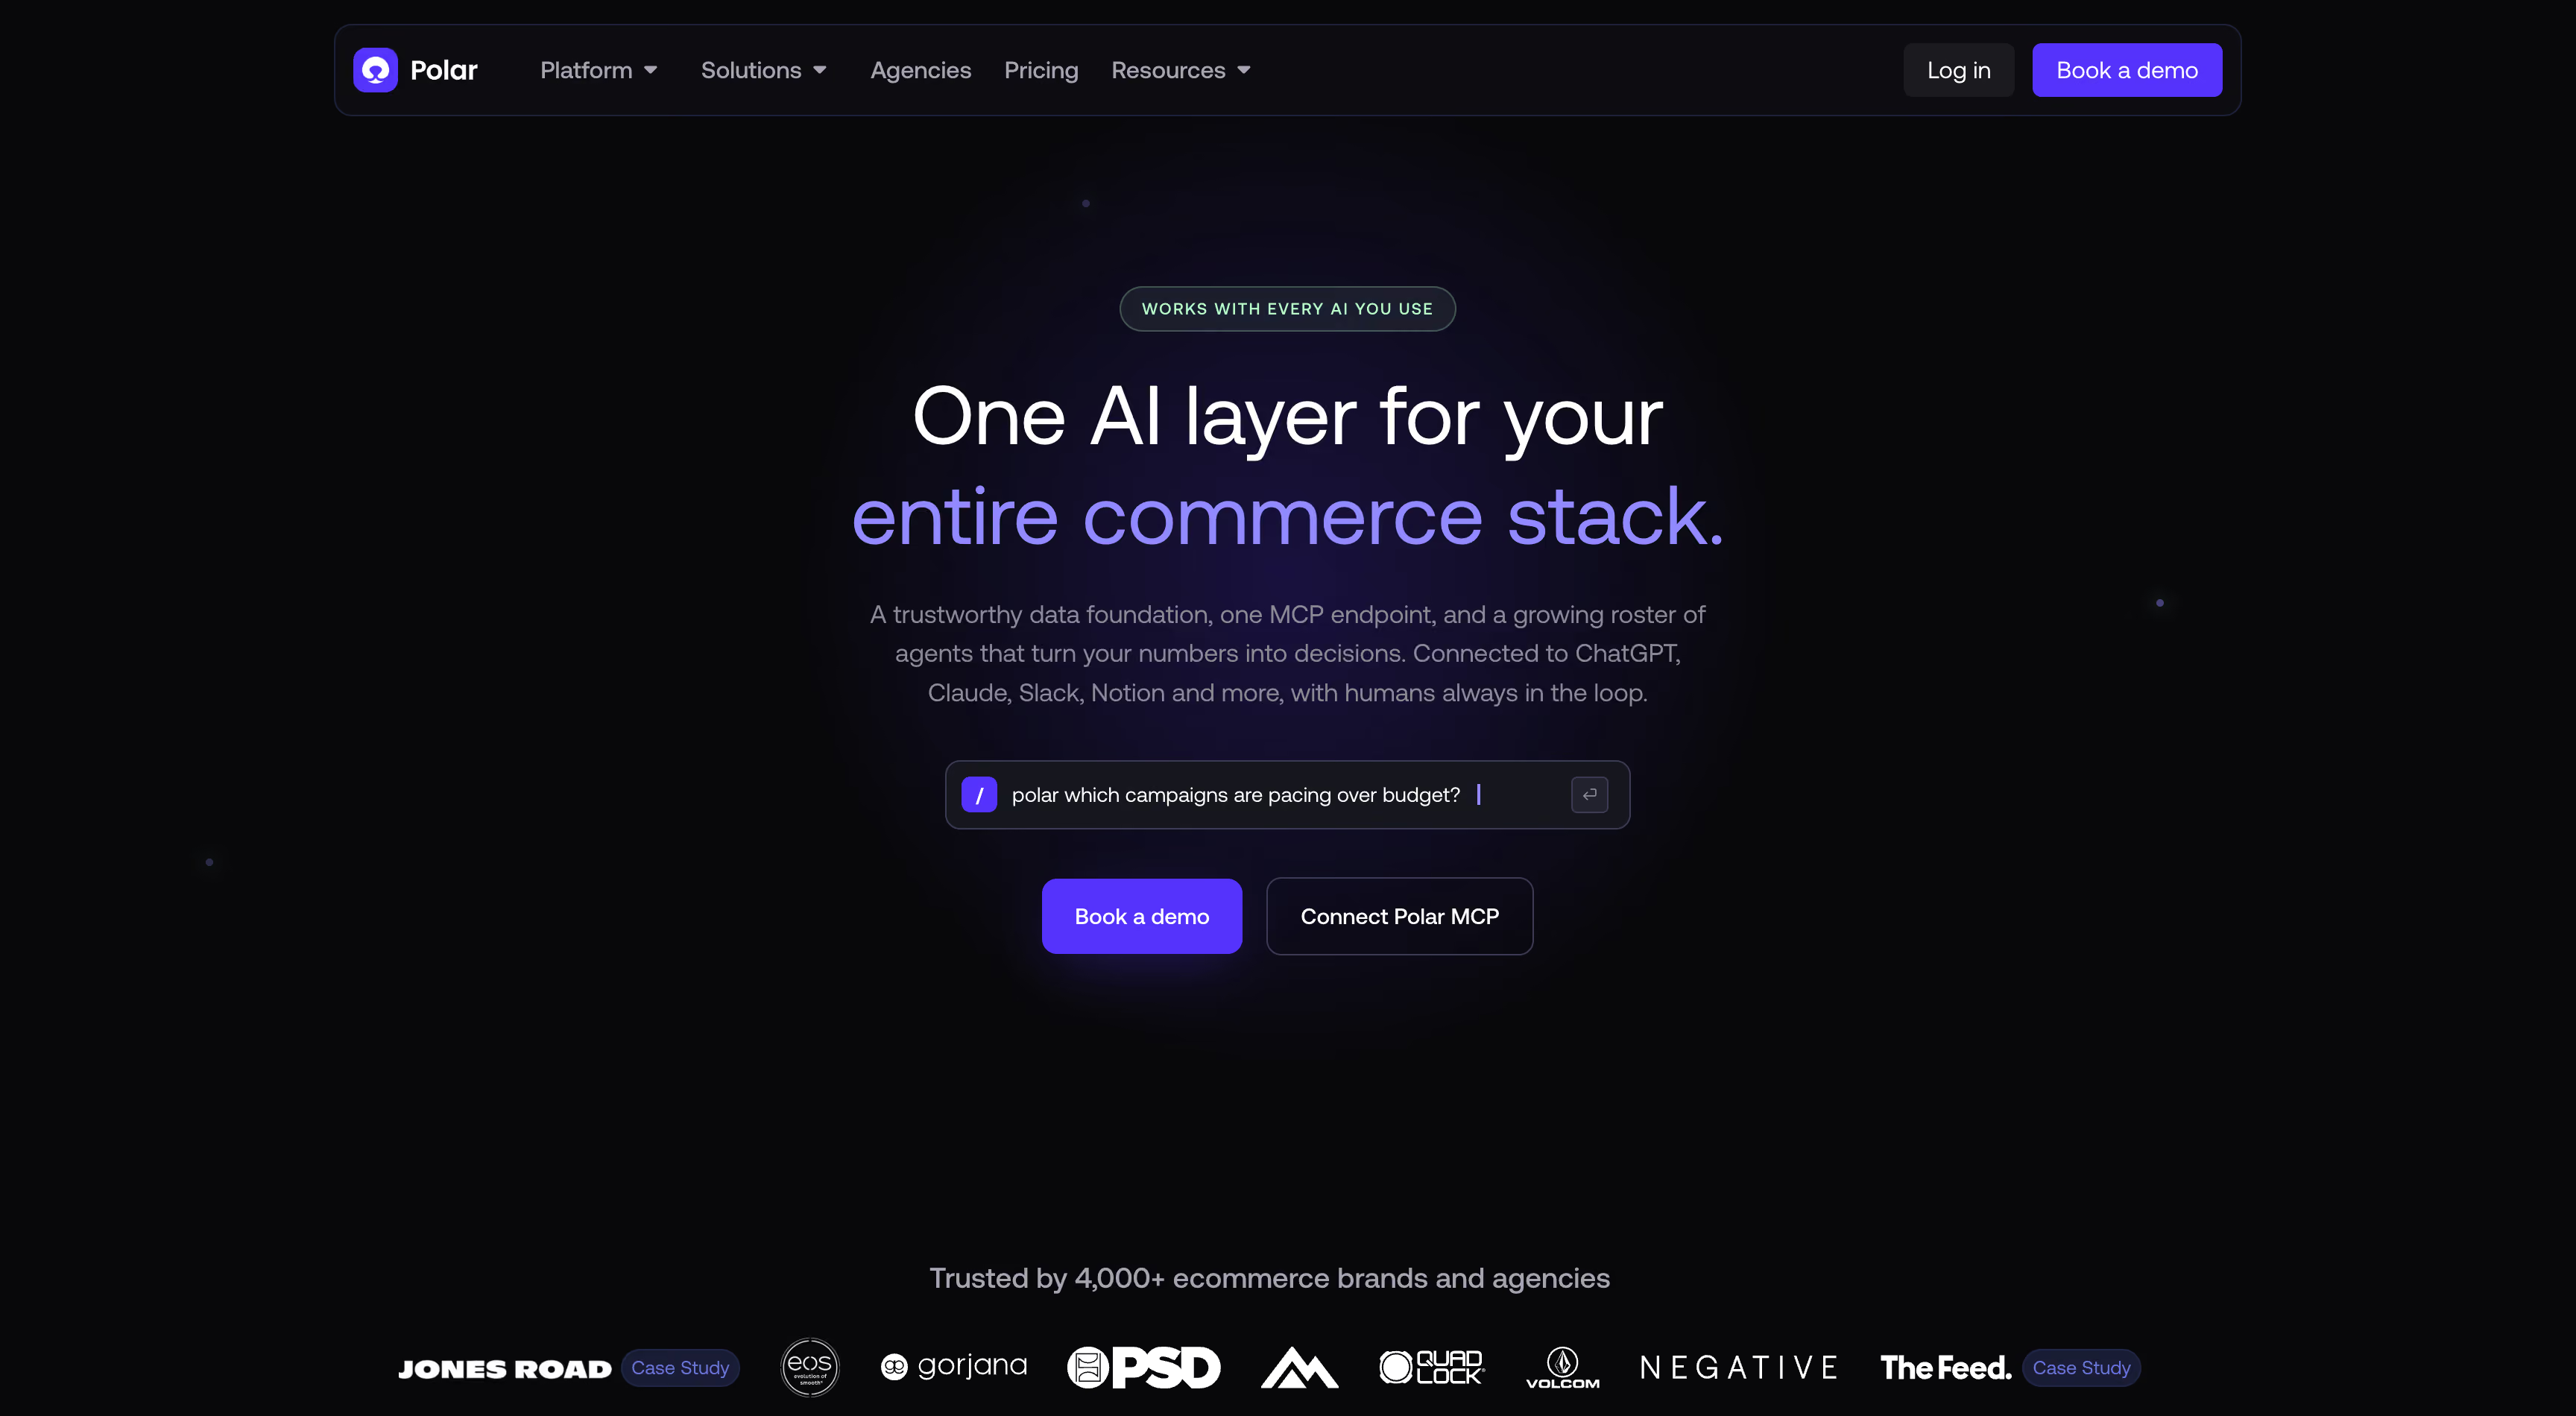
Polar Analytics homepage presenting its ecommerce analytics platform

Polar Analytics is an AI data platform for commerce. It brings Shopify, Amazon, Meta, Google, TikTok, Klaviyo, Recharge, Skio and NetSuite data into a dedicated Snowflake database per brand, tracks visitors with its own Polar Pixel and reports profit and contribution margin by channel and product. Operator, an agent in Slack, shifts ad budgets and pauses ads once you approve.

Key features

▪Snowflake per brand. A dedicated database with read-only SQL access, open to Power BI or any other BI tool, plus MCP for Claude and ChatGPT.
▪Polar Pixel. A Shopify App Pixel behind multi-touch attribution with 10 attribution models, plus incrementality tests run with a data scientist.
▪Profit and contribution margin. By channel and product, next to LTV and cohorts.
▪Advertising Signals. Conversion events sent to Meta and Google Ads.
▪Operator. A Slack agent that shifts ad budgets and pauses ads after approval.

Strengths

SQL access to your own database. Analysts query the brand's Snowflake database directly.
Contribution margin by channel and product. Profit reporting goes past revenue.
Marketplace and ERP data. Amazon Seller and Vendor Central, Amazon Ads and NetSuite sit next to the store data.

Limitations

Conversions go to Meta and Google only. Advertising Signals covers those two platforms and is available on request.
Google Sheets costs extra. Sheets mirroring is part of a BI add-on.
US hosting by default. EU hosting is available on request.

Pricing

Pricing scales with annual GMV, and the pricing page shows no figures. The Shopify App Store listing gives the Core Plan from $750/month.

Reviews

Polar Analytics holds 4.9 on the Shopify App Store (116 reviews) and 4.7 on G2 (23).

Bottom line

Polar suits a commerce brand whose analysts want its data in a Snowflake database of its own, Amazon and NetSuite included, with AI agents working on it. Conversions go back to Meta and Google only, and Google Sheets is an add-on.
Compare to Admetrics →

Triple Whale

★4.5

Best for: ecommerce brands that want an AI agent, Moby, on top of their store and ad data, with pixel-based attribution and ad platform controls in the same app.
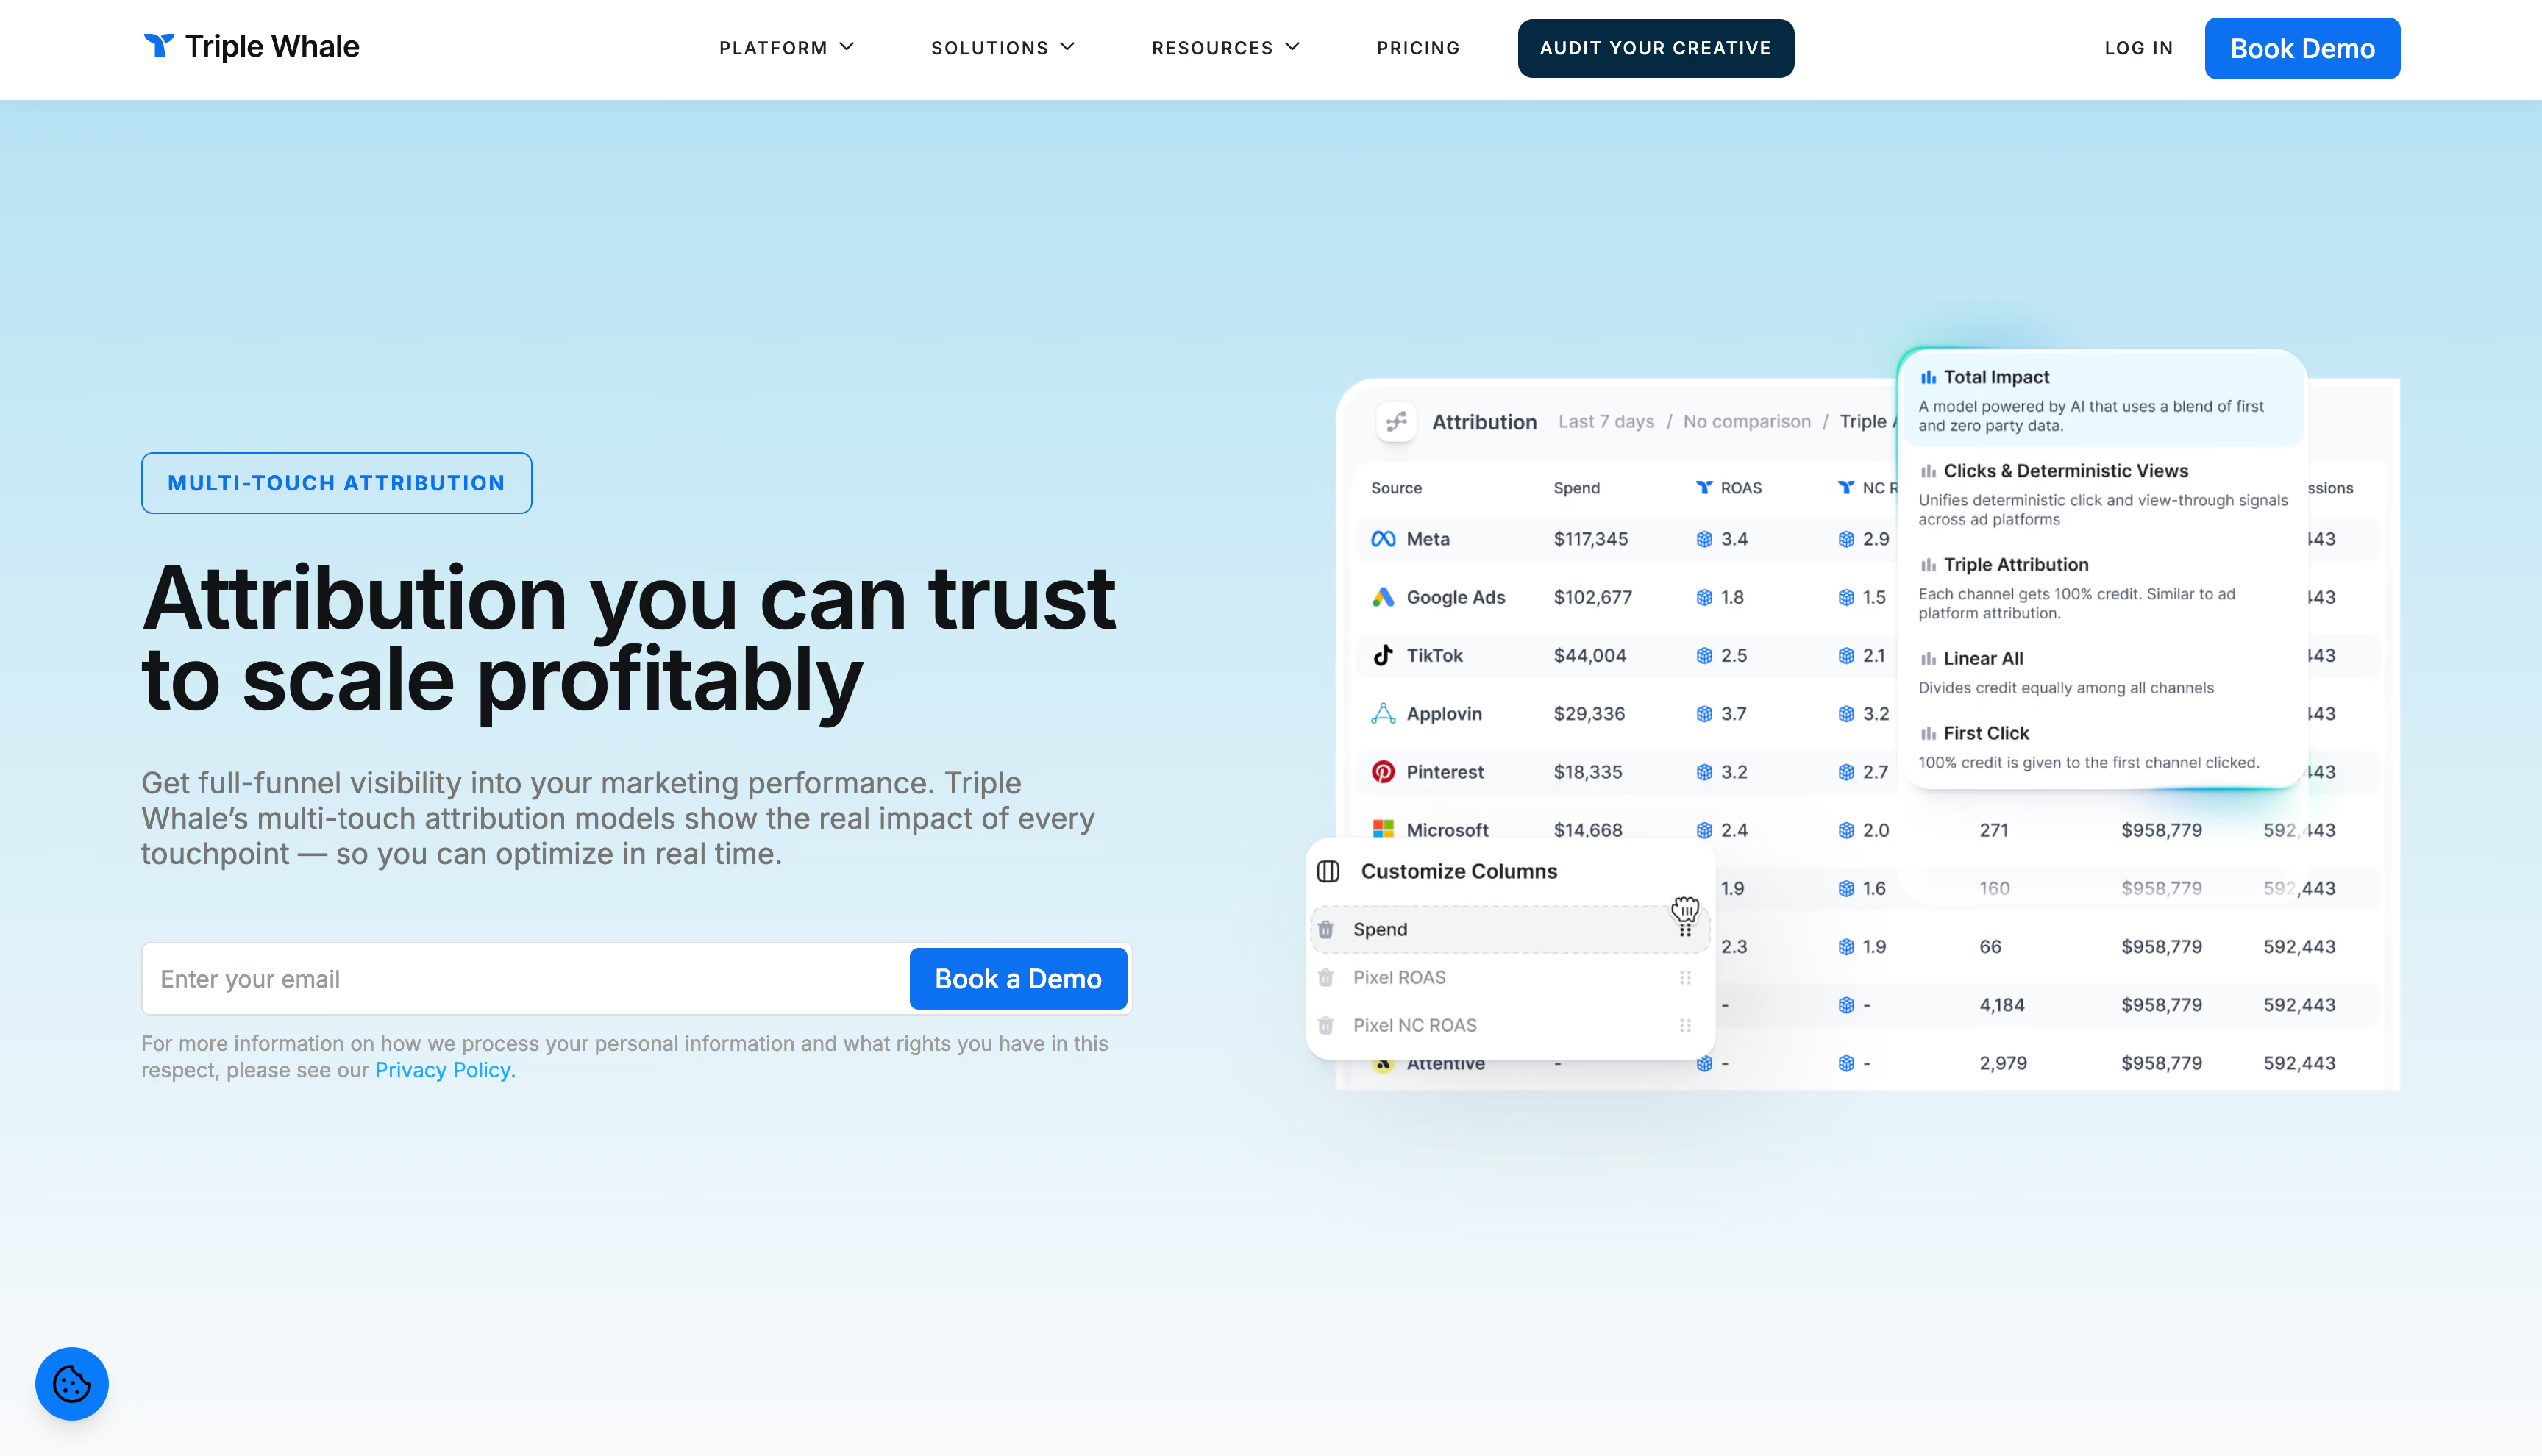
Triple Whale homepage presenting its analytics and attribution platform for Shopify brands

Triple Whale combines its own pixel, attribution and an AI agent for ecommerce brands. Triple Pixel feeds first- and last-click attribution on Free, multi-touch on Starter and Total Impact on Advanced. Sonar Optimize sends conversions back to the ad platforms, and Moby queues budget and status changes for approval before it executes them. Data leaves through Google Sheets and CSV exports on Advanced and warehouse sync on Enterprise.

Key features

▪Triple Pixel. Pixel tracking behind first-click, last-click, multi-touch and Total Impact attribution, depending on plan.
▪Sonar Optimize. Conversions sent back to the ad platforms through CAPI and passback, Reddit's CAPI included.
▪Moby 2. An AI agent that answers questions on the data and queues ad changes for approval.
▪Ad Platform Controls. Budget, status and other changes from inside Triple Whale, from Starter.
▪Compass. Mix modeling and GeoLift tests as an add-on.

Strengths

Attribution on its own pixel. Triple Pixel feeds the models, up to Total Impact on Advanced.
Ad changes from the same app. Budgets and statuses change without opening each ad manager.
Mix modeling and lift tests. Compass adds MMM and GeoLift to the pixel data.

Limitations

No contribution margin. Inventory and profitability analysis comes on Advanced, with no CM2, CM3 or POAS by campaign.
Data out by plan. Multi-Google Sheets and CSV exports start on Advanced, warehouse syncing comes on Enterprise and up, and data-out APIs on Enterprise.

Pricing

There's a free plan at $0. The pricing page shows two conflicting sets of prices: one lists Starter at $179/month and Advanced at $259/month on a 12-month commitment, the other Starter at $299/month, Advanced at $389/month and Professional at $749/month. Prices exclude tax.

Reviews

Triple Whale scores 4.5 on G2 (482 reviews) and 3.4 on Trustpilot (72).

Bottom line

Triple Whale suits brands that want attribution, an AI agent and ad controls in one app and do most of their analysis inside it. Data out stops at Sheets and CSV until Enterprise, and there's no contribution margin by campaign.
Compare to Admetrics →

Adverity

★4.4

Best for: enterprises and agencies with data teams that need governed marketing pipelines: hundreds of connectors, transformation in code or no-code, and quality monitoring before data reaches the warehouse.

Adverity homepage presenting its marketing data platform

Adverity is an enterprise-grade marketing ETL. Adverity Connect pulls data from 600+ pre-built connectors, Google Ads, Meta, TikTok Ads, Amazon DSP and Shopify among them, transforms it and sends it to 40+ destinations, from Google Sheets and Looker Studio to Snowflake and Databricks. Atlas adds a marketing knowledge layer on top. Enterprise onboarding takes 30 to 60 days.

Key features

▪Adverity Connect. 600+ pre-built connectors for ad, analytics and commerce platforms.
▪Transformation. No-code tools, Python functions, dbt, data mapping and a data dictionary.
▪Data quality and governance. Four default quality monitors, roles, SSO and an audit trail.
▪40+ destinations. Google Sheets, Excel, Looker Studio, Power BI, Tableau, BigQuery, Snowflake, Databricks, Redshift, Azure Synapse, Fabric and SQL Server, plus audience destinations.
▪Atlas. A marketing knowledge layer over the collected data.

Strengths

Transformation inside the pipeline. Python, dbt and mapping shape the data before it reaches the destination.
Governance for large teams. Quality monitors, roles, SSO and an audit trail.
Hosting by workspace. EU and US facilities with per-workspace routing, plus ISO 27001, SOC 2 Type 2 and GDPR.

Limitations

No attribution model of its own. Conversions arrive as each ad platform reports them.
No product costs or margin. No COGS, contribution margin or POAS per campaign.
No conversions sent back to Meta, Google or TikTok. Offline conversion uploads cover LinkedIn.

Pricing

Adverity prices on custom quote only. Dashboards are an add-on.

Reviews

Adverity scores 4.4 on G2 (331 reviews).

Bottom line

Adverity suits enterprises and agencies whose data teams need many connectors, transformation and governance before data lands in a warehouse or BI tool, and who can plan for a 30- to 60-day onboarding. It moves and shapes each platform's numbers. Attribution, product margin and conversions sent back stay outside it.

Improvado

★4.4

Best for: large marketing teams and agencies that want 1,400+ sources governed in their own warehouse, with AI agents on top and annual contracts in the budget.
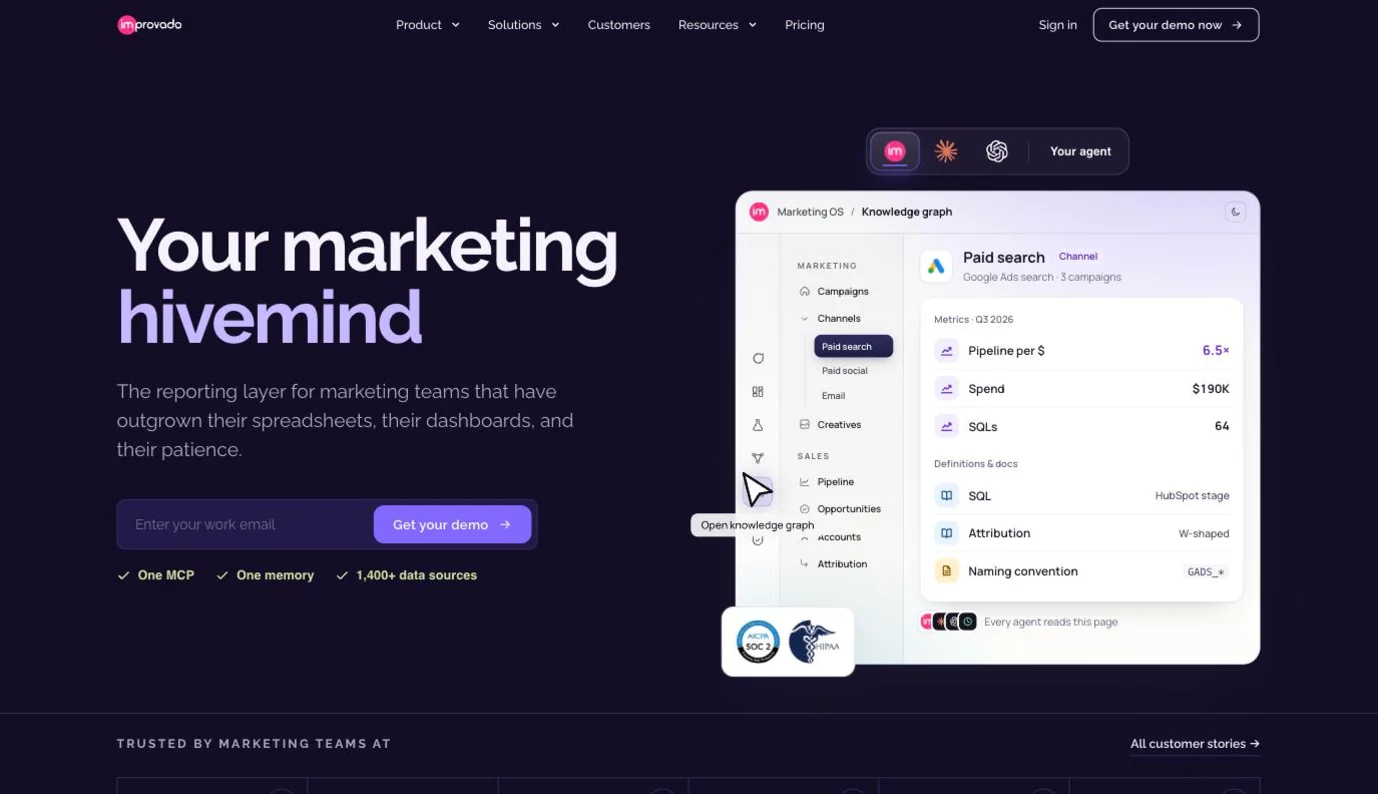
Improvado homepage presenting its reporting layer and marketing knowledge graph

Improvado is a marketing data platform with AI agents on top, sold as a "marketing agentic OS". It connects 1,400+ sources, Google Ads, Meta Ads, TikTok Ads, Amazon Ads, Shopify, Klaviyo, Stripe and GA4 among them, applies transformation and governance rules, and loads the data into warehouses, BI tools, Google Sheets and AI agents through MCP. An agent drafts budget and bid changes for approval, and Advanced Analytics adds attribution and mix modeling as a paid add-on.

Key features

▪1,400+ data sources. Ad platforms, Shopify, Klaviyo, Stripe and GA4 among them.
▪Destinations. Snowflake, BigQuery, Databricks, Redshift, Looker Studio, Tableau, Power BI, Google Sheets and Excel.
▪MCP. Any AI agent can work with the data, with an MCP-only plan for teams that need just that.
▪Transformation and governance. From 3 to 100 rules, depending on plan.
▪Advanced Analytics. First-touch, last-touch, linear, position-based and time-decay models, plus MMM and incrementality, run on warehouse data.

Strengths

Source coverage. 1,400+ sources feed one warehouse.
Rules before reporting. Transformation and governance rules run before data reaches BI tools or agents.
Compliance options. SOC 2 Type II, HIPAA from Growth, a GDPR DPA and EU data residency.

Limitations

Attribution costs extra and has no pixel. Advanced Analytics is an add-on from $20k/year on Growth and Enterprise, modeled from warehouse data with no tracking of its own.
No product costs or margin. No COGS, contribution margin or POAS per campaign.
No conversions sent back. Nothing goes back to the ad platforms server-to-server.

Pricing

MCP Only costs $100/month. Starter runs from $20,000/year and Growth from $41,700/year, and Enterprise goes through sales. Advanced Analytics is an add-on from $20,000/year. Setup takes about two weeks.

Reviews

Improvado scores 4.4 on G2 (95 reviews) and 4.5 on Capterra (22).

Bottom line

Improvado suits large teams that want many sources governed in a warehouse, with AI agents on top and the budget for annual contracts. Attribution is a paid add-on on warehouse data, and there's no product margin or conversions sent back.

Best Supermetrics alternative: final verdict

Admetrics is the best Supermetrics alternative for ecommerce brands that want tracking, attribution, contribution margin and budget moves on one set of order data. It syncs those numbers to Google Sheets or a warehouse, so the reports you built on Supermetrics show attributed results after product costs instead of each platform's own count. Plans start at $399/month, and the 21-day free trial needs no card.

Book a demo