
.avif)
Your GA4 dashboard says organic search drove 40% of last month's conversions. Mixpanel says onboarding is converting well. Your ad platforms report a blended ROAS north of 3x. Everyone's satisfied, until finance asks where the actual profit went, and nobody can draw a line from any of those numbers to a dollar in the bank.
That's the real problem with marketing analytics in 2026: not a shortage of dashboards, but a surplus, each measuring a different slice in a different currency, with no tool reconciling them.
This guide compares the 10 tools marketing teams actually reach for in 2026, what each measures, and where it stops short.
Key Takeaways
From dashboard to decision: the real gap in marketing analytics tools
Every tool on this list will show you a number. Fewer tell you what to do about it, and fewer still do anything about it themselves.
That's really three products wearing the same label. A reporting tool shows what happened, sessions, spend, conversions, in a chart. A few interpret it, flagging a metric outside its normal range. A small handful execute: publish the creative, pause the campaign, shift the spend, without a human clicking through.
Most marketing analytics platforms in 2026 sit in the first tier or drift into the second. GA4's beta budgeting forecasts and suggests; it doesn't move a dollar. Domo's AI agents act inside Domo through its own MCP server, but that's action inside a BI tool, not a media plan. Triple Whale's Moby publishes creative and queues budget changes for approval, closer to the third tier. Admetrics runs the loop end to end.
The same split shows up in what "revenue" means here. Revenue says a campaign brought in money. Profit says whether that money was worth spending. Most marketing analytics software stops at the first number; the table below marks which carry the math to the second.
AI and predictive analytics: what changed in 2026, and what didn't
Predictive analytics in marketing platforms shifted significantly across 2025 and 2026, and "predictive analytics" now gets stretched to cover very different things depending on the tool.
At the narrow end, prediction means a probability score: GA4 flags likely churn, Salesforce's Einstein forecasts which leads convert, Domo's AI spots an anomaly before a human would. Useful, but passive; someone still has to see the flag.
A newer generation recommends a specific action instead. Amplitude's AI Agents suggest a fix and can turn it into a pull request. Domo's agents build a card or run a workflow on their own. A step up, but the action stays inside the product that generated it.
A prediction is only as good as the data feeding it. The marketing tools with predictive analytics worth trusting fixed the data foundation first, rather than bolting a forecast onto whatever data was sitting there.
How we tested and scored each marketing analytics tool
We scored the marketing analytics platforms on this list against four criteria, weighted in this order:
Scores draw on official product documentation, hands-on testing, and verified reviews from G2 and Capterra. Where a vendor's marketing and a tool's actual behavior disagreed, we scored the behavior, which is also why a familiar name doesn't guarantee a high rank among these marketing analytics tools.
Quick comparison: top marketing analytics tools (2026)
Admetrics
★4.97Best for: ecommerce and DTC teams whose real question isn't "what happened," but "what should we spend on next," and who don't want a separate warehouse, BI tool, and attribution platform to get there.
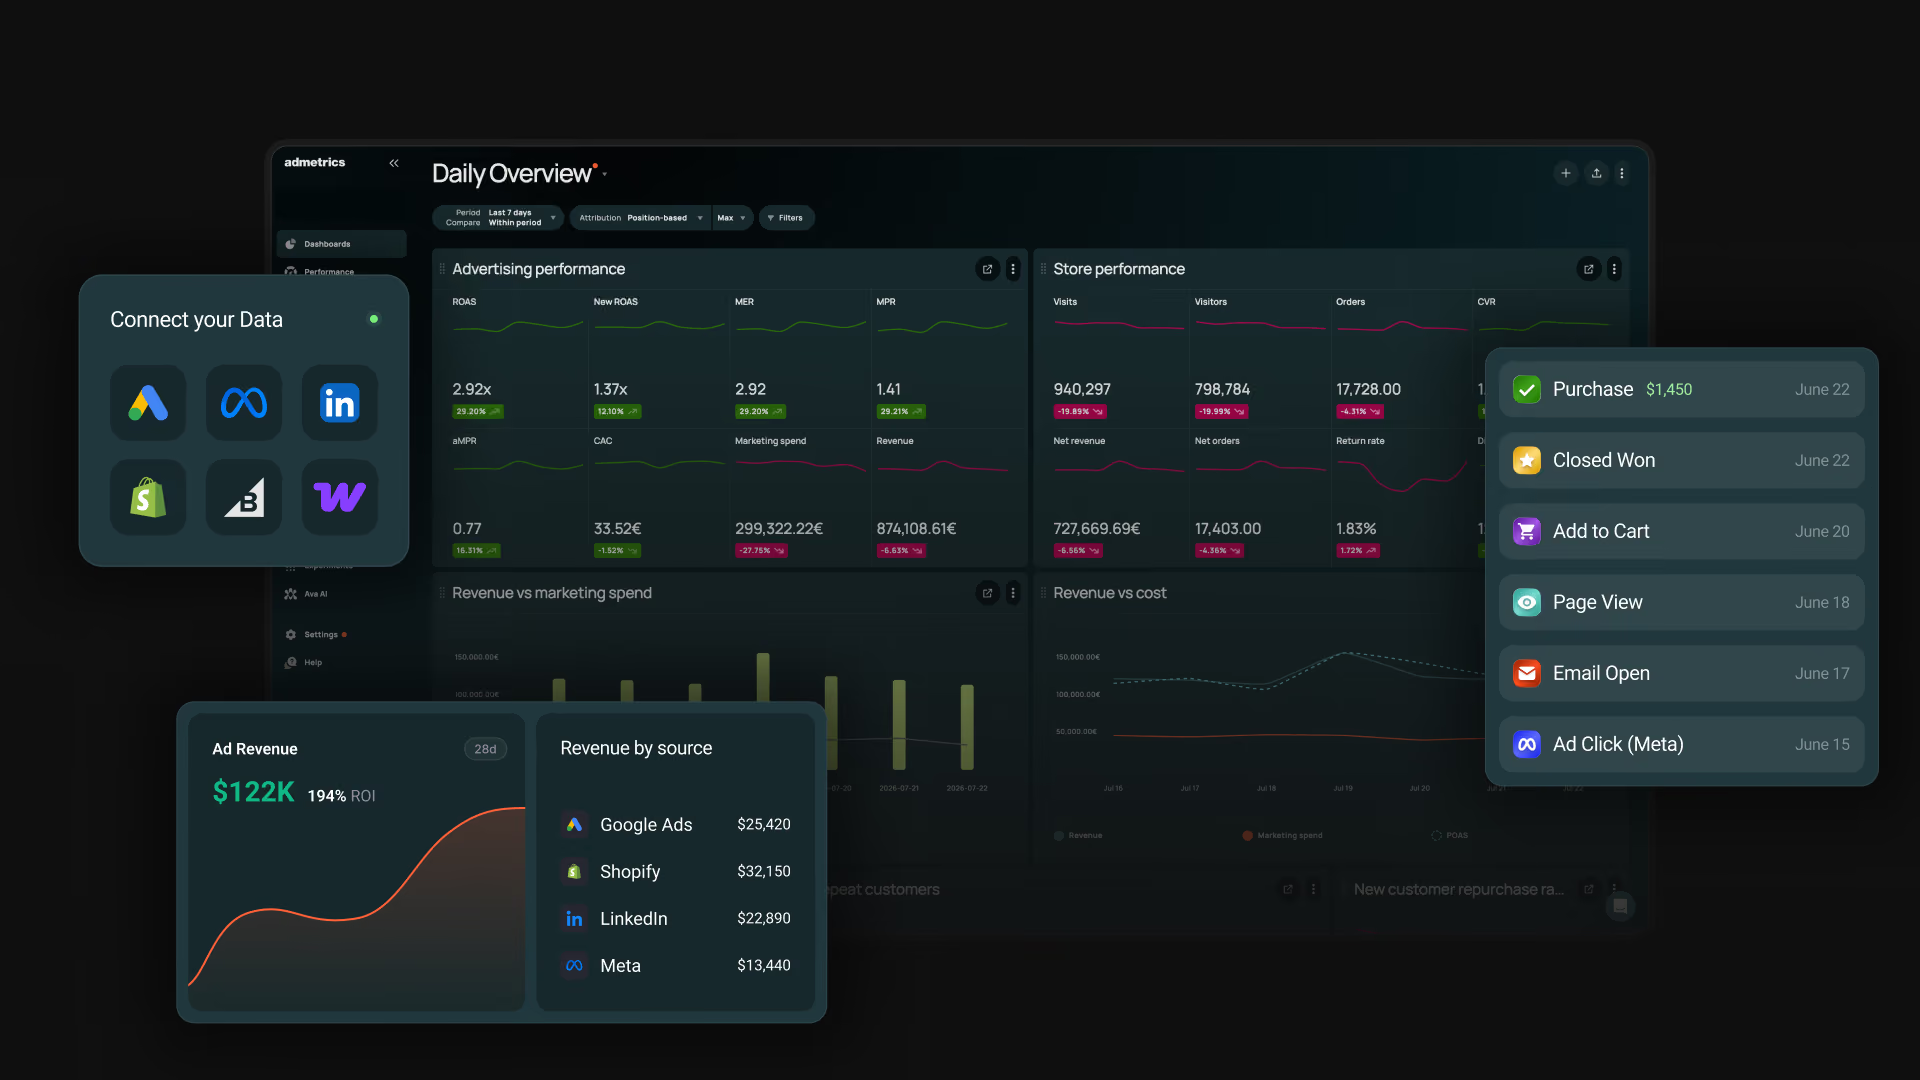
Most tools on this list report on one layer of the business: what people did on the site, what a campaign cost, what a dashboard can show a stakeholder. Admetrics is scoped narrower and deeper. Tracking sits server-side, attribution splits credit across the full touchpoint chain, profit gets calculated down to the SKU, a mix model estimates what each channel is really contributing, and a budget layer acts on that output, all inside one connected system instead of five separate purchases.
The tradeoff is real. A team that needs in-app product analytics or a shared data layer across marketing, product, and finance will hit its edges fast. Admetrics wasn't built to be a general BI platform. It answers one question precisely: which channel is actually making this business money.
Key features
Strengths
Limitations
Pricing
Two spend-based tiers cover most brands. $399 a month buys the Growth plan up to $20,000 in monthly ad spend, then adds 1.5% on top; $899 a month buys Business up to $70,000, with the marginal rate dropping to 1%. Above $100K a month, Admetrics quotes custom. Every tier comes with a trial window of two to three weeks and no card required upfront.Reviews
On G2, Admetrics sits at 4.97 out of 5. What stands out reading through the reviews isn't just satisfaction with the numbers, it's how often people mention getting help interpreting them, not just receiving them. Two named case studies back that up: a 60% ROAS gain at Ehrenkind, and Nyfter going from partial to roughly triple the trackable data after switching over.Bottom line
This entry only makes sense in context. Admetrics isn't trying to be a GA4 replacement or a general marketing analytics platform for every team. For a DTC brand deciding where next month's ad dollars go, it's built for that decision specifically. For anything broader on this list, one of the next nine tools is the better fit.Google Analytics 4 (GA4)
Best for: teams that need a free record of on-site behavior and are willing to add a dedicated tool for anything that touches profit or a spend decision.

Google spent most of 2026 pushing GA4 past pure reporting. Data-driven attribution is now the default model, per-conversion settings let a purchase and a newsletter signup use different crediting logic, and a beta Conversion Attribution Analysis report surfaces assisted, upper-funnel touchpoints that used to disappear under last-click.
None of that changes the underlying shape of the tool. It's built to log behavior and conversions, and it does that job best where Google's own ads and search sit, with everything else read at a discount.
Key features
Strengths
Limitations
Pricing
No cost on the standard tier, which is what almost every implementation runs. Stepping up to Google Analytics 360 buys unsampled data and a support relationship, quoted individually per enterprise account.Reviews
Sentiment splits along one line: grateful it's free and comprehensive for on-site behavior, skeptical the moment attribution or reconciliation comes up. The 2026 features are new enough that most reviews still describe last year's GA4.Bottom line
GA4 is worth keeping regardless of what else is in the stack. It's the free record of what happened on-site. Whether it can carry a budget decision on its own is a different question, and even with this year's upgrades, the honest answer is not yet.Mixpanel
Best for: product and growth teams that need a marketing analytics tool for what people do inside a website or app between signup and conversion, not which ad brought them there.
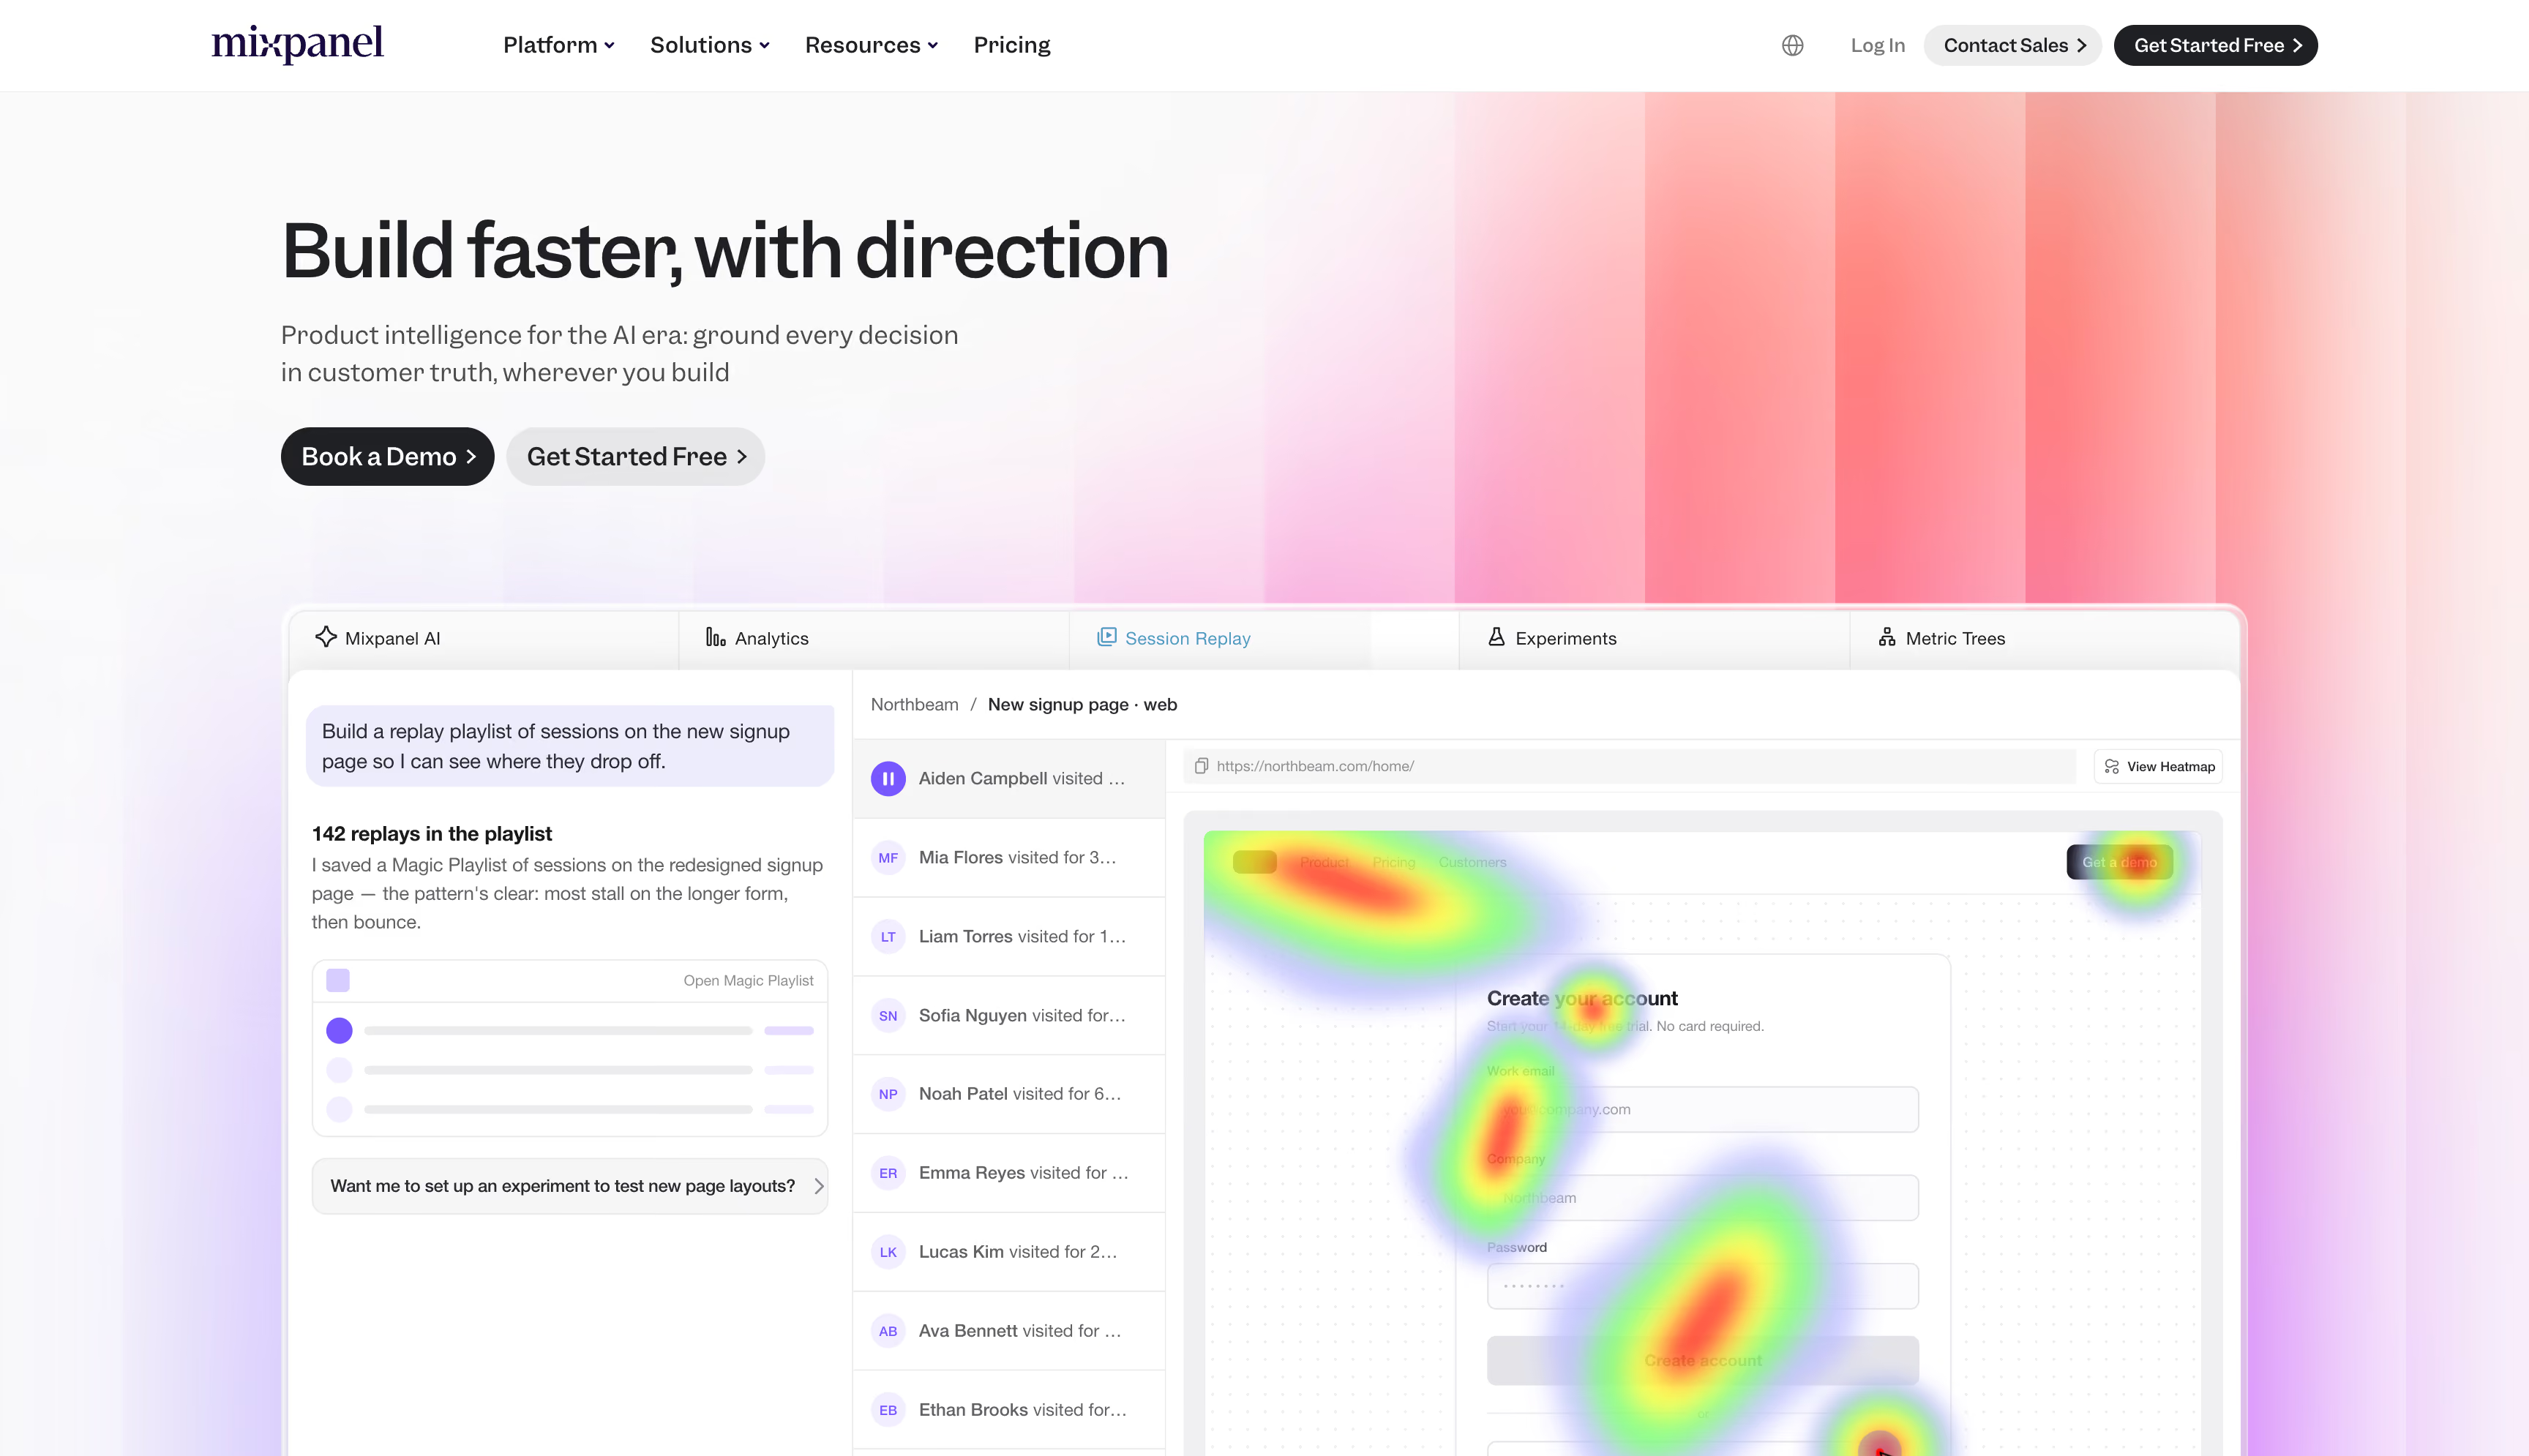
Mixpanel is rolling out Mixpanel AI through 2026, an always-on layer that surfaces what's working and breaking in a product without someone building a report first. Paired with Spark, an AI query builder, and an MCP server connecting Claude or ChatGPT to event data, it's leaning into natural-language analysis on top of its real strength: granular, event-level behavioral tracking.
That strength is also the boundary. Mixpanel logs what a user did. It was never built to say which ad campaign paid for that user, or whether the sale that followed made money.
Key features
Strengths
Limitations
Pricing
Free covers the first 1 million monthly events with unlimited seats. Growth bills $0.28 per 1,000 events above that. Enterprise is custom, typically starting around $25,000 a year.Reviews
The praise is consistent: an intuitive interface, real-time data, and funnels people enjoy building. The complaints surface once volume climbs, event-based costs stack up fast, and B2B teams often find group-level analytics priced as a separate add-on.Bottom line
For understanding what happens inside a product or site, Mixpanel is hard to beat among marketing analytics tools. For deciding which ad dollar produced that behavior and whether it was worth spending, it isn't the tool, and it was never trying to be.Amplitude
Best for: product-led growth and SaaS teams that want behavioral analytics and experimentation running as one system, not two separate tools.
In February 2026, Amplitude introduced AI Agents built to close the gap between shipping a feature and knowing whether it worked. The agents monitor usage on their own and push a fix or test idea into tools teams already build in, Claude, Cursor, Figma Make.
That agentic layer sits on top of what Amplitude has always done well: user-level behavioral tracking, paired natively with feature flags and experimentation.
Key features
Strengths
Limitations
Pricing
Starter is free for up to 10,000 monthly tracked users and 2 million events. Plus starts at $49/month, billed annually, scaling to 300,000 MTUs. Growth and Enterprise are custom-quoted, commonly landing in the tens of thousands a year.Reviews
People single out the same combination: a clean interface and data that updates fast enough to trust. The friction shows up on advanced features, unfamiliar users need ramp-up time, and teams report funnels that quietly break when an event fires differently on web versus mobile.Bottom line
Amplitude earns its place among marketing analytics tools for teams whose real question is what users do inside a product and what to test next. Whether the ad spend that brought those users in was profitable is a question it was never built to answer.HubSpot Marketing Hub
Best for: inbound marketing teams already running on HubSpot CRM who want a marketing analytics tool for campaign-to-revenue attribution without adding a separate BI platform.
HubSpot's attribution reporting reads directly off the CRM it's already sitting inside. Deals, contacts, and campaign touches live in one database, so a Revenue Attribution report doesn't require joining marketing data to sales data after the fact. Spring 2026 pushed campaign attribution further, tracing a touch all the way to a closed deal, ticket, or custom object.
That native fit is also where the ceiling shows up. The attribution logic is HubSpot's to define, not yours, and the moment revenue is measured outside a HubSpot deal record, the picture gets harder to complete.
Key features
Strengths
Limitations
Pricing
Starter begins around $20/month. Professional runs about $800/month. Enterprise starts at $3,600/month for 5 seats and 10,000 contacts, plus a mandatory $7,000 onboarding fee.Reviews
The pattern repeats: teams already living inside HubSpot's CRM find the reporting just works, and teams bending attribution logic to a funnel HubSpot didn't anticipate get frustrated fast. Support earns consistent credit; the price jump between tiers is the most repeated complaint.Bottom line
For a HubSpot-native marketing team, this marketing analytics tool is the fastest path from campaign to revenue number without adding another product. For anything involving profit per channel, or a budget that moves on its own, it stops well short.Salesforce Marketing Cloud Intelligence
Best for: enterprise marketing teams, especially ones already running Sales Cloud or Service Cloud, that need a marketing analytics platform to harmonize messy multi-source data and tie ad spend to closed revenue.
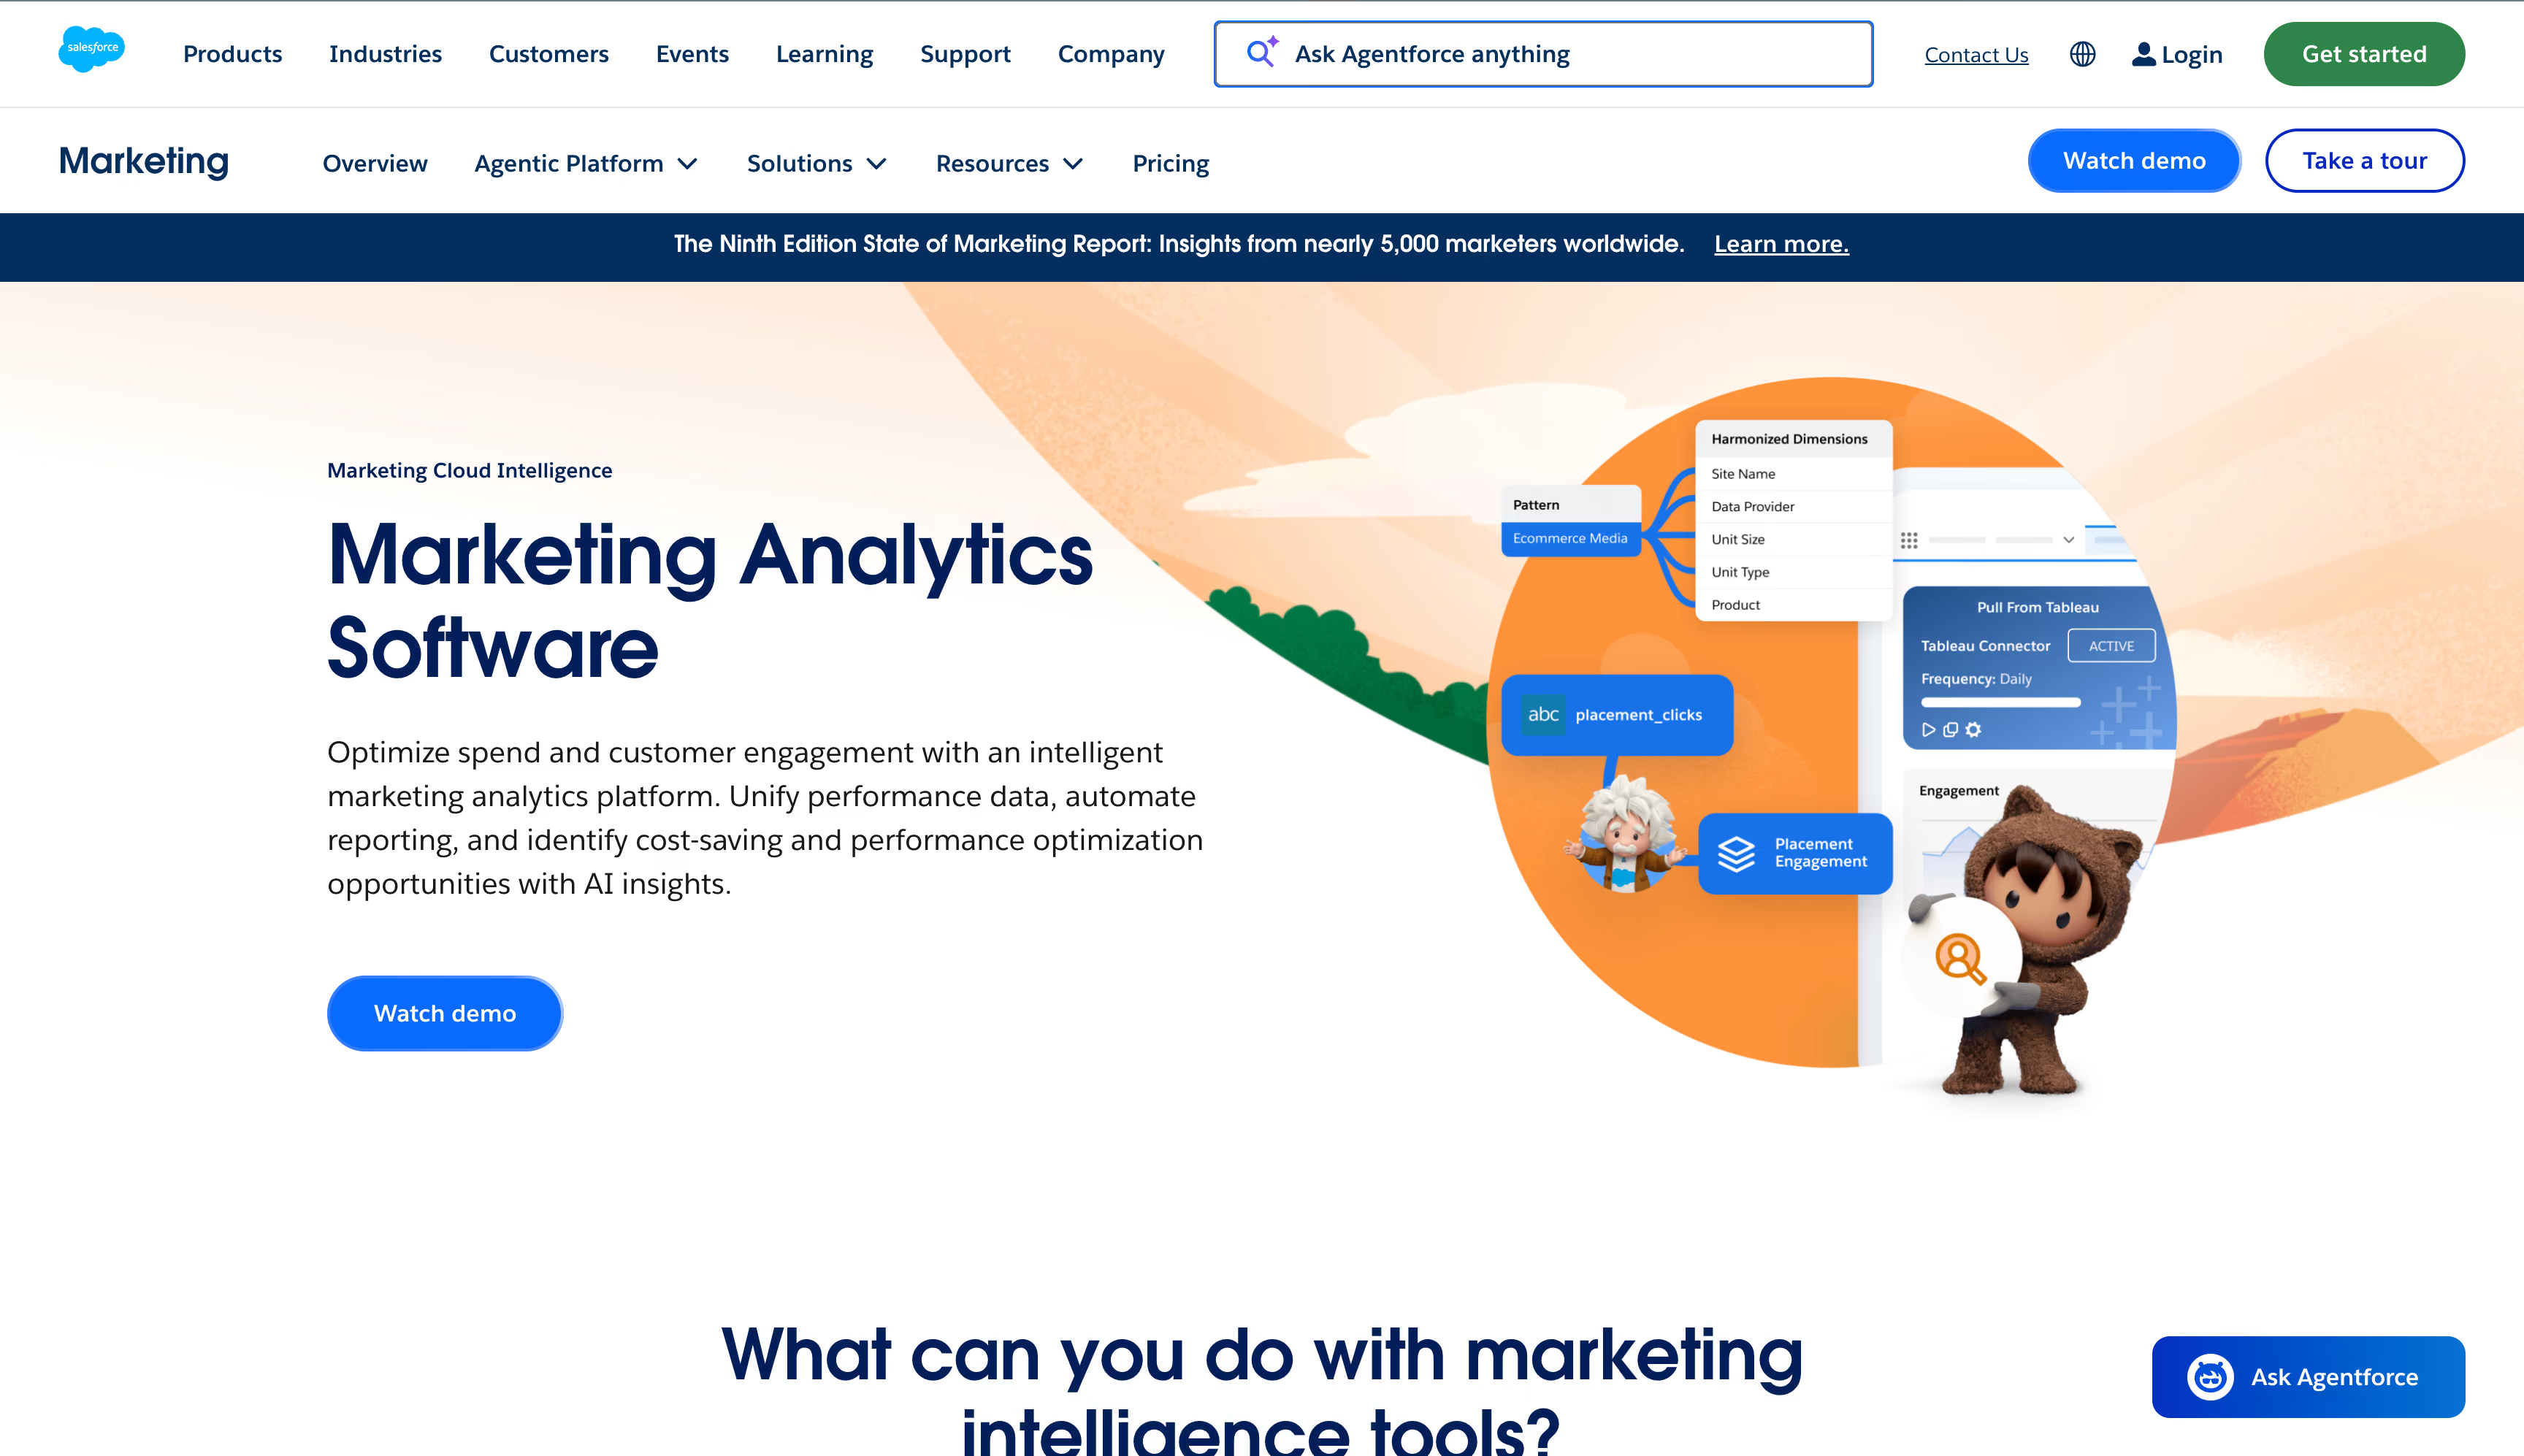
Marketing Cloud Intelligence, still widely known by its former name Datorama, solves a problem most tools here don't attempt: making inconsistent field names from a hundred ad platforms mean the same thing. Its AI-powered semantic modeling reads the label each source uses for a concept and folds it into one standardized field. TotalConnect pulls in offline data on top of that, spreadsheets, PDFs, whatever a legacy system exports.
That harmonization work is genuinely hard to replicate elsewhere. It's also why implementation here is measured in weeks, not days.
Key features
Strengths
Limitations
Pricing
Starter runs $3,000/month for 10 users and 3 million data rows. Growth is $10,000/month for 20 users and 20 million rows. The Plus tier is custom-quoted.Reviews
Harmonization genuinely works once set up, and setup is the hard part. Teams with dedicated data resources call it indispensable; teams without that support describe months to pay off.Bottom line
For a Salesforce-native enterprise with real data chaos to untangle and a budget to match, this marketing analytics platform does something few tools on this list can. For anyone without that scale, the price and setup cost outweigh what it adds.Domo
Best for: enterprise teams that want marketing data sitting alongside sales, finance, and product data in one BI platform, not a dedicated marketing analytics tool.
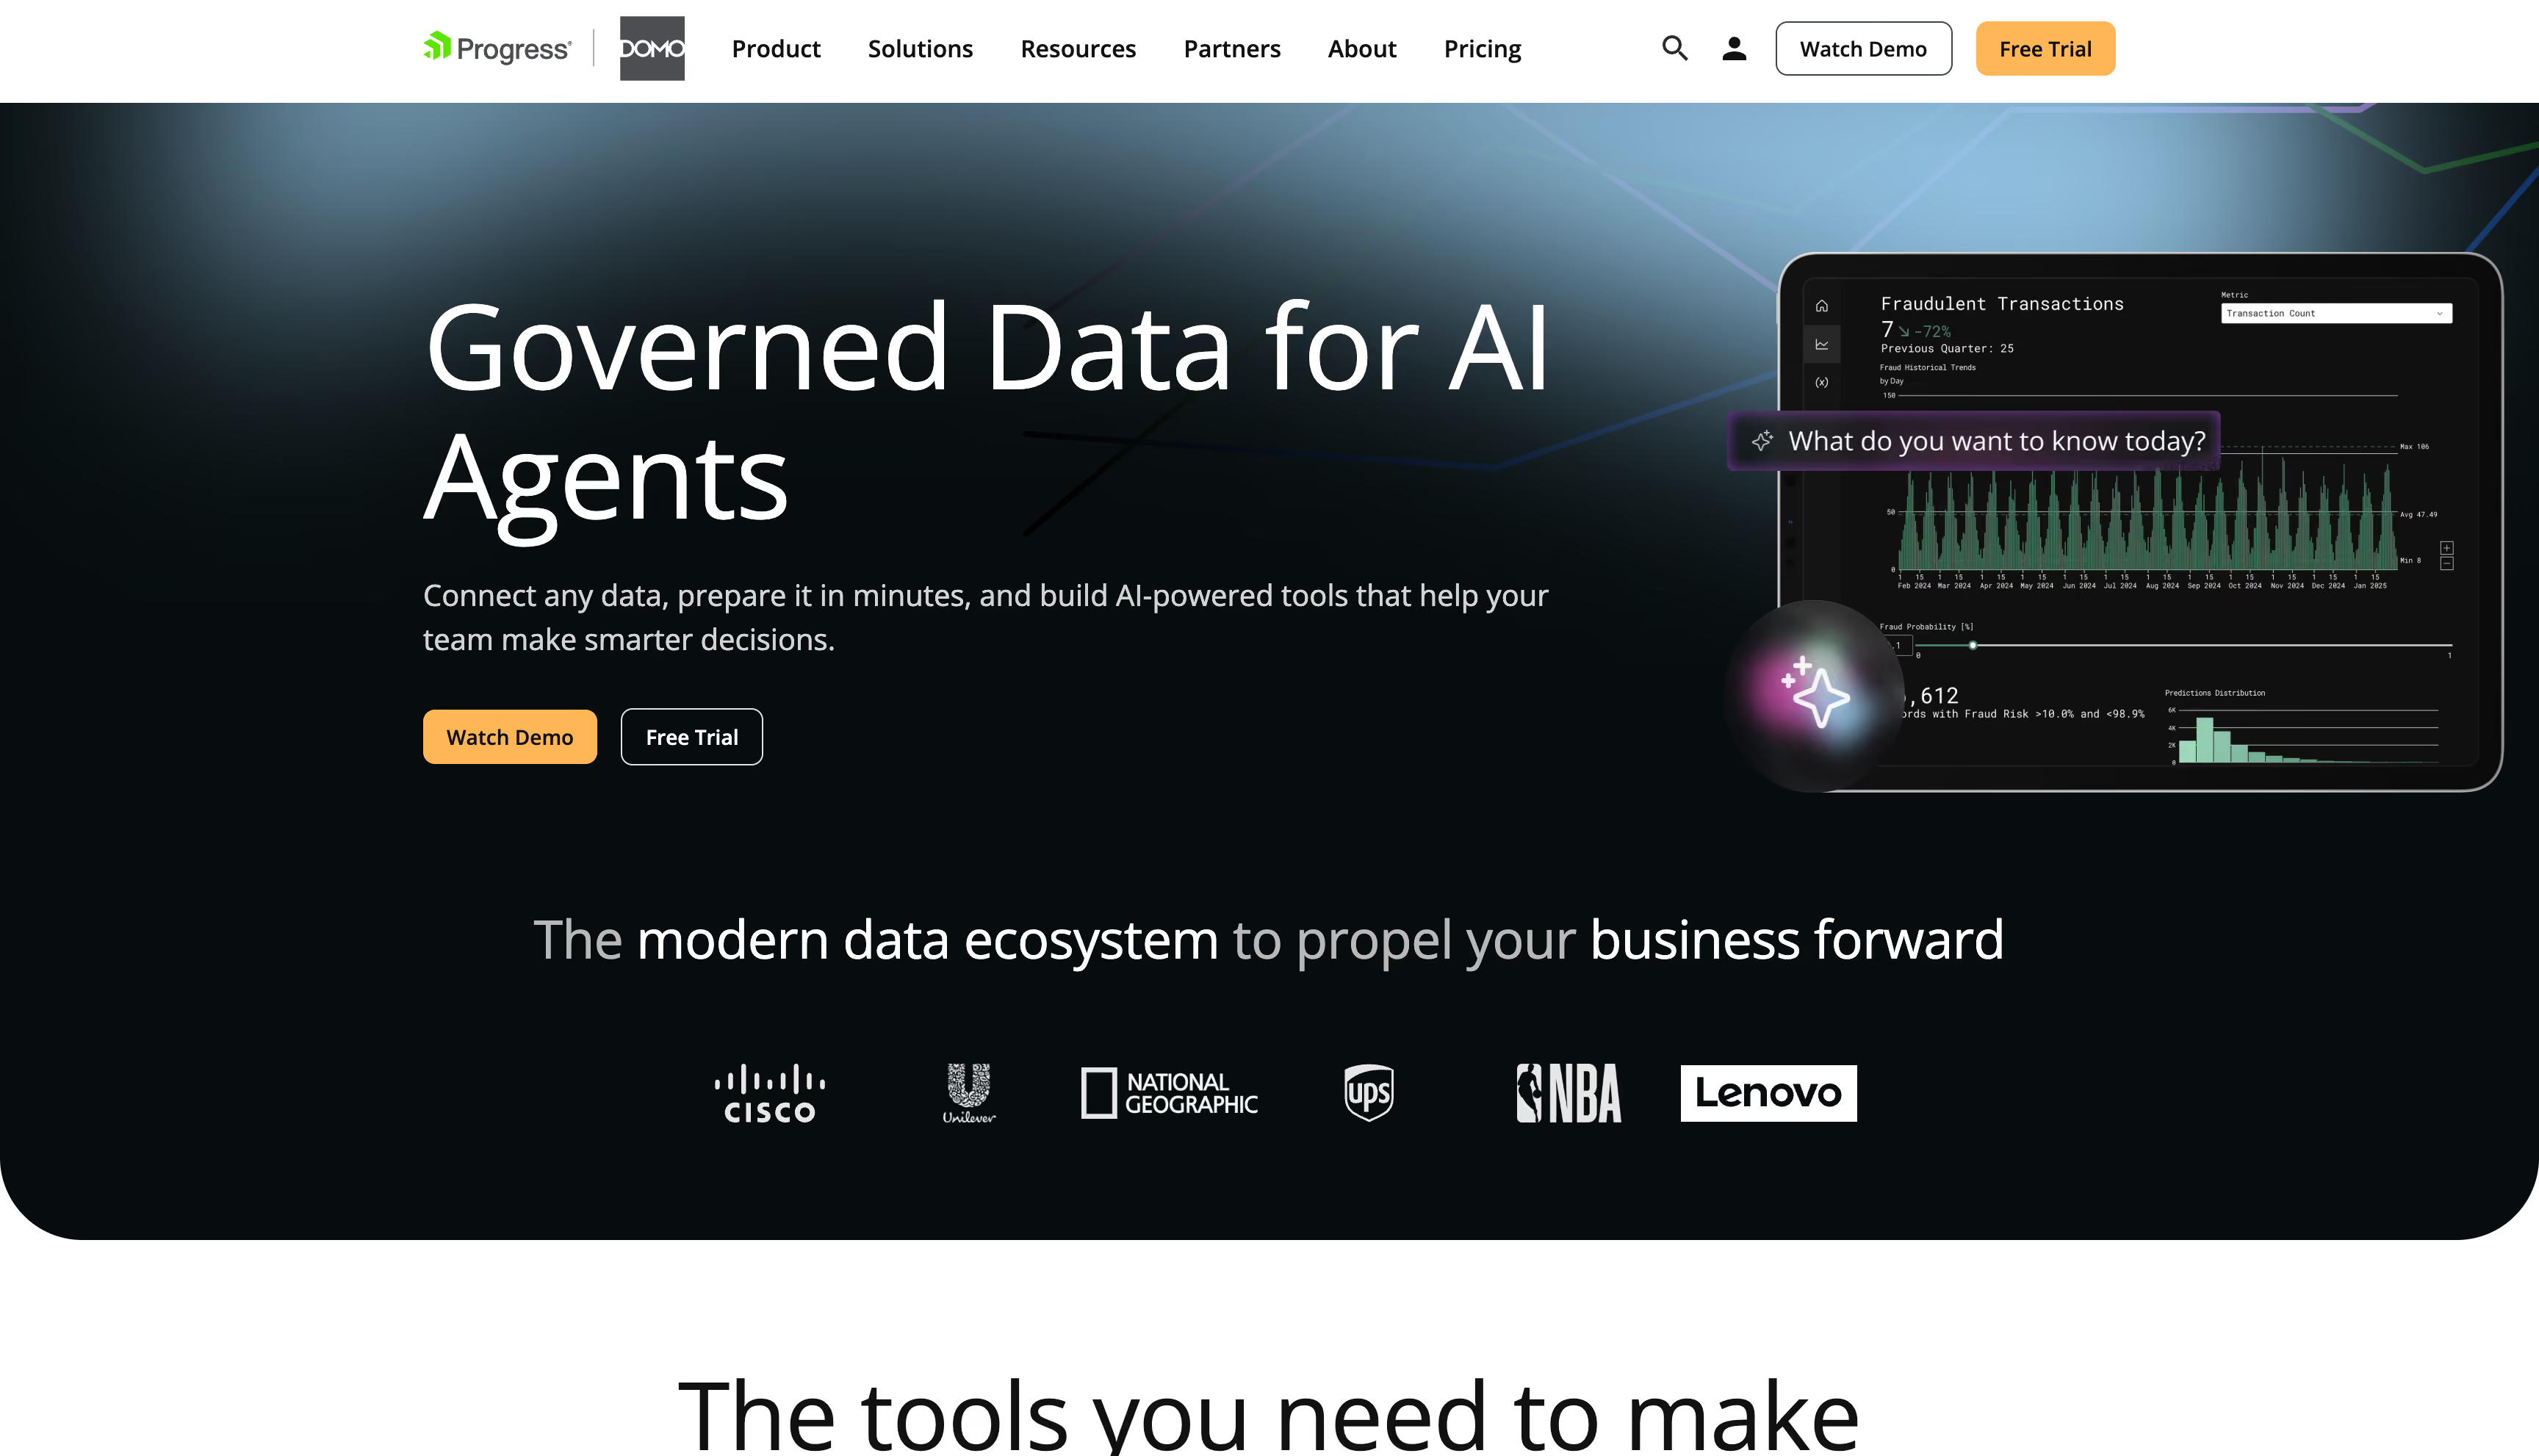
Domo's March 2026 releases centered on a new MCP Server letting outside AI agents, Gemini, Claude, reach into a live instance and take action, not just answer a question. Paired with an AI Agent Builder and a redesigned Magic ETL with AI-guided connectivity, the platform leans into agentic AI on top of what it's always been: a general-purpose data integration and dashboarding layer.
That generality cuts both ways. Domo can hold marketing spend next to revenue, headcount, and inventory in one dashboard. It has no opinion, on its own, about which campaign deserves credit for a sale.
Key features
Strengths
Limitations
Pricing
No published rates. Domo runs on a consumption-based credit model. Real-world contracts range from roughly $11,000 to $175,000+ a year, median around $50,000. Enterprise deployments routinely exceed $250,000.Reviews
Powerful once properly set up, genuinely useful for cross-functional insight, and frustrating to budget for. Renewal price jumps and unpredictable credit consumption are the most repeated complaints.Bottom line
Domo is a general BI and increasingly agentic AI platform, not a marketing analytics tool. It can house marketing data next to everything a business tracks, but the marketing-specific work, attribution, tracking, profit, has to be built by someone.Tableau
Best for: analysts and BI teams that want deep visualization flexibility on top of a data warehouse or CRM, with agentic AI layered on for conversational querying, not a marketing analytics tool out of the box.
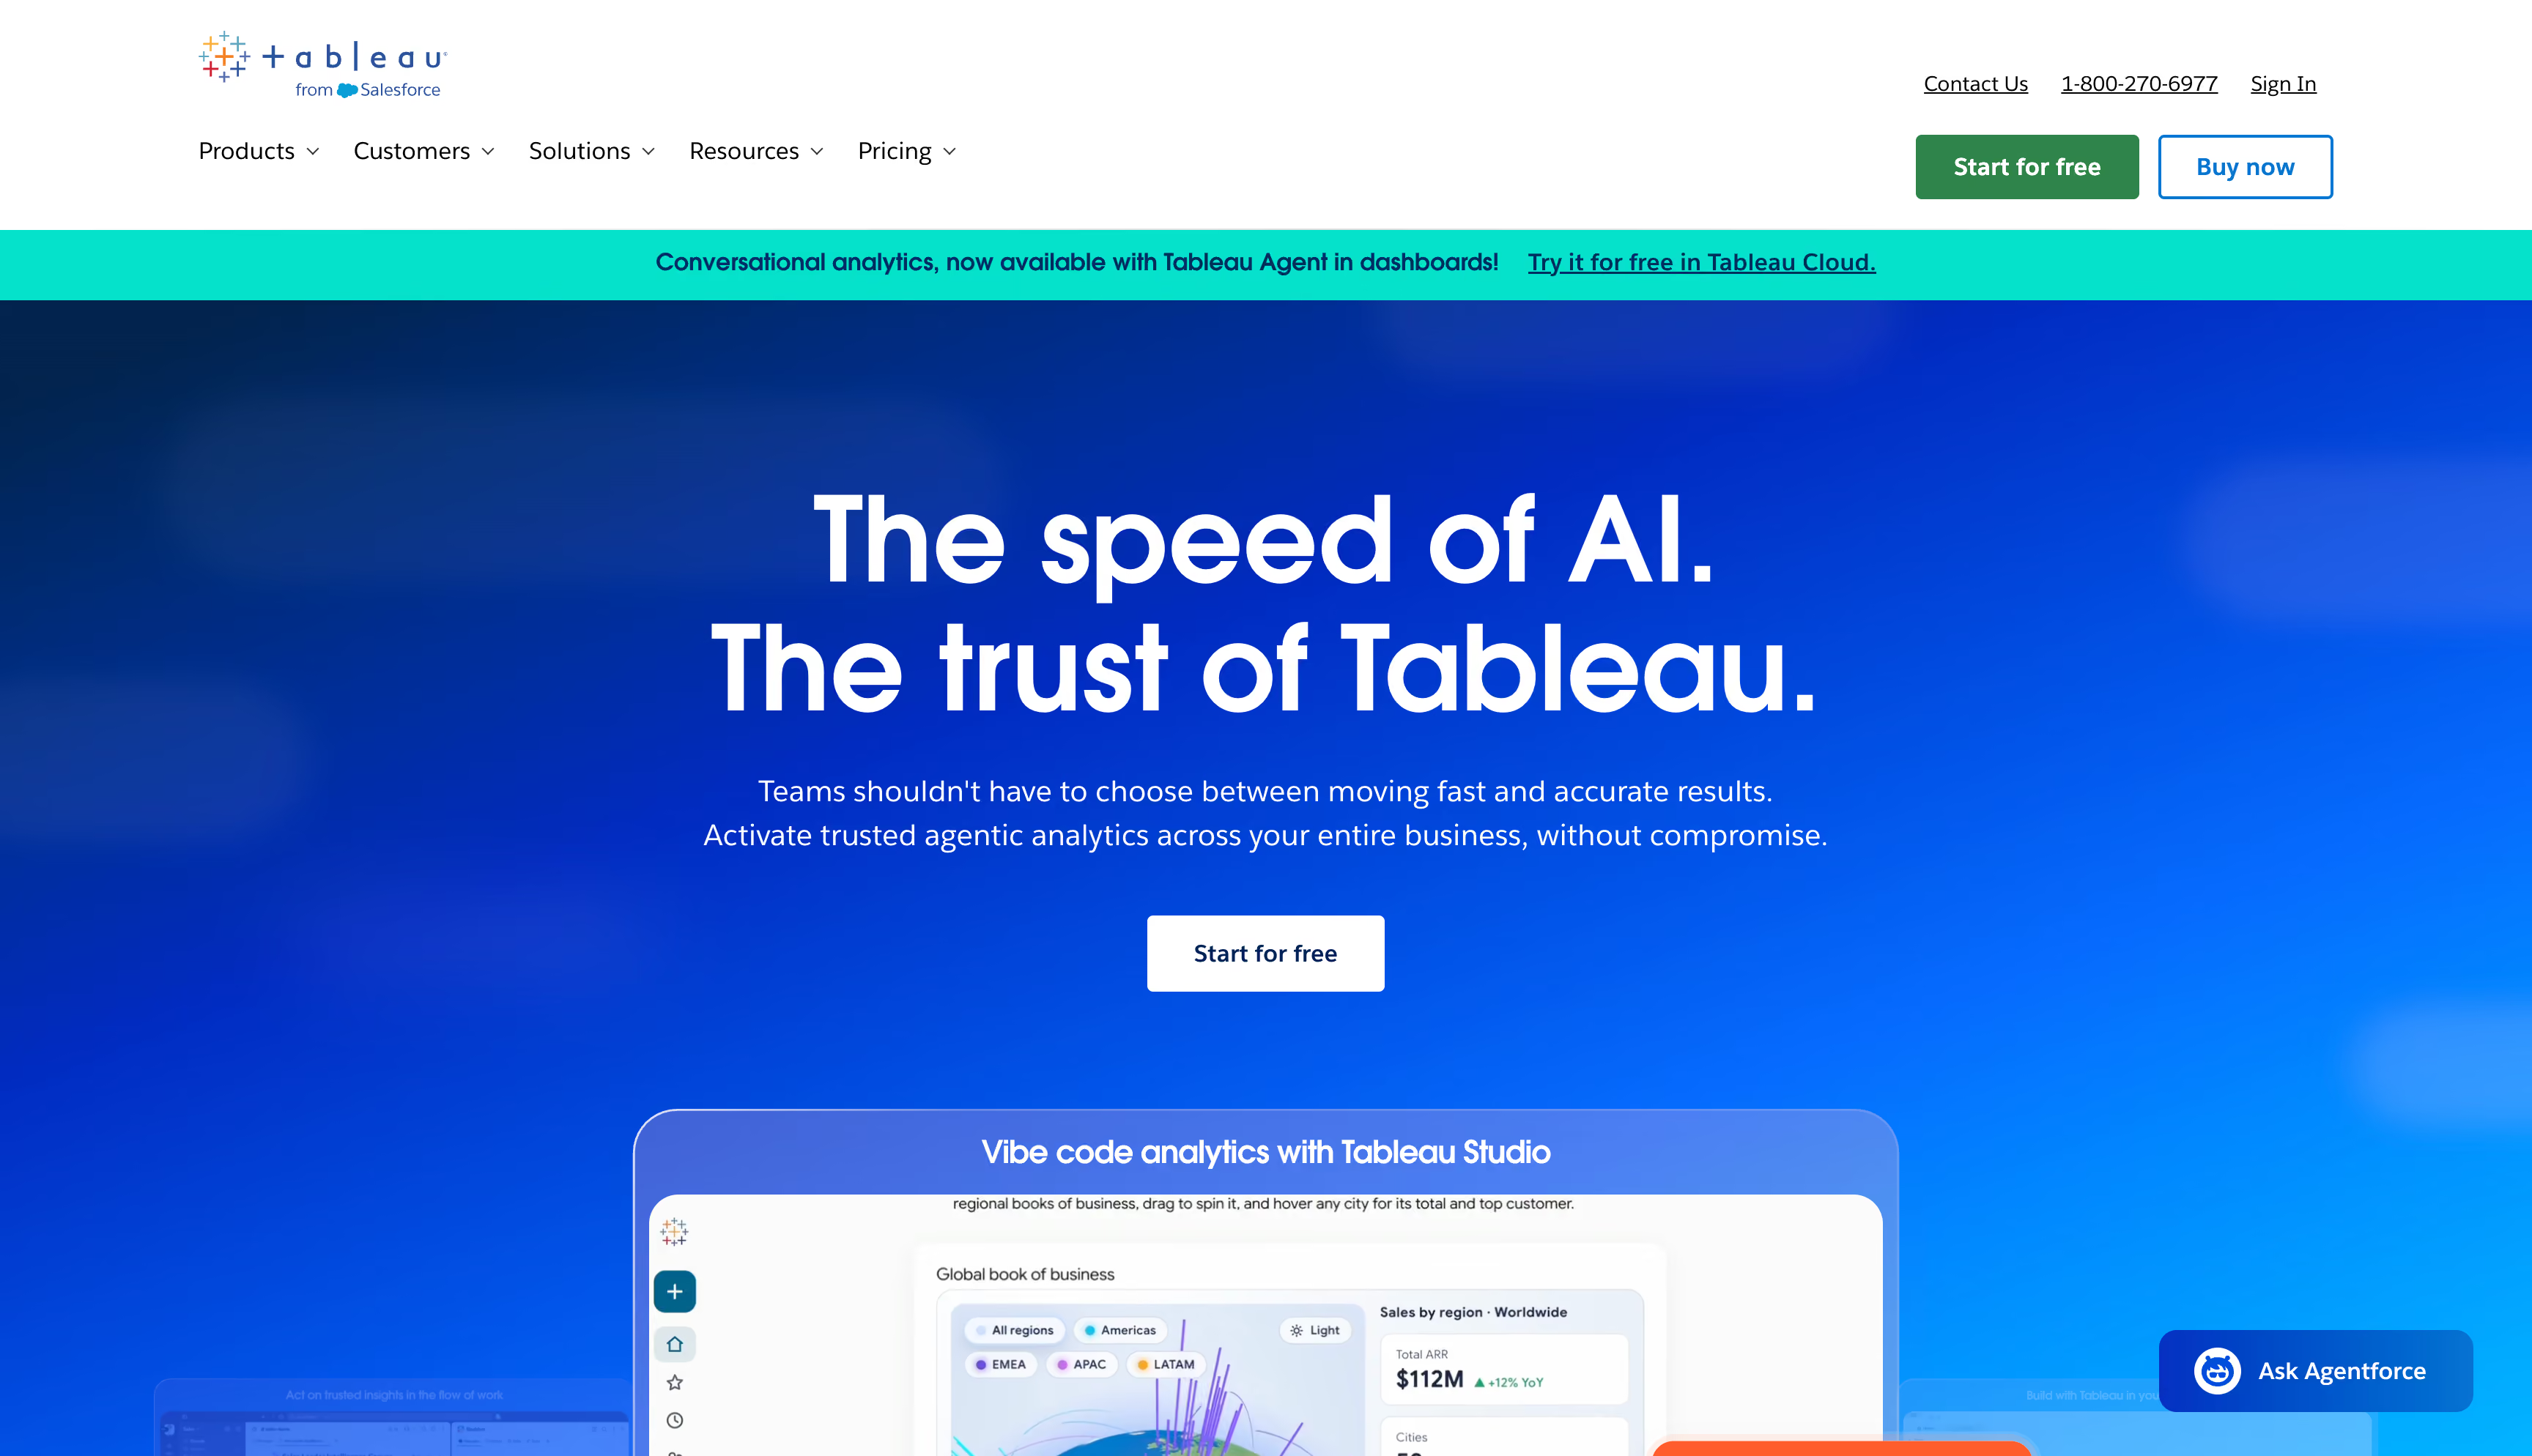
Now under Salesforce, Tableau's 2026 push centers on Tableau Next, an agentic analytics platform built on Data 360 that integrates natively with Agentforce. Concierge lets someone ask a question directly against governed data instead of building a view first, and new MCP support opens that data to outside models, Gemini, Claude, ChatGPT, rather than locking a team into Salesforce's own assistant.
None of that changes what Tableau fundamentally does. It's a visualization and exploration layer, still arguably the deepest on the market, sitting on top of data that has to already exist elsewhere.
Key features
Strengths
Limitations
Pricing
Creator runs $75/user/month, Explorer $42/user/month, Viewer $15/user/month, billed annually on the Standard tier. Enterprise pricing runs higher, and Tableau Next/Agentforce access is priced separately.Reviews
The praise is consistent: visualization depth and flexibility that few tools here match. The recurring complaint is licensing complexity, teams routinely pay for authoring seats on people who only ever view a dashboard.Bottom line
For a team with real analyst capacity and a clean data source, Tableau remains the deepest visualization layer on this list, with a genuine agentic push behind it now. It has nothing built in for marketing attribution or profit; that work has to already exist before Tableau can show it.Semrush
Best for: SEO and content teams that need a marketing analytics tool for keyword, competitive, and increasingly AI-search visibility, not ad spend attribution or profit tracking.
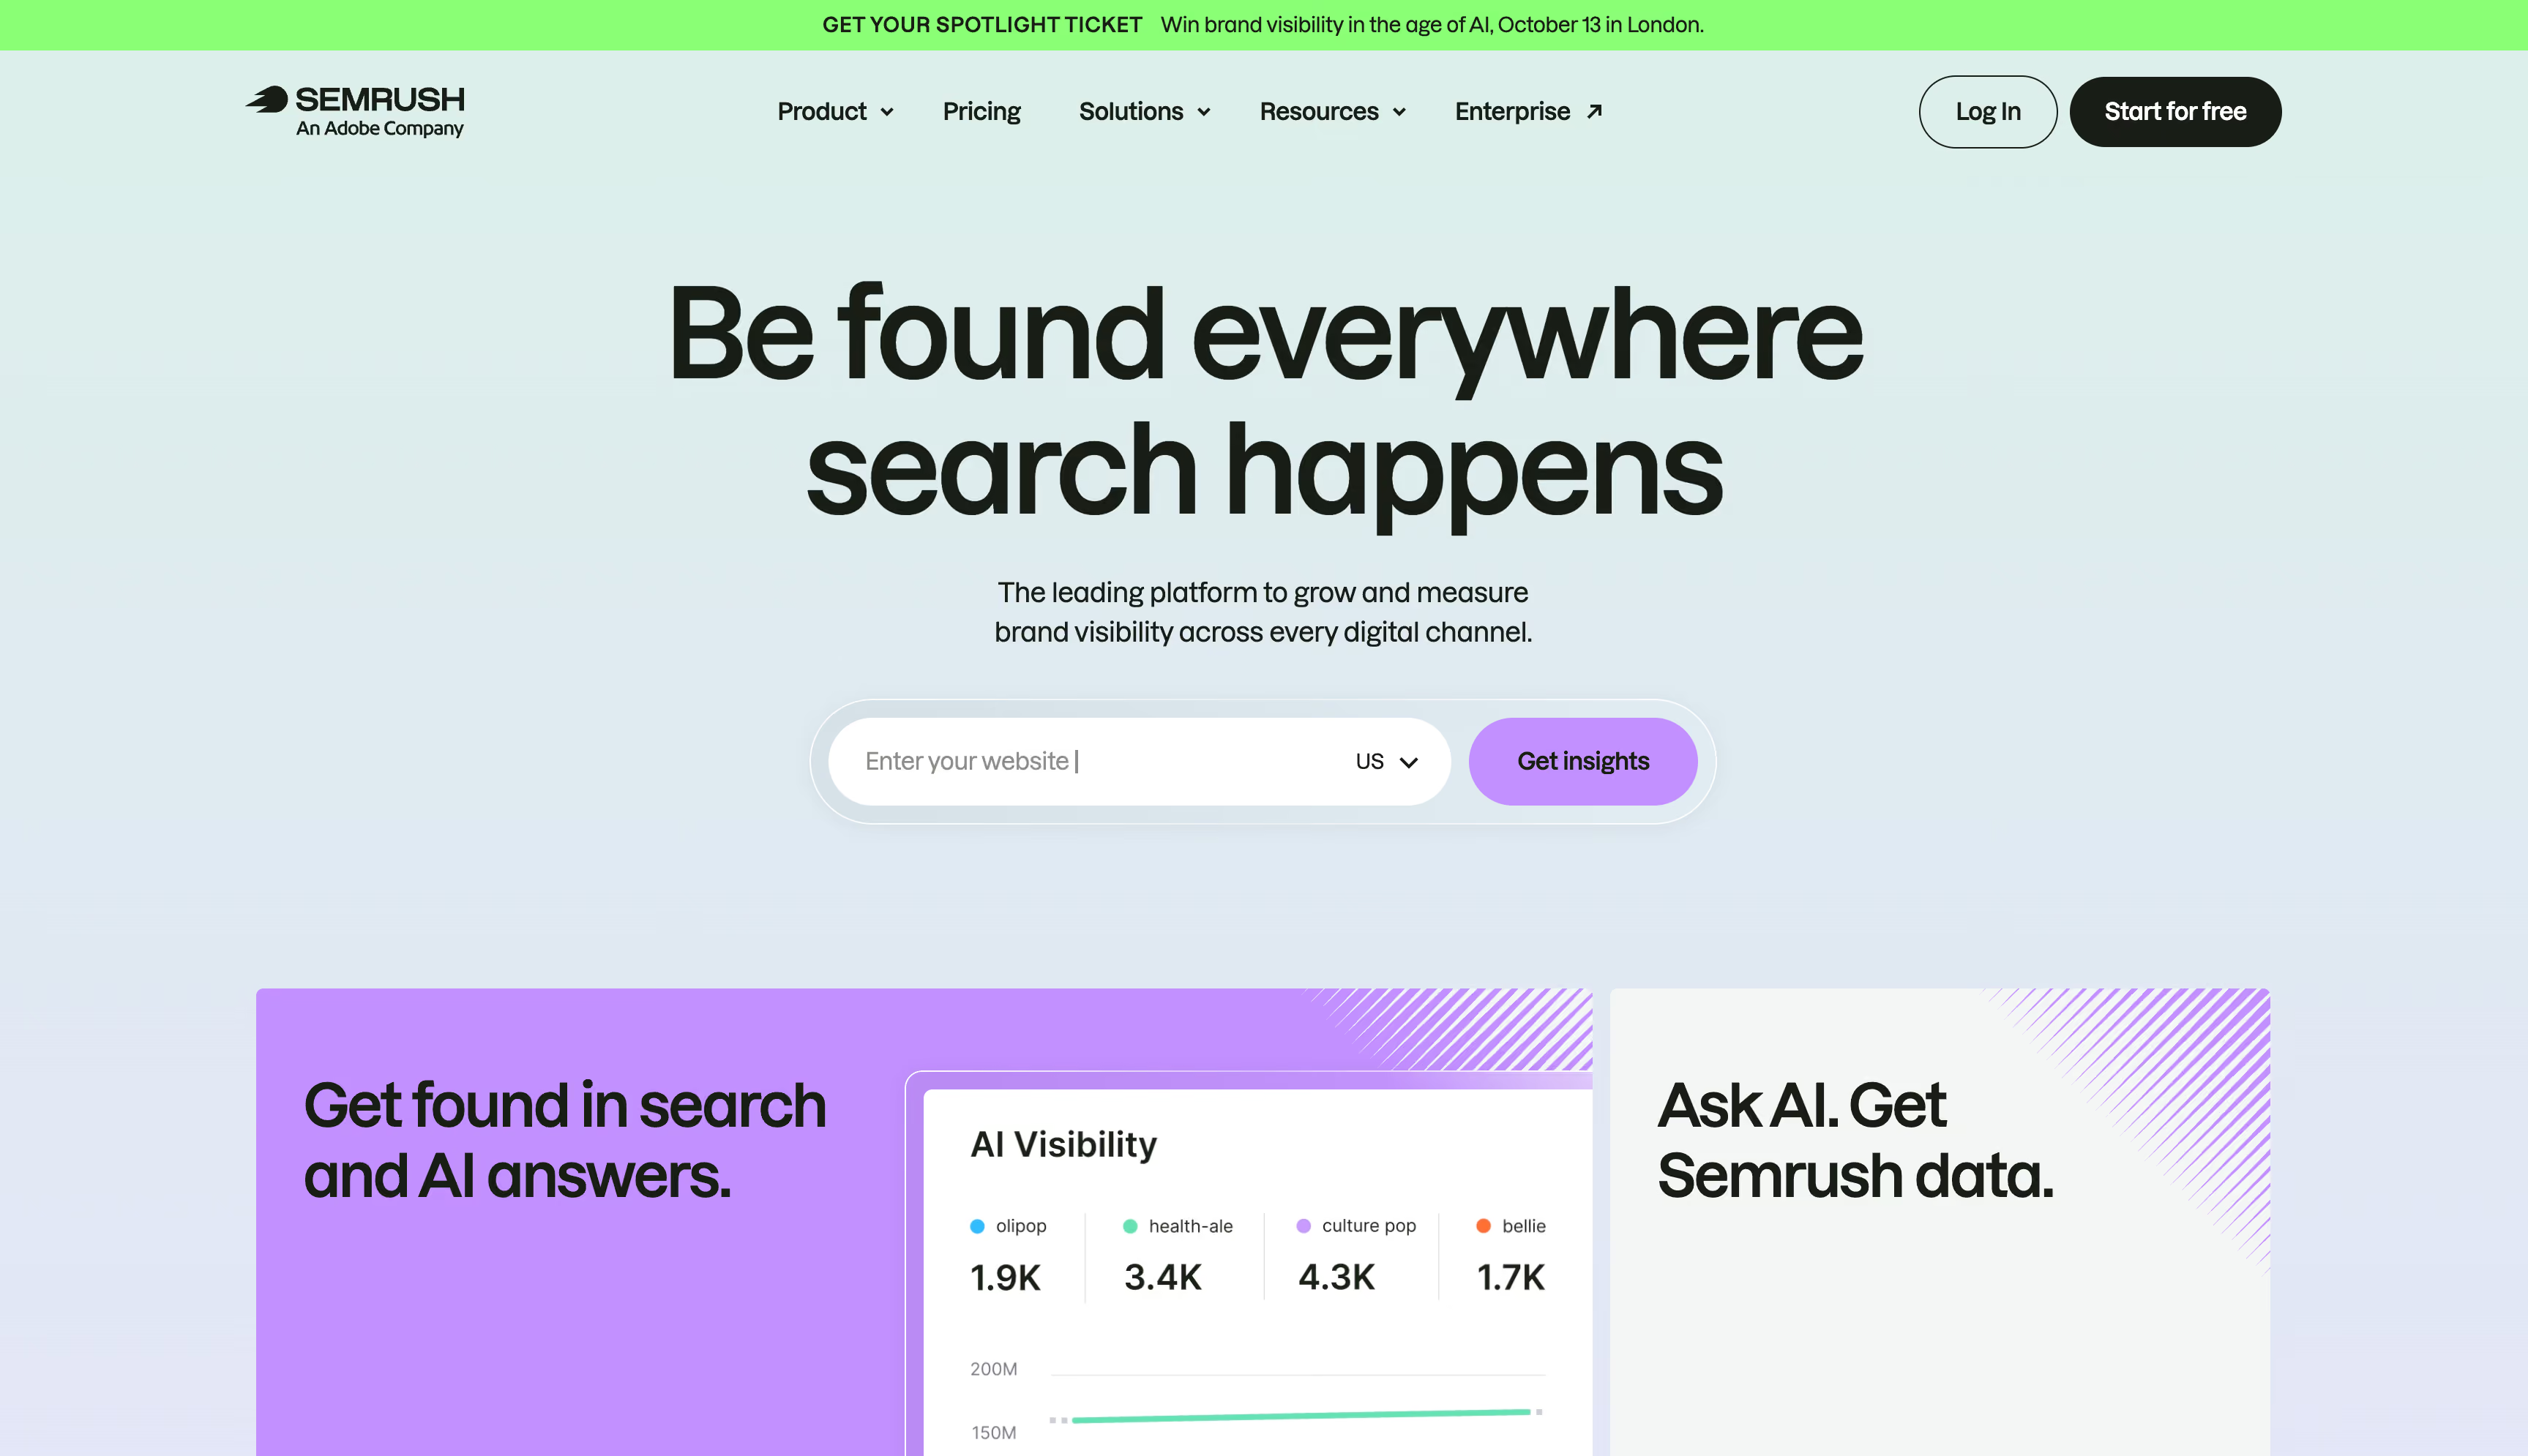
Semrush's biggest 2026 shift is putting AI-generated answers on equal footing with a Google results page. Its AI Optimization toolkit tracks brand mentions and citations across ChatGPT, Google AI Overviews, Perplexity, Gemini, and Copilot, with Query Fan-Out Analysis revealing the background queries an AI model runs before it answers. Paired with a Semrush MCP Server and an official ChatGPT app, it's pushed further than most SEO and content marketing analytics tools into making that data queryable conversationally.
None of it touches the other half of "marketing analytics." Semrush tells you how visible a brand is; what a visitor was worth once they converted is a separate problem entirely.
Key features
Strengths
Limitations
Pricing
Pro runs about $140/month, Guru about $250/month, Business about $500/month. The AI Visibility Toolkit adds roughly $99/month, or comes bundled into Semrush One starting around $199/month.Reviews
Reviewers consistently praise the sheer breadth of what one subscription covers, over 55 tools touching content, PPC, social, and AI visibility alongside the core SEO suite, and the accuracy of the keyword and backlink data. The recurring complaint is cost at scale and a real learning curve navigating that many tools.Bottom line
For understanding and growing visibility, organic and now AI-driven, Semrush is hard to match among marketing analytics tools. Whether that traffic turns into profit once it lands is a question for a different tool.Triple Whale
Best for: ecommerce operators running paid media on Shopify who want a marketing analytics tool with an AI layer that acts on campaigns, not just a shared dashboard to look at.
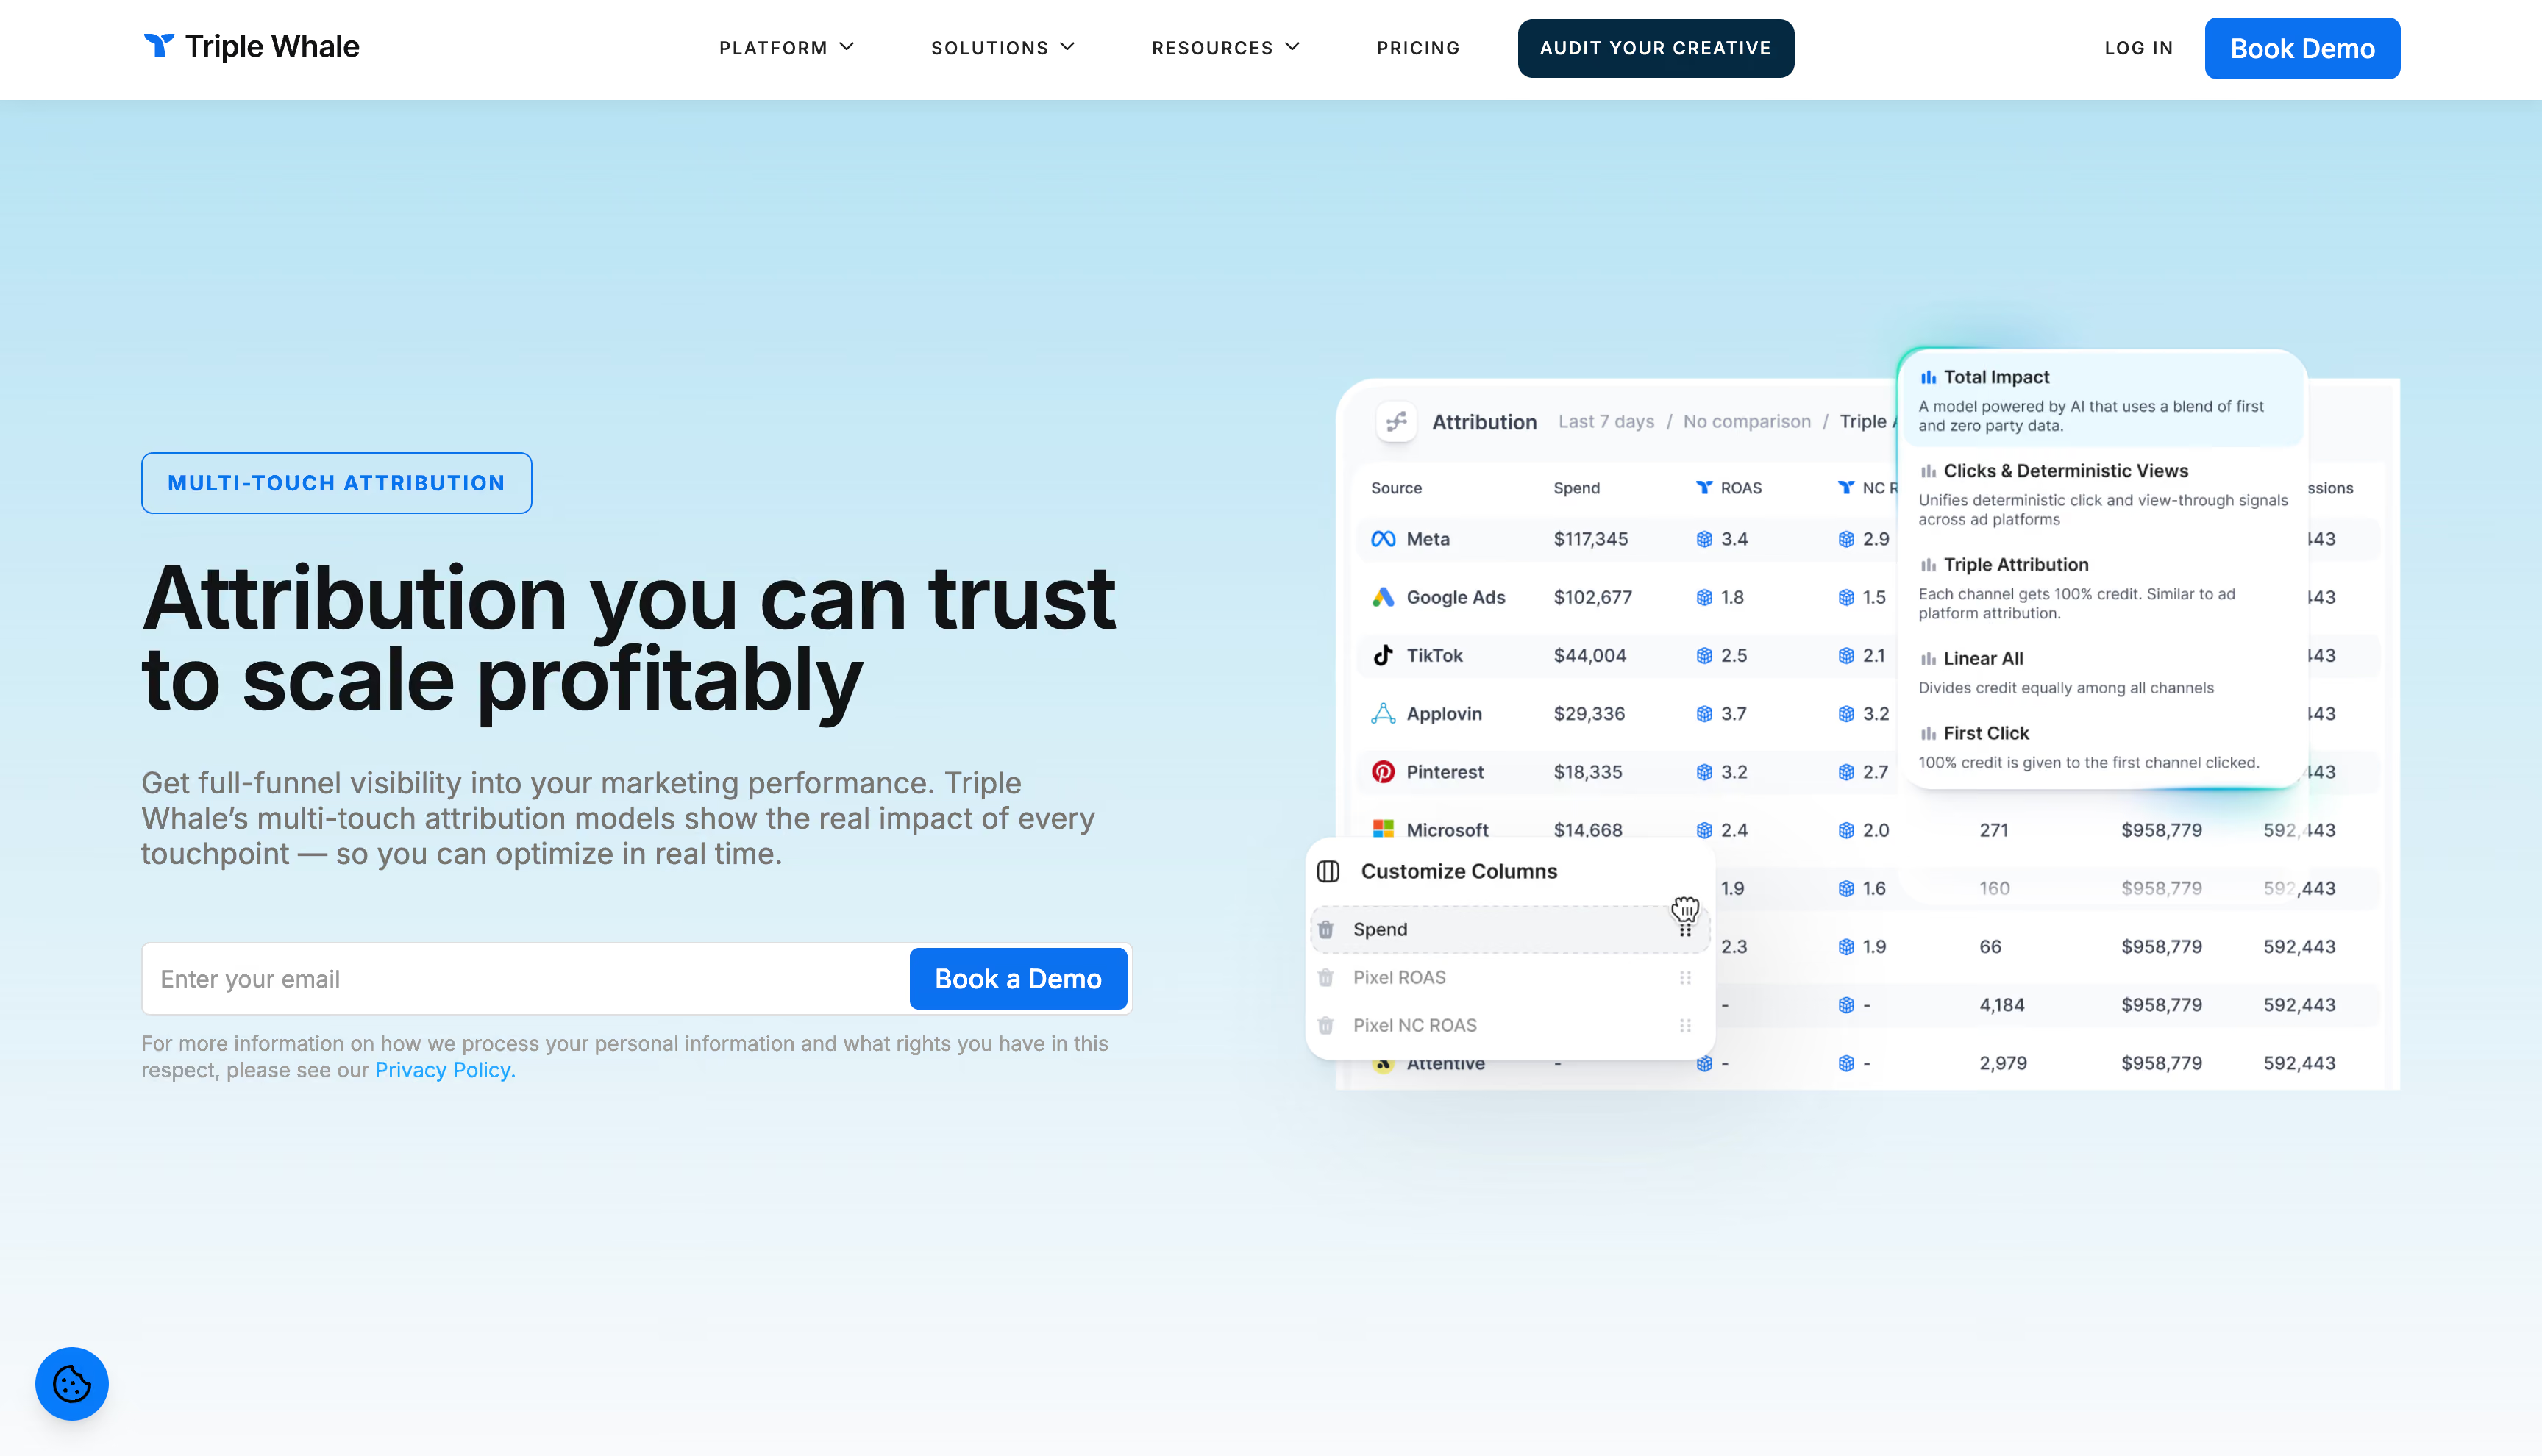
Moby, Triple Whale's AI layer, got a complete rebuild this year. Moby 2 runs on Claude, ChatGPT, and Gemini through direct partnerships with Anthropic, OpenAI, and Google, and it's designed to act rather than answer: generating ad creative and publishing it straight to Meta, and queuing budget or pause changes for approval before anything executes. That closes a real gap most tools on this list leave open, insight that stops at the dashboard.
The measurement underneath Moby is Compass, unifying multi-touch attribution through the first-party Triple Pixel, incrementality testing, and marketing mix modeling in one product.
Key features
Strengths
Limitations
Pricing
A free tier is available. Foundation starts at $219/month for the measurement stack and Moby as an AI teammate. Automate starts at $749/month, adding automated actions. Enterprise is custom-priced above $20M in annual GMV.Reviews
Two things recur: attribution that finally reconciles what Meta, Google, and Shopify each report differently, and Moby's shift from passive reporting toward something closer to a teammate. The caution that comes up just as often is fit: built for operators who already have scale.Bottom line
Of the nine competitors here, Triple Whale sits closest to Admetrics' approach among marketing analytics tools, pairing real attribution with an AI layer that acts instead of narrating. What separates them is depth: the profit view ends before contribution margin, and the layer that executes changes costs substantially more than the measurement underneath it.The best marketing analytics tools for 2026: final verdict
Every tool on this list solves a real problem. The question that actually matters is whether solving it gets you closer to a budget decision, or just a better-looking report.
Admetrics wins that comparison for ecommerce and DTC brands specifically. Among the best marketing analytics companies compared here, it's the only one that runs tracking, attribution, profit, and budget execution as one connected system, rather than five separate purchases stitched together after the fact.
The rest of the list earns its place for narrower jobs. GA4 stays the free baseline every stack already runs. Mixpanel and Amplitude own product behavior for teams building software, not selling physical goods. HubSpot and Salesforce Marketing Cloud Intelligence fit teams already living inside those CRMs. Domo and Tableau are general BI, useful once marketing data needs to sit next to finance and sales. Semrush owns visibility, organic and now AI-driven. Triple Whale comes closest to Admetrics' philosophy for a Shopify-native brand, without the same depth below gross margin.
Match the marketing analytics tool to the job in front of you. For a DTC brand trying to find next quarter's budget, start with the one that already knows what profit looks like.