
Key Takeaways
Every ecommerce team hits the same three problems
Most DTC and ecommerce companies already run funnel analysis of some kind. Far fewer trust it enough to change a checkout or move a budget on the strength of it, and the reasons repeat across brands consistently enough to name.
The first is the data underneath. Safari expires script-set cookies inside a week, iOS puts an opt-out prompt in front of the user, ad blockers never load the script at all, and consent gates hold it back until somebody clicks. A funnel built on what survives that reports 100% of the people it managed to see, which is not the same as 100% of the people who shopped. Nothing in the interface says so.
The second is counting people instead of pricing them. A checkout step that loses 34% and a payment step that loses 34% look identical in every tool on this list, and they are almost never worth the same to fix. The orders that do survive carry product cost, shipping, payment fees, whatever discount got applied, and a return rate that runs a quarter on some SKUs. A tool that stops at the conversion event cannot tell you which of those drop-offs was the expensive one.
The third is the gap between the finding and the fix. Almost every funnel tool produces a percentage and stops. Somebody reads it, opens a ticket or an Ads Manager tab, and the loop between measuring and acting runs through a person moving numbers between two windows every Monday.
Seeing where people fall out of a checkout was a real problem, and the category solved it years ago. Any brand can build a multi-step funnel for free by Friday. The harder problem is making the drop-off mean something: measured on data that survived the browser, priced in what the order would have earned, and close enough to a decision that someone can act without opening another tab.
This guide compares the 10 best funnel analysis tools for 2026: where each gets its data, how far it carries the math, who it is built for, and which of them do anything with what they find.
Why the numbers never match your order table
The simplest test is also the one most teams skip. Pull total orders for a single week from the shop, pull the same week from the funnel report, and compare. A gap under 5% is normal. Gaps of 20% and more are common, and the tool will not flag them, because it has no way of knowing what it failed to record.
Cookie expiry and consent opt-outs explain part of it. Identity fragmentation explains most of the rest. Someone taps an ad on a phone at lunch, browses on a laptop that evening, and buys the next morning. Client-side sales funnel tracking sees three separate people: one who abandoned at product view, one who abandoned at cart, and one who arrived at checkout from nowhere. The report now contains two drop-offs that never happened and a conversion with no journey attached to it.
Retention settings finish the job. GA4 keeps event-level data for two months by default and 14 at most, the change is not retroactive, and funnels run on exactly that data. A question asked in March about January often has nothing left to answer it.
Server-side capture is the correction. Recording off the browser means the event fires whether or not the page cooperates, and tying it to a real order means the number reconciles against the shop rather than a cookie. One tool here does that. The other nine do precise arithmetic on a sample that is both shrinking and skewed toward the customers a DTC brand can least afford to lose.
What a drop-off is actually worth
Funnels count people, and people are not worth the same amount. Recovering a hundred abandoned carts on a SKU carrying 62% margin is worth doing. Recovering a hundred on a discounted item with a 30% return rate produces warehouse work and little else. Both appear in the report as a hundred recovered carts.
This is the point where ecommerce funnel analysis diverges from product analytics, and it explains why borrowing a SaaS tool for a store goes wrong. Product analytics was built for funnels where the conversion is the outcome. In a store the conversion is a transaction with a cost structure behind it and a return window ahead of it, and neither is visible to a tool that stopped measuring when the order was placed.
Shopify does not close the gap either. The admin gives you sessions, added to cart, reached checkout and converted, which is free and genuinely useful, but it reports revenue rather than contribution and cannot see what the traffic cost to acquire in the first place.
The fix is to price each step rather than count it. Multiply the people lost at a step by what they would have been worth after product cost, shipping, fees and returns, and the ranking of the problems changes. The step with the worst percentage is frequently not the step with the most margin sitting behind it.
From finding the leak to fixing it
Finding the drop-off is the easy half. Most teams stall between a chart that says 34% and a change that moves it.
Rank leaks by margin at stake rather than percentage, because the biggest drop is rarely the most expensive one. Then separate the two causes. A broken step throws console errors and fails on one browser. An unconvincing step works perfectly and still loses people, which is a pricing, shipping or trust problem no recording will diagnose.
Form a hypothesis narrow enough to be wrong, then ship one change and validate it against the same funnel definition you started with. This is where marketing funnel optimization quietly falls apart: teams redefine the funnel while testing the fix, the numbers move, and nobody can say whether the change or the definition did it.
The uncomfortable part is that the fix is often upstream of the leak. A checkout losing people at shipping sometimes has a traffic problem, and the campaign feeding it is buying discount-seekers. You only see that if your funnel extends back past the click.
How we tested and scored each tool
We scored every tool against the four things the sections above argue actually decide the outcome, weighted in this order.
Scores draw on hands-on use, vendor documentation and pricing pages, and verified reviews from G2 and Capterra. Where a vendor claim and its own review base disagreed, we went with the review base.
Two exclusions worth naming. Sales funnel builders and sales funnel management tools such as ClickFunnels, Kartra and Systeme.io create funnels rather than measure them. And Contentsquare owns both Heap and Hotjar, so three entries share an owner; we scored them separately because they still sell separately, but a shortlist containing all three is narrower than it appears.
Quick comparison: best funnel analysis tools (2026)
Admetrics
★4.8Best for: ecommerce and DTC brands whose funnel starts at the ad impression and has to end in contribution margin.
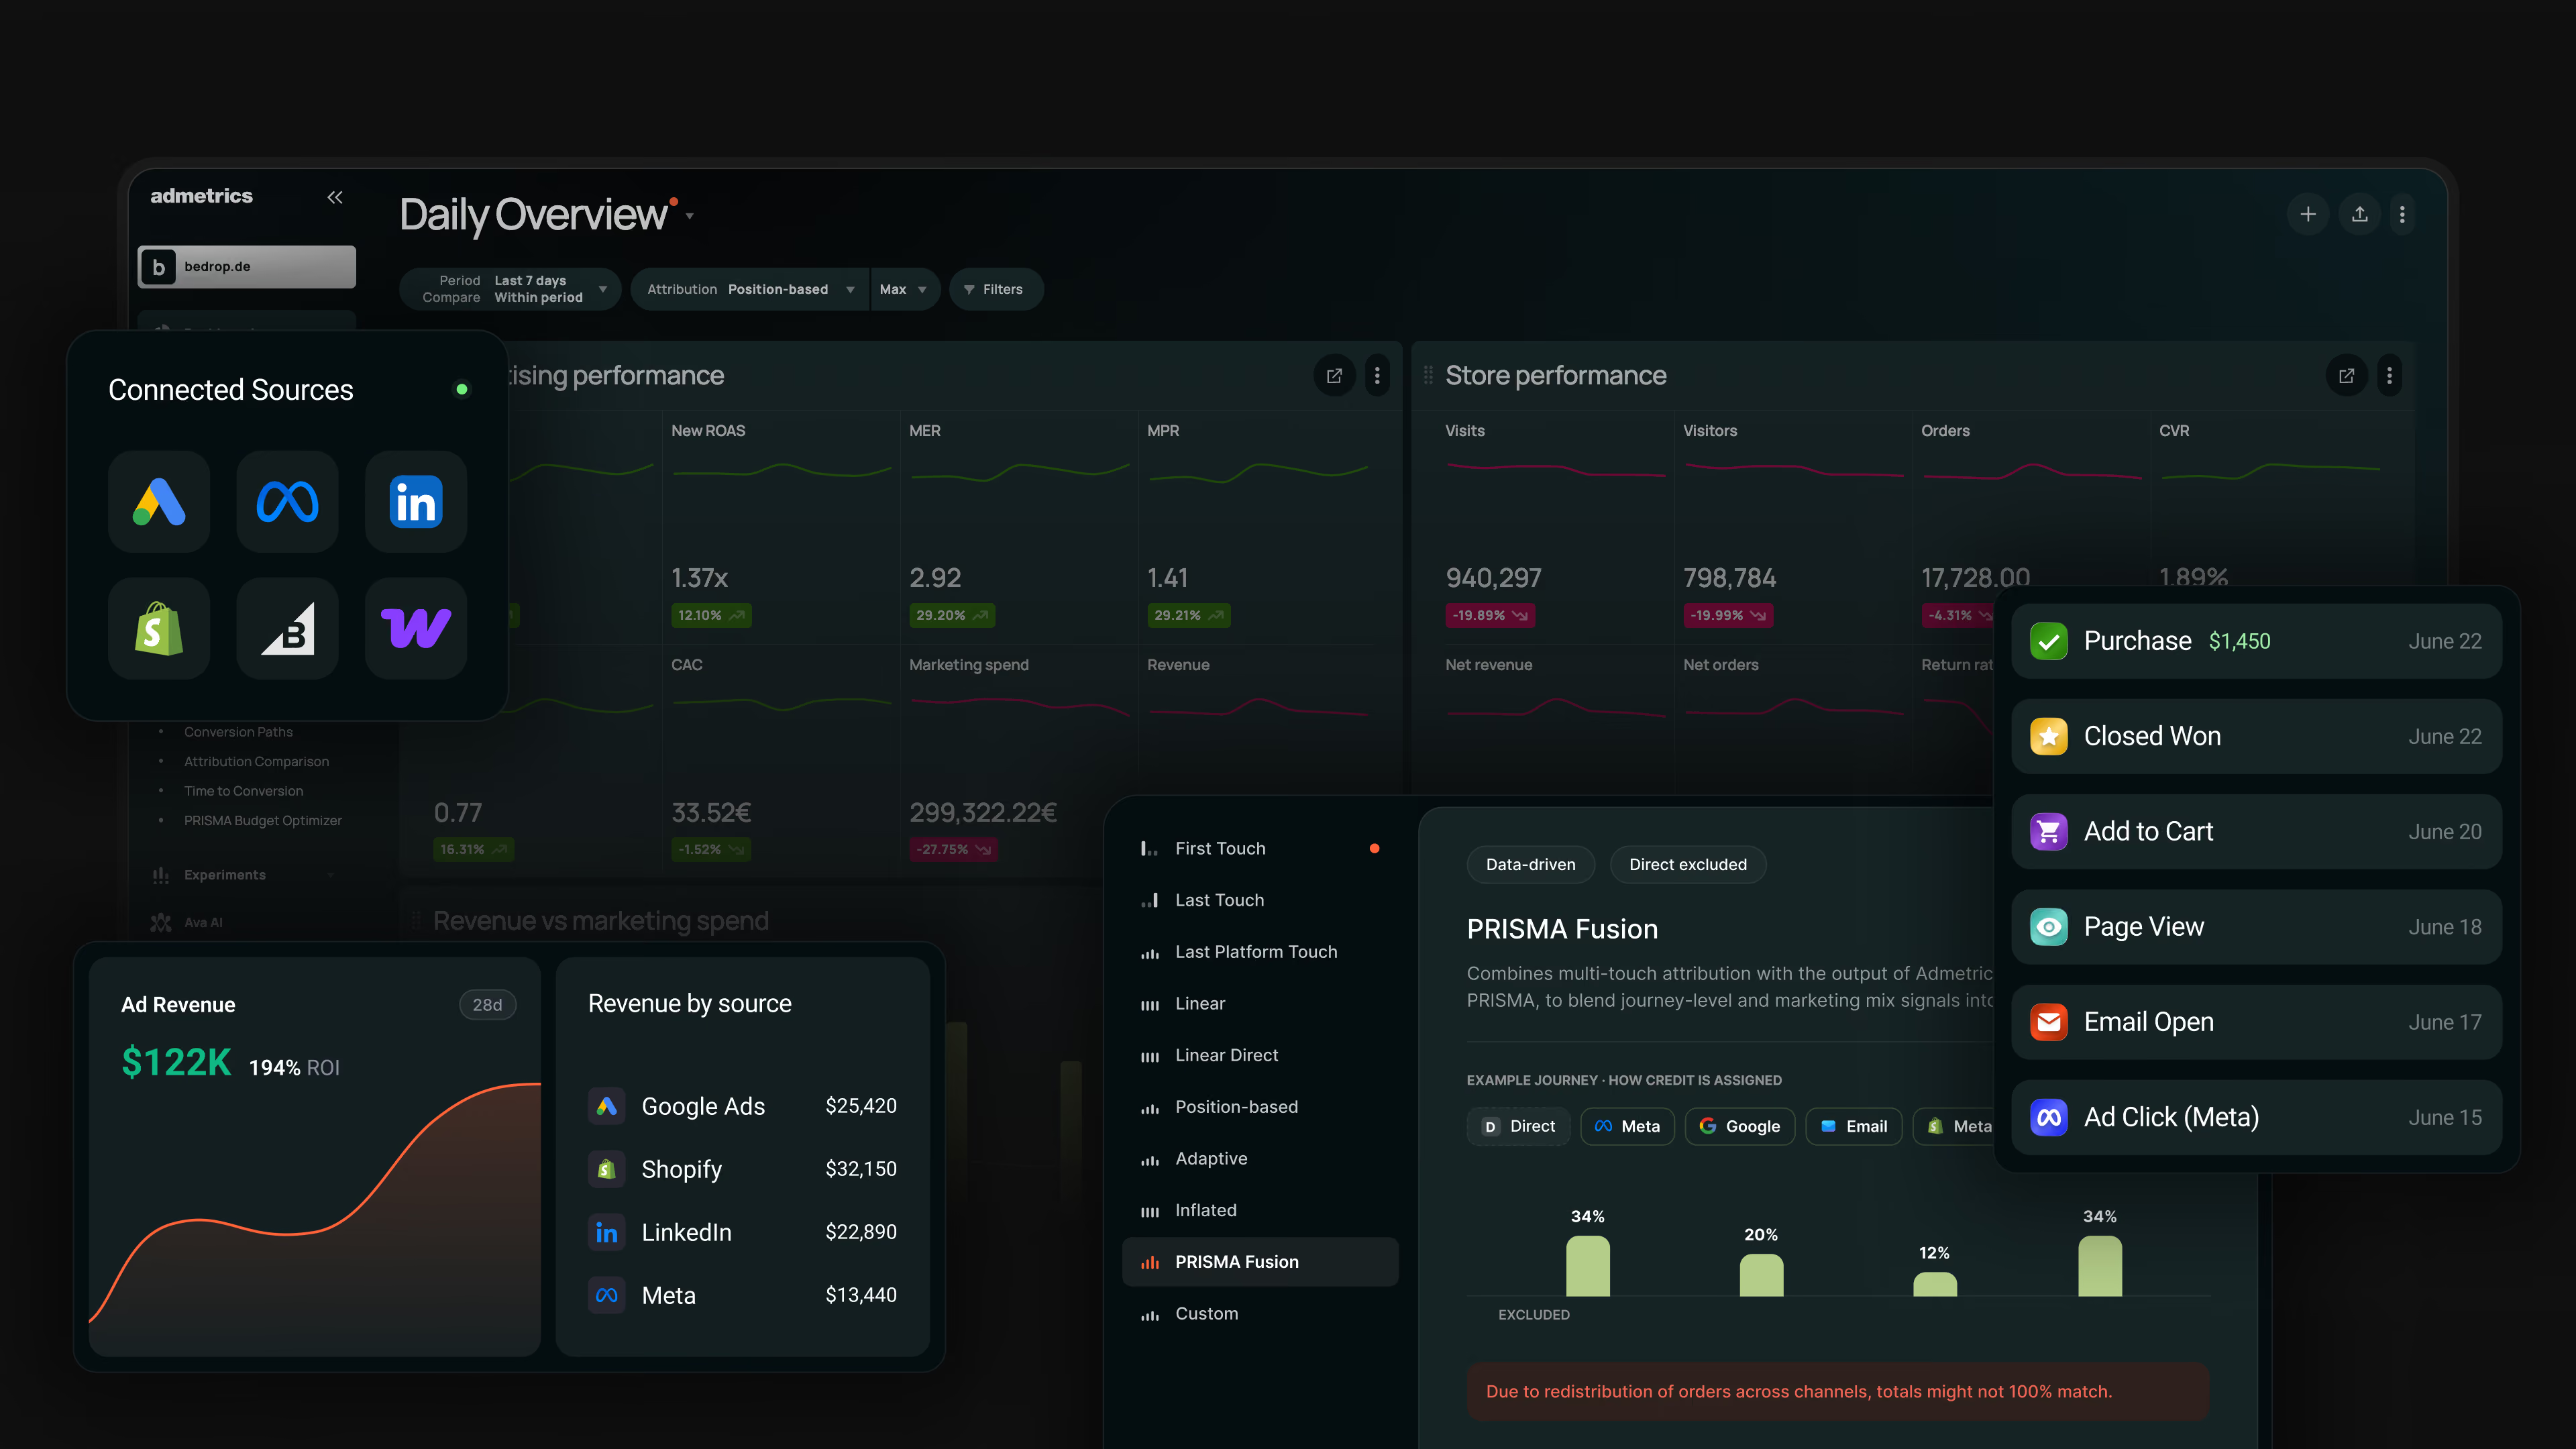
Your checkout funnel reads 71% cart to purchase. What it does not say is that the campaign filling that cart pushes the SKU with a 26% return rate, so a quarter of those purchases walk back through the warehouse nine days later. Every other tool here would call that a success, because every other tool stops at the conversion event. Admetrics treats the order as the middle of the funnel: one chain from ad click through cart and checkout into the order, then onward into margin, returns and the second purchase, matched to real orders rather than modeled.
Key features
Strengths
Limitations
Pricing
Priced against monthly ad spend, not seats. Growth is EUR 339/month covering EUR 20,000 of spend at 1.5% overage, Business EUR 764/month for EUR 70,000 at 1%, Custom from EUR 1,100/month. All tiers include unlimited users, shops and integrations, with a 21-day trial.Reviews
The public review base is thin: three verified G2 reviews averaging 4.8, two incentivized and several years old, which is not enough to call a pattern. The attributed customer evidence carries more weight. Freiluftkind measured 30% more tracked purchases in a parallel run, and Ehrenkind credited a 60% ROAS lift. Ask for a parallel run against your own orders.Bottom line
If your funnel is a store funnel, this is the only tool here that measures all of it. Everything else ends at the conversion event, so it can tell you 29% abandoned the cart but never that the 71% who did not were worth less than the spend that brought them.Mixpanel
★4.5Best for: product and growth teams who need to know which step of a signup, onboarding or checkout flow users stall on.
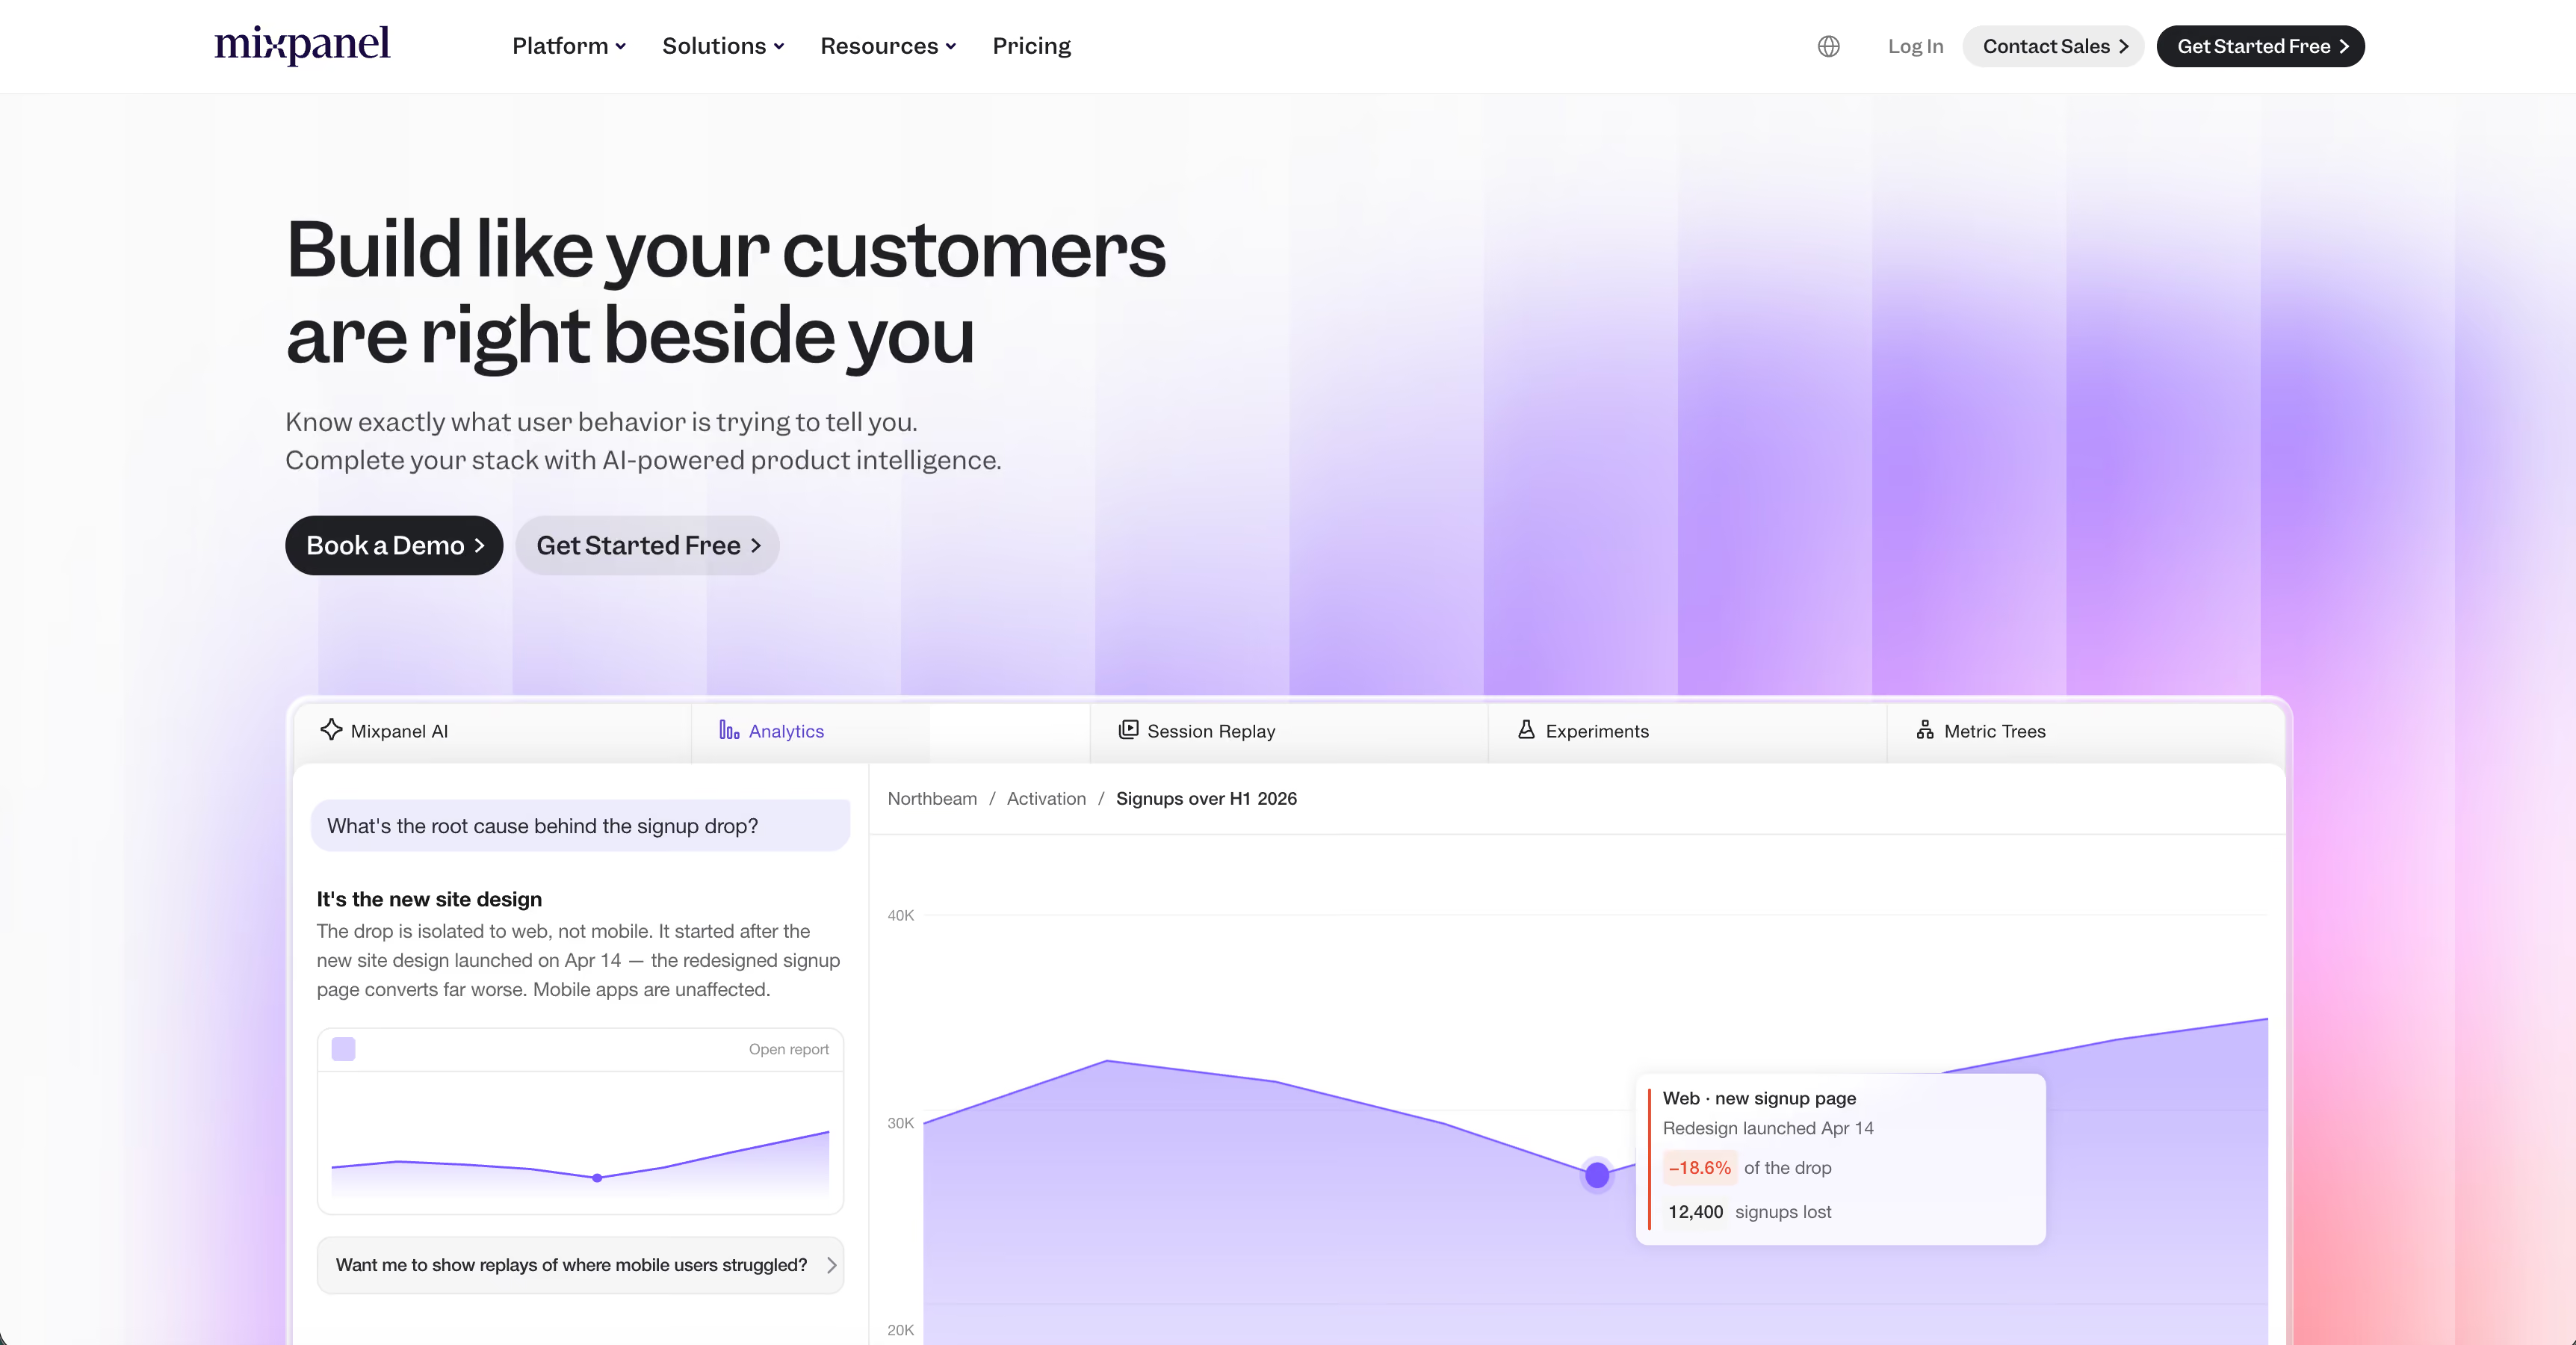
Ask a Mixpanel user what they do all day and a striking number describe living in two tabs: Funnels and Retention. That is the product, and it is what funnel analysis gets measured against. The reason is not breadth. It is that the builder answers the follow-up question fast enough to ask it during a meeting. The trade comes with the event model: Mixpanel captures nothing on its own, so the funnel is exactly as honest as the tracking plan your engineers shipped.
Key features
Strengths
Limitations
Pricing
Free covers 1M events monthly with five saved reports per user; hit the cap and reports lock until you upgrade. Growth includes the first million free, then from $0.00028 per event. Enterprise starts at $20,000 a year. Group Analytics adds 40% on overage and cannot be applied retroactively.Reviews
4.5 out of 5 across roughly 1,370 G2 reviews. Praise concentrates on ease of use and non-technical teams self-serving. Criticism concentrates on the learning curve, with three themes accounting for around 90 reviews. Almost nobody disputes the math. They dispute how much work a trustworthy funnel takes.Bottom line
If your funnel lives inside a product and your question is where users stall, this is the strongest answer here. Budget for instrumentation rather than the subscription. If your funnel starts with ad spend and ends in margin, it measures the middle of your problem and none of the edges.Amplitude
★4.5Best for: larger product teams who need to know which behaviors actually predict whether someone converts.
Mixpanel and Amplitude get treated as interchangeable. On funnels they are not. Conversion Drivers takes a two-step funnel, sweeps every event users fired between those steps, and ranks which actions correlate most with converting, so you stop guessing which behavior matters. That tells you who it is for. Amplitude skews up-market, with mid-market and enterprise making up roughly two-thirds of its review base, and the depth assumes someone owns analytics as a job rather than a side task.
Key features
Strengths
Limitations
Pricing
Free covers 2 million events a month, capped at 10 saved charts and one year of data. Plus starts at $0, keeps the first 2 million free and scales to 700K MTUs, adding custom events, alerts and 20 cohorts. Growth and Enterprise are quote-only.Reviews
4.5 out of 5 across roughly 2,990 G2 reviews, the largest sample here. Insights and ease of use lead the praise, and learning curve, twice, is the entire top of the dislike list. Funnels score 8.8. Worth noting for ecommerce readers, Amplitude has too few reviews in the G2 e-commerce category to score at all, while Mixpanel has 120.Bottom line
Buy Amplitude when your questions have outgrown descriptive answers and someone owns instrumentation properly. It is the sharpest diagnostic funnel here, and also, on the evidence of its own review base, not a tool ecommerce teams reach for.Heap
★4.4Best for: teams whose funnel questions keep arriving after the fact, and who do not want the answer to depend on what someone instrumented six months ago.
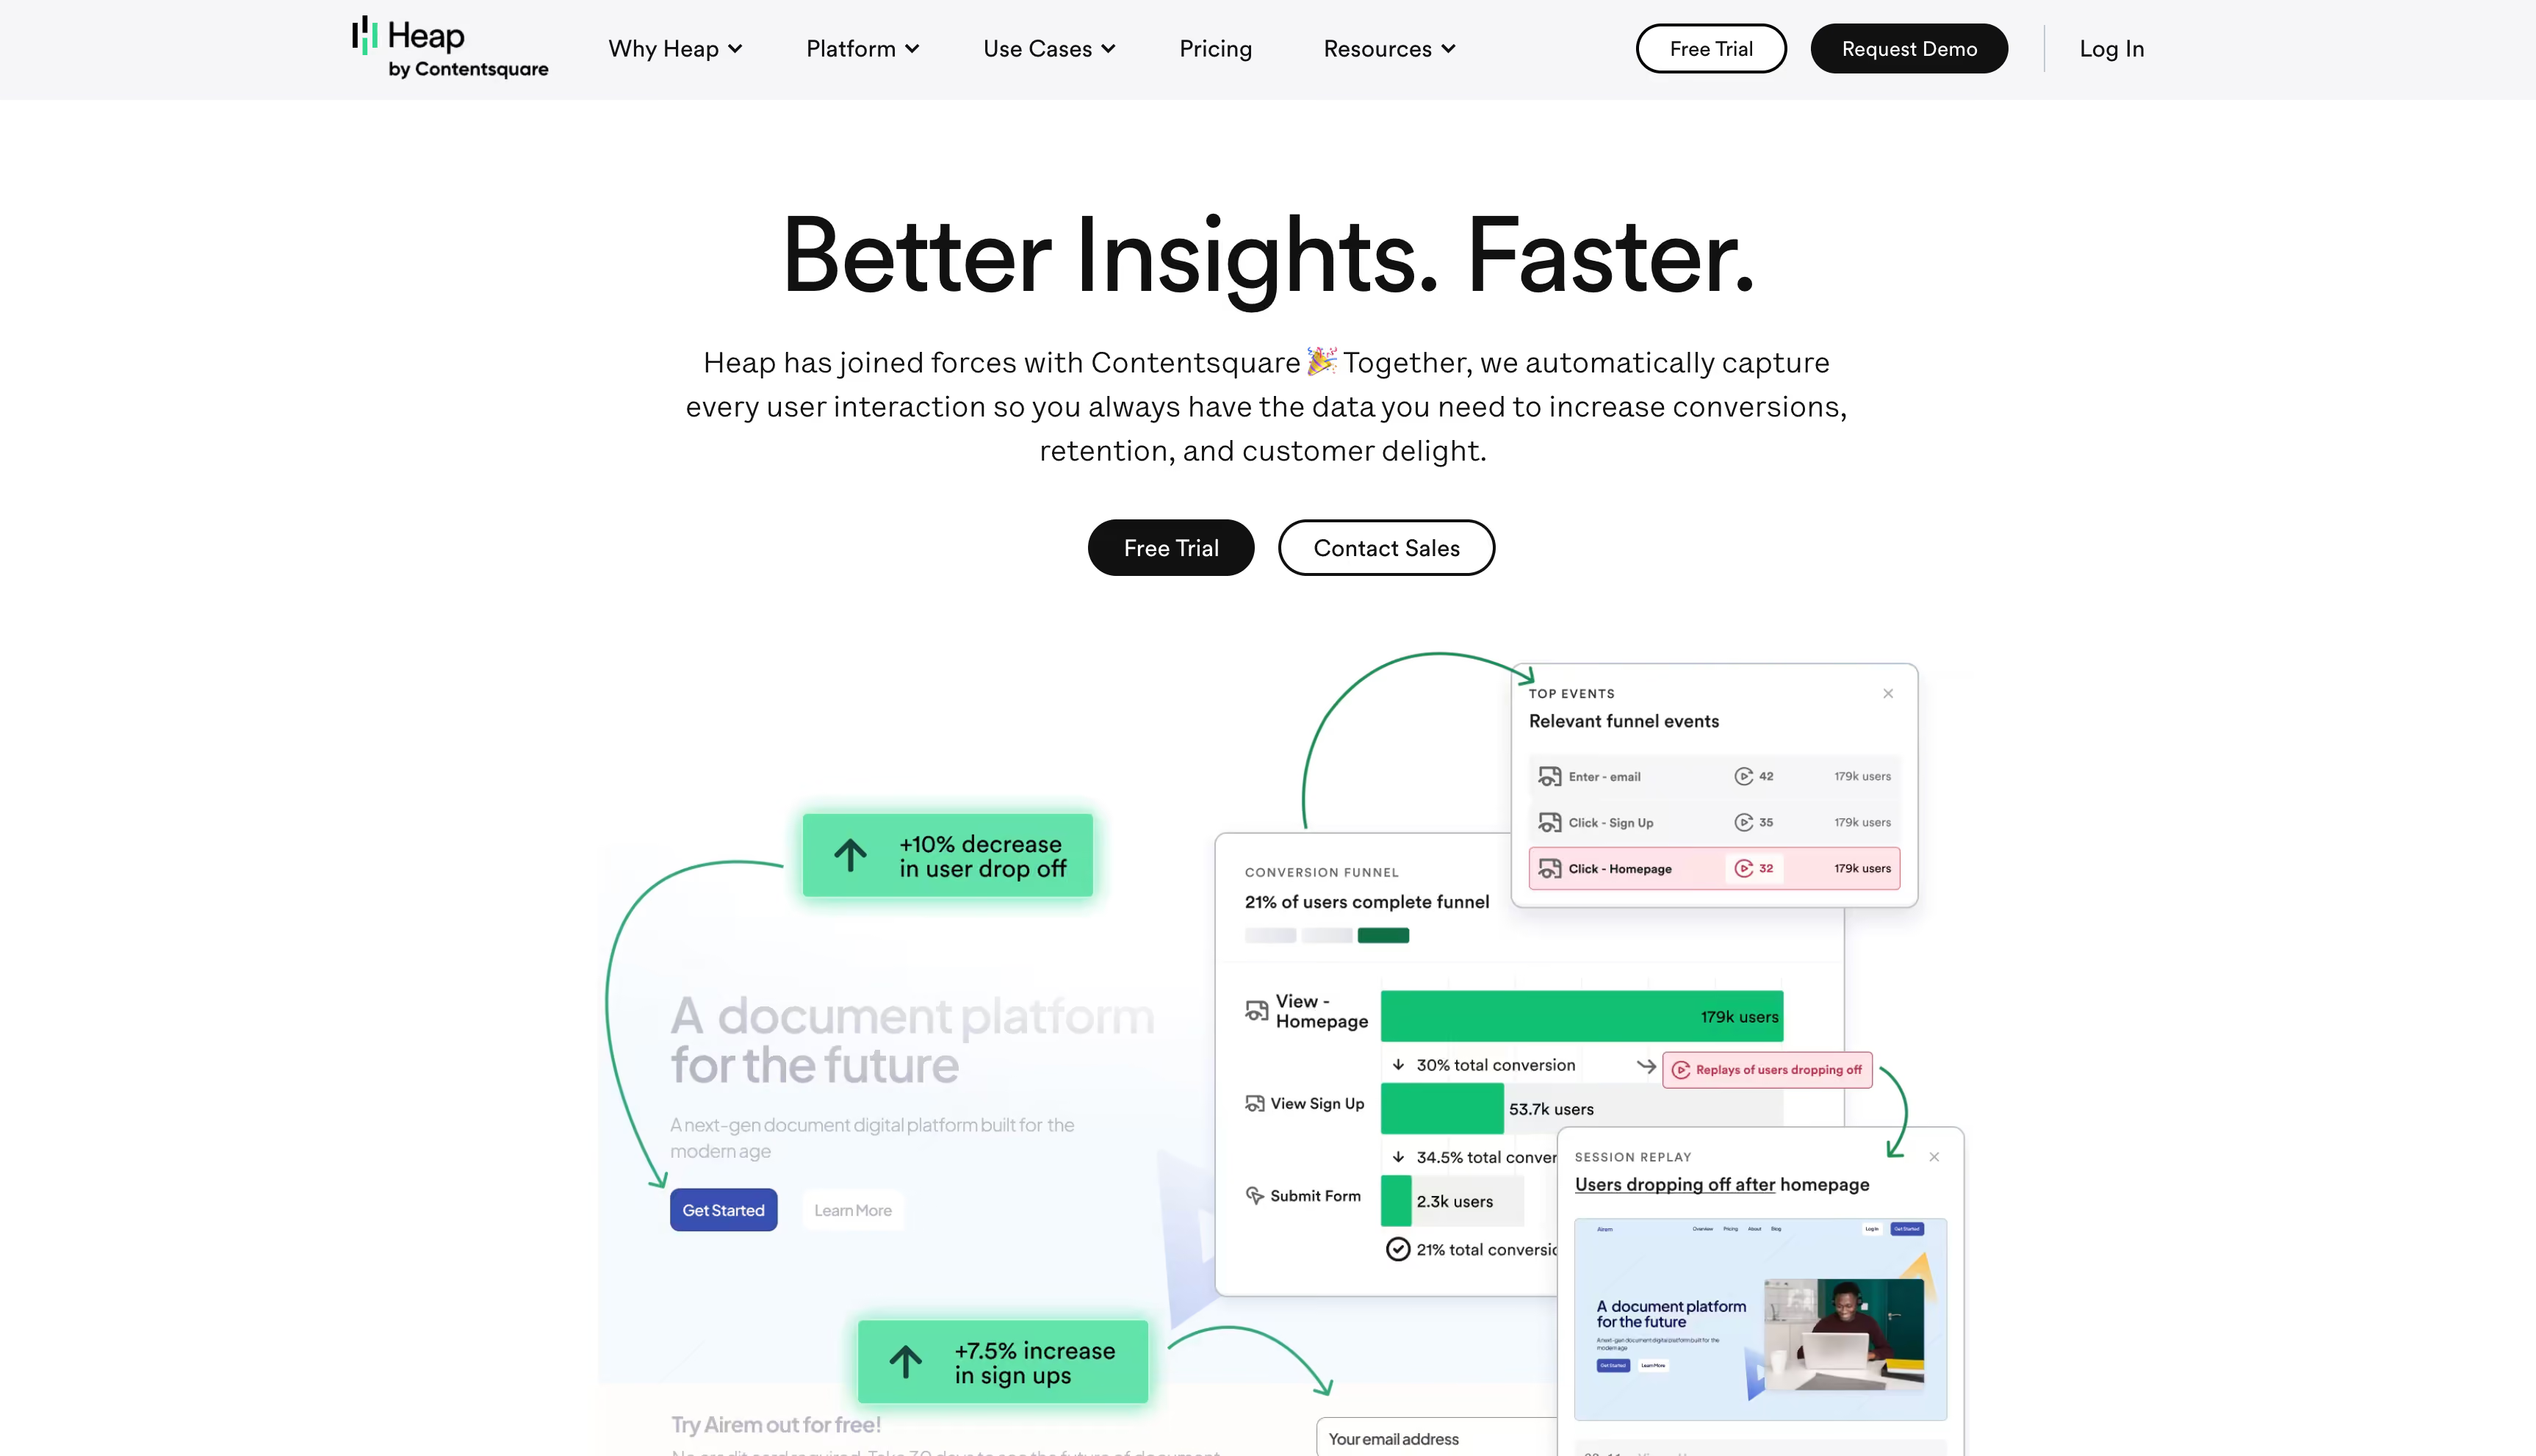
Every funnel in Mixpanel and Amplitude carries the same silent condition: you can only analyze what you decided to track. Heap breaks that. One snippet autocaptures clicks, pageviews, taps and form fills, and you define what counts as an event afterwards, so a question asked in December about September gets answered the same afternoon. The cost matches the benefit, because capturing everything means the dataset arrives uncurated. Heap now sits inside Contentsquare, so evaluate it as the funnel analytics layer of that platform.
Key features
Strengths
Limitations
Pricing
Free covers 10,000 monthly sessions with six months of history. Growth adds Sense AI, unlimited users and 12 months of history, though you only get a number after installing the snippet. Pro adds account analytics, Premier adds warehouse integration. Every paid tier is custom session pricing with no published rate, and replay stays an add-on even at the top.Reviews
4.4 out of 5 across roughly 1,100 G2 reviews, weighted toward mid-market. Autocapture dominates the praise, usually framed as engineering time saved. Pricing dominates the criticism, cited across every company size, with the step from free to paid described as abrupt.Bottom line
The right answer if your team questions change faster than your tracking plan does, and the wrong one if nobody owns data hygiene. Like the rest of this list, it explains what happened on your site and says nothing about what the traffic cost.Contentsquare
★4.6Best for: ecommerce and UX teams who already know where the funnel leaks and need to explain why.
Most tools here end their answer at a percentage. Contentsquare starts there. A drop-off becomes replays of people who quit at that step, a heatmap of what they touched first, rage clicks on the element that failed them, and a figure for what the problem is costing. That last piece matters: impact quantification prices each friction point so a team can rank fixes rather than argue about them. Two structural notes: roughly half its G2 reviewers are enterprise accounts, and it owns both Heap and Hotjar.
Key features
Strengths
Limitations
Pricing
Four tiers: Free, Growth, Pro and Enterprise, with Product Analytics quoted through sales at every level. Free covers around 200,000 monthly sessions. Growth is published from roughly $49 a month and adds funnels and impact quantification, though that figure is the entry rung on a session-volume slider rather than a price.Reviews
4.6 out of 5 across roughly 600 G2 reviews, the highest rating here, with about half from enterprise accounts. Praise centers on visual clarity and non-analysts being able to read the insights. Criticism is narrow: implementation is time-consuming and replay has gaps. Nobody argues with the analysis itself.Bottom line
The best diagnostic layer on this list, and the only competitor that attaches money to a funnel step. Buy it when you have a UX or CRO function to act on what it finds. It tells you what a broken checkout step costs in revenue, not whether the traffic arriving there was profitable to buy.FullStory
★4.5Best for: teams whose funnel problem is a broken interface rather than a broken offer.
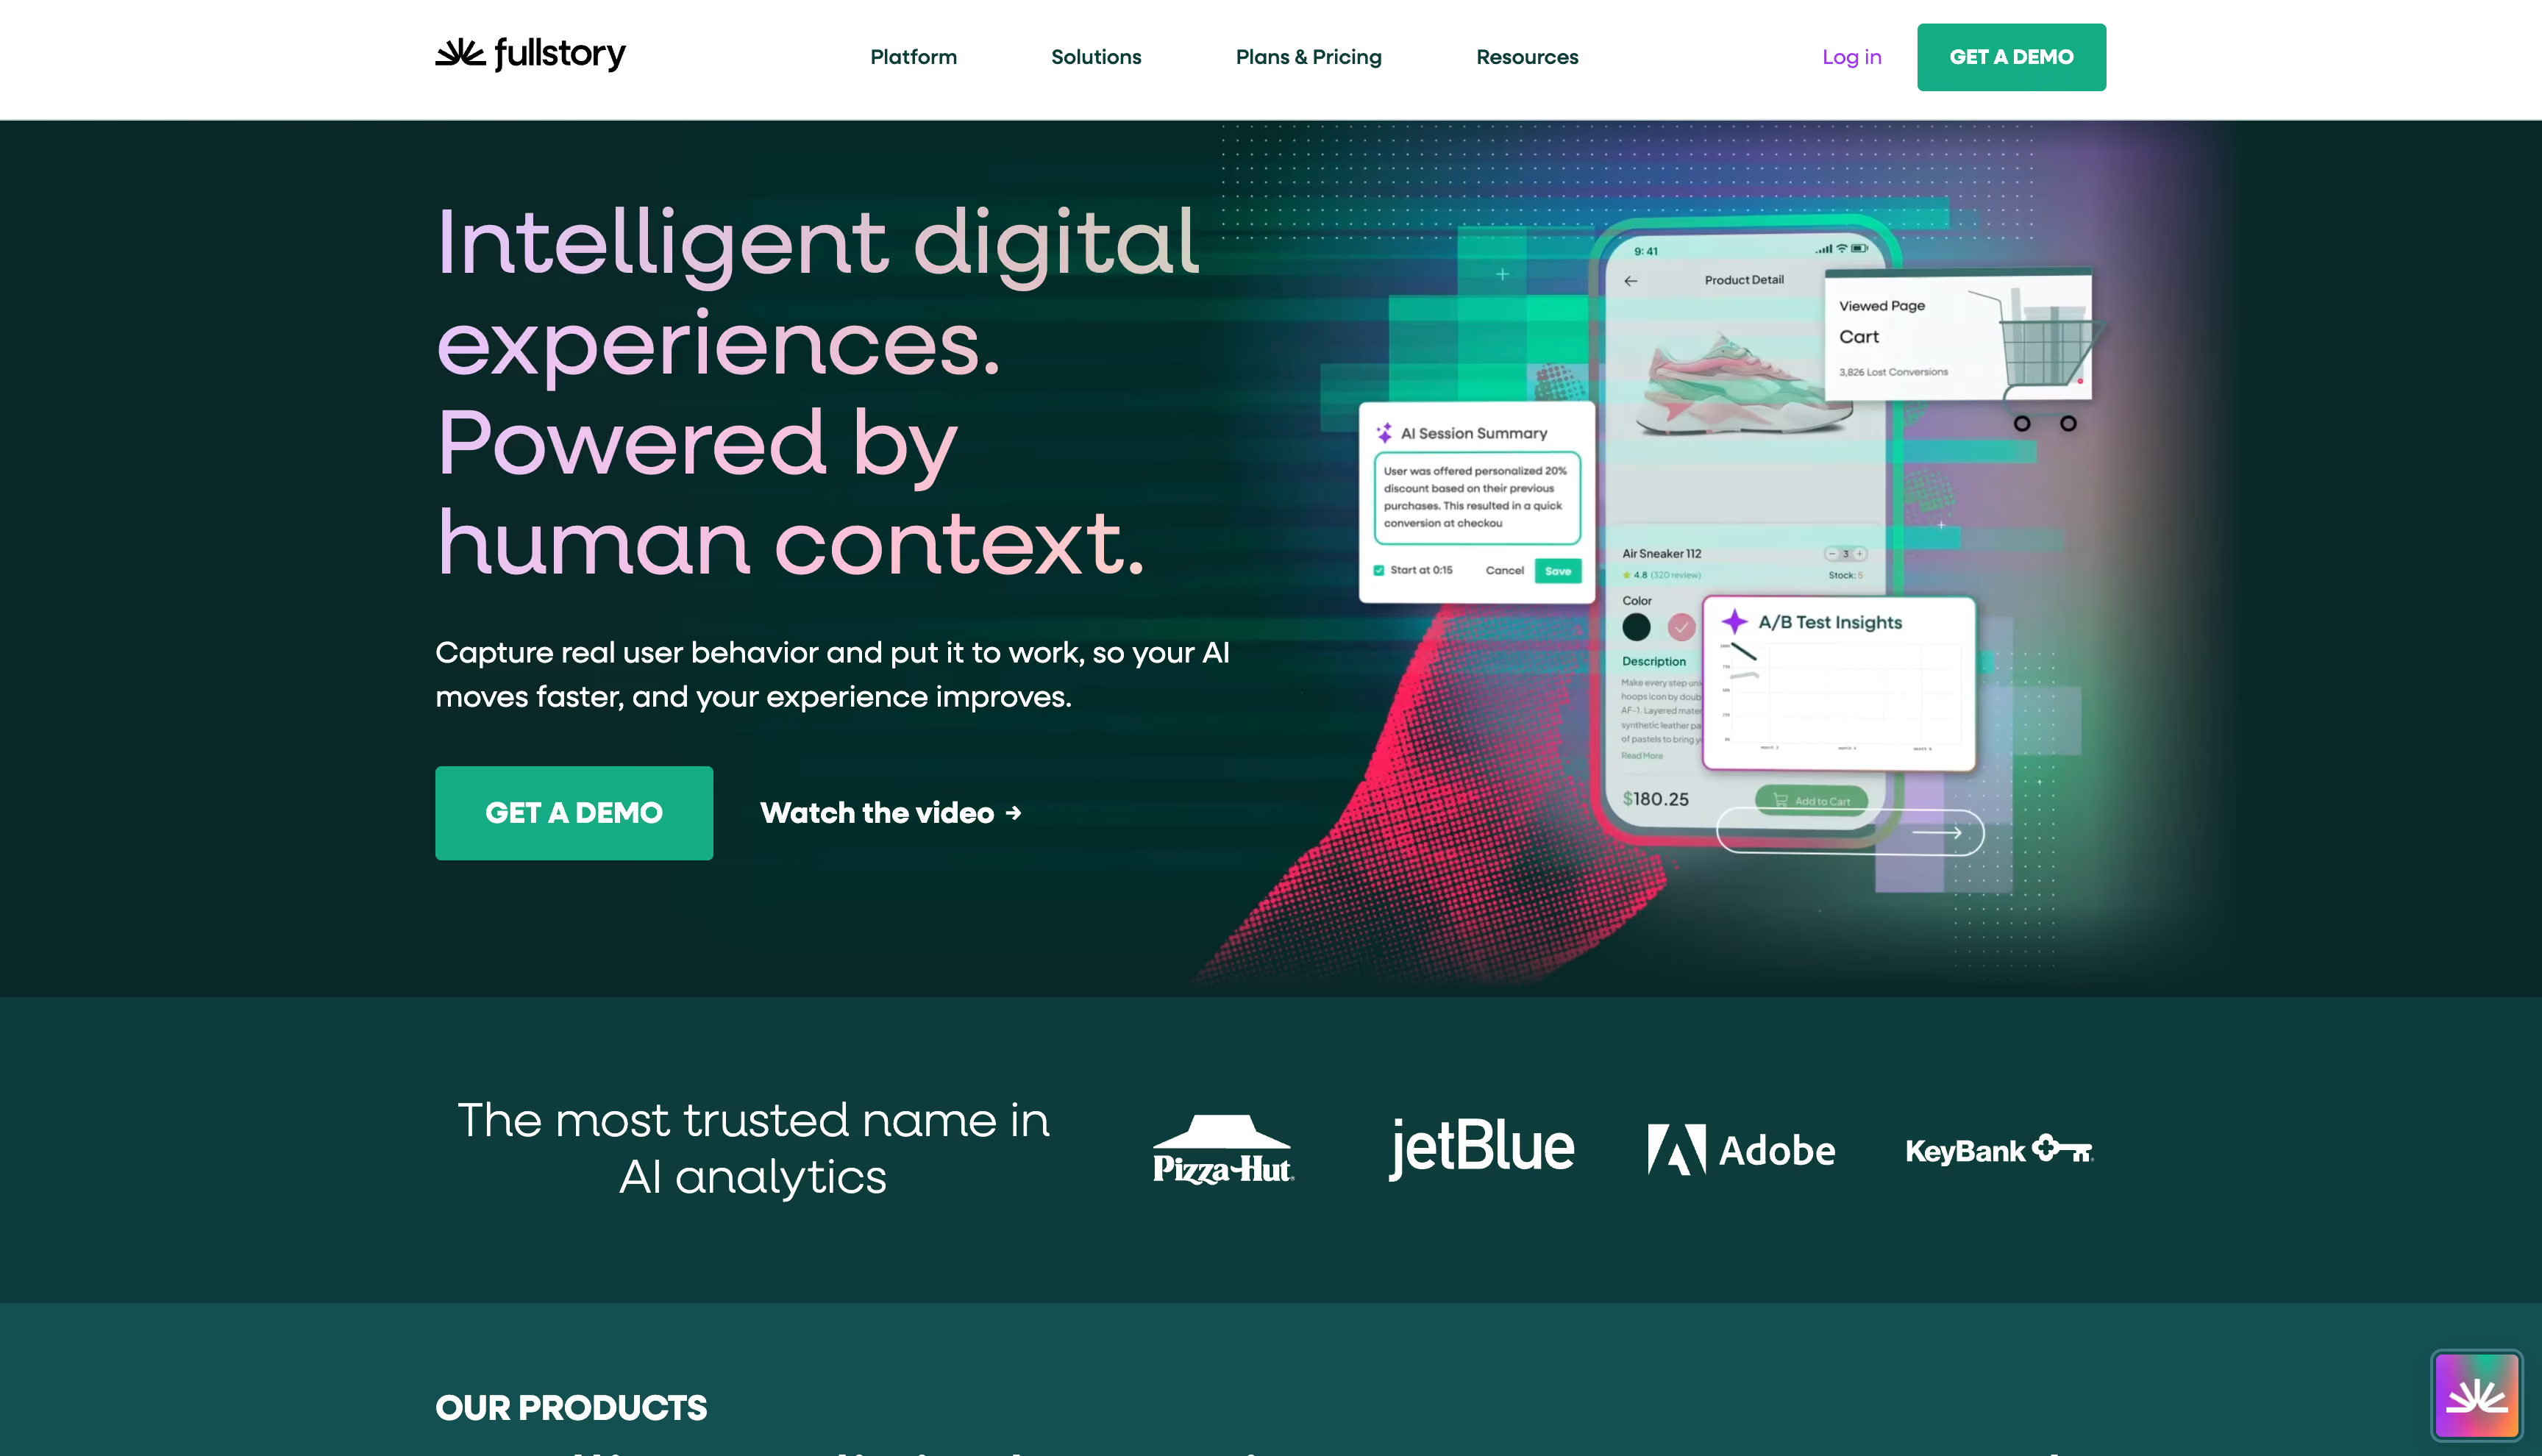
FullStory approaches funnels from the opposite end of Mixpanel. Where Mixpanel builds a chart and lets you interrogate it, FullStory builds a chart mainly to route you into recordings. The funnel is a navigation device. The answer is the session where a customer tapped the promo code field four times and left. Its capture engine records clicks, form inputs and page visits without manual tagging, with frustration signals and console errors tied to the moment someone abandoned.
Key features
Strengths
Limitations
Pricing
A free tier covers around 30,000 sessions a month, but it is replay-focused and excludes funnels, heatmaps and dashboards. Business unlocks the analytics engine, Advanced adds StoryAI summaries, Enterprise adds SSO and mobile. Only the free tier carries a public number.Reviews
4.5 out of 5 across roughly 1,050 G2 reviews. Ease of use and insight quality lead the praise, and support gets named more often than in any other entry here. The criticism is dominated by one theme, and it is not accuracy: cost at scale, with startups calling the pricing prohibitive once they outgrow the free cap.Bottom line
If your drop-offs are caused by things you could see happening on a screen, this is the strongest diagnostic tool here. If they are caused by price, offer or the wrong traffic arriving, watching more recordings will not tell you that.Google Analytics 4
★4.5Best for: a baseline funnel every team already has installed, and the only one here that costs nothing to check.

There is a setting in your GA4 admin panel that decides whether you have a funnel tool at all, and most teams have never opened it. Data retention defaults to two months. Standard reports keep their aggregates forever, so last year traffic totals look fine and nobody notices. Explorations are different: funnels and segments run on event-level data, which gets deleted on that schedule and does not come back when you change the setting. That aside, GA4 sees the traffic source natively, so website funnel analysis splits by channel and campaign without extra plumbing.
Key features
Strengths
Limitations
Pricing
Free for standard properties, which covers almost everyone. Analytics 360 lifts retention to 50 months, removes UI sampling and adds SLAs, quoted through sales with reported entry points in the tens of thousands per year. BigQuery export is free to configure, but Cloud storage and query costs apply.Reviews
4.5 out of 5 across roughly 6,700 G2 reviews, by far the largest sample here. The praise is narrow: breadth of data, and the price. The criticism concentrates on the GA4 migration, and one number captures it better than any quote. Ease of use scores 7.8 across more than 5,600 ratings, the lowest usability score of any tool here.Bottom line
Keep it, use it as your free baseline, and go fix your retention setting. Just do not ask it to arbitrate paid media decisions, because it reports revenue rather than profit and has a structural interest in how Google own channels look.PostHog
★4.5Best for: engineering-led teams who want funnels, replay, feature flags and experiments on one bill.
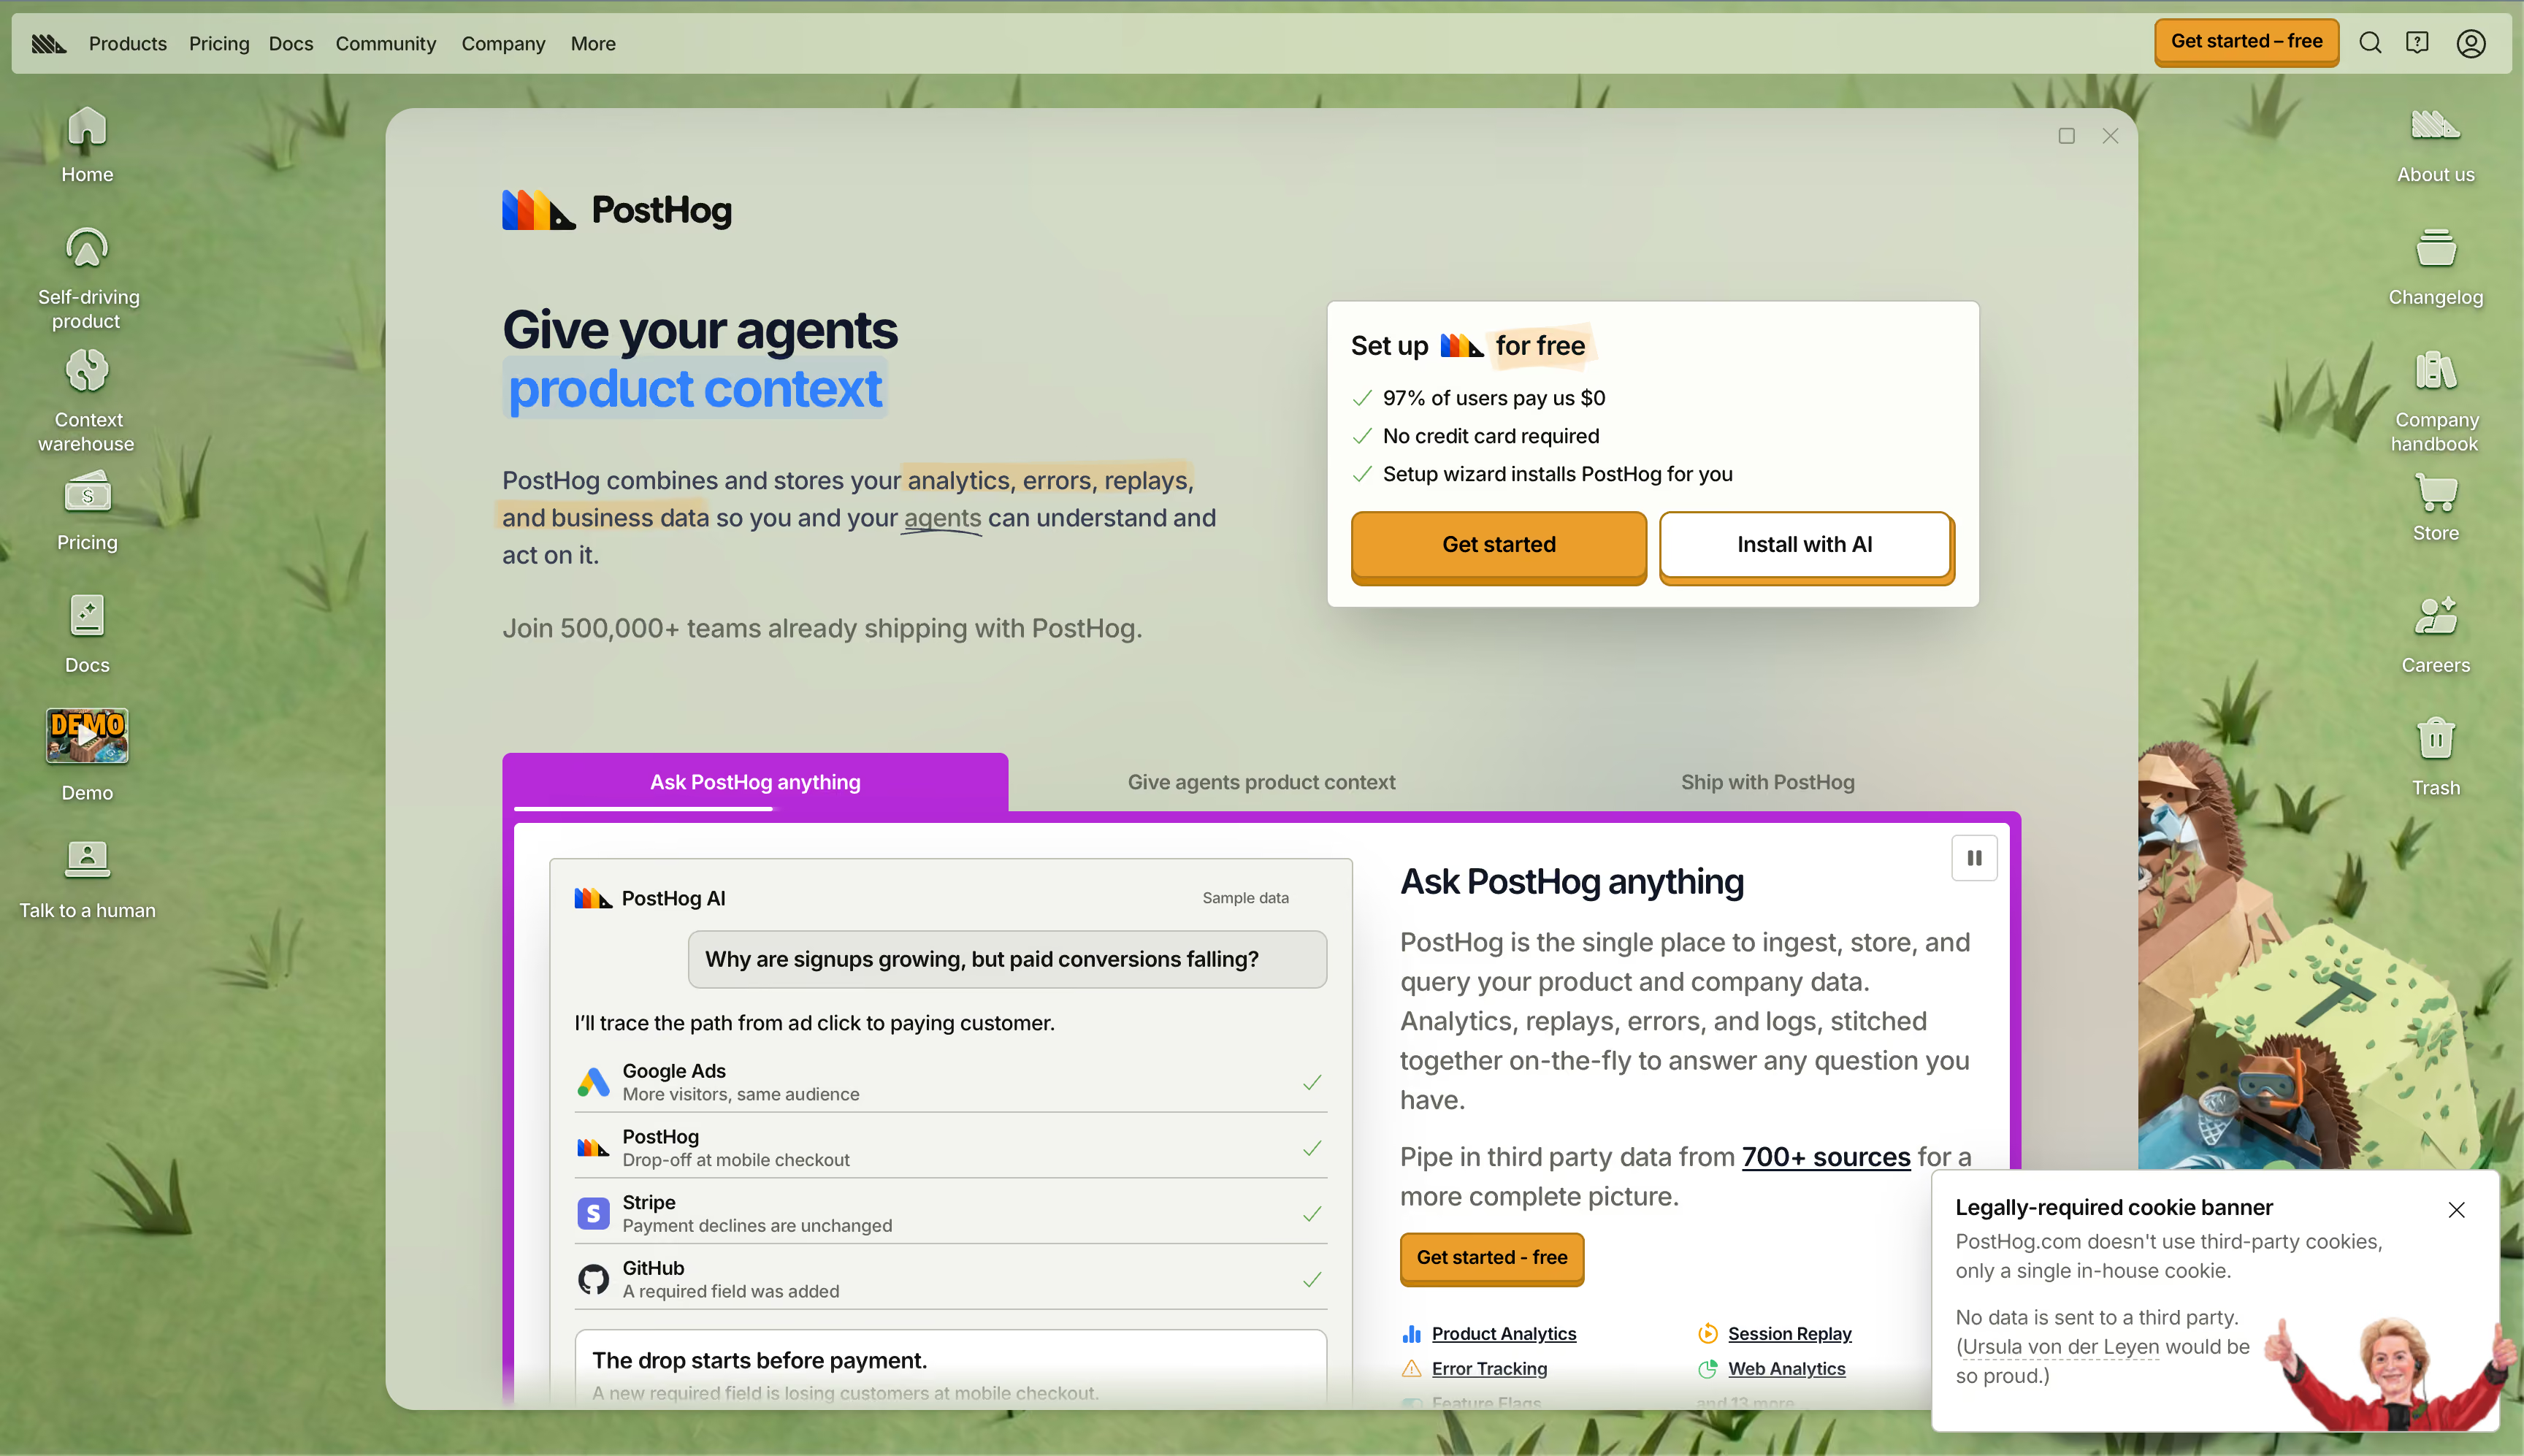
PostHog is the only tool in this comparison you can cost out completely without talking to anyone. Every product is metered with published per-unit rates and the free tier runs indefinitely, which is an outlier in a category where half the products here quote everything above the entry rung. The funnel itself is competent rather than category-leading. Where it pulls ahead is adjacency: a drop-off leads into a recording, then a feature flag that ships the fix, then an experiment that proves it worked.
Key features
Strengths
Limitations
Pricing
Free covers 1 million events, 5,000 recordings and 1 million flag requests a month, with one project and a year of retention. Pay-as-you-go bills from $0.00005 per event in the 1 to 2 million band; 12 million events lands around $393 a month. Identified events bill separately, from about $0.000198 each.Reviews
4.5 out of 5 across roughly 1,050 G2 reviews, with over 80% from small businesses, the sharpest segment skew here. Value dominates the praise: dozens of reviewers name it as cheaper than the incumbents while doing the same job. The criticism is mild: documentation thins out on advanced problems and queries slow down at scale.Bottom line
The best value on this list by a distance, and the right pick if a developer owns your analytics. It is not built for marketers, and if your team is rather than engineers, the honest reviews are telling you something.Hotjar
★4.3Best for: small teams who want the funnel and the reason for the drop-off in one cheap tool.
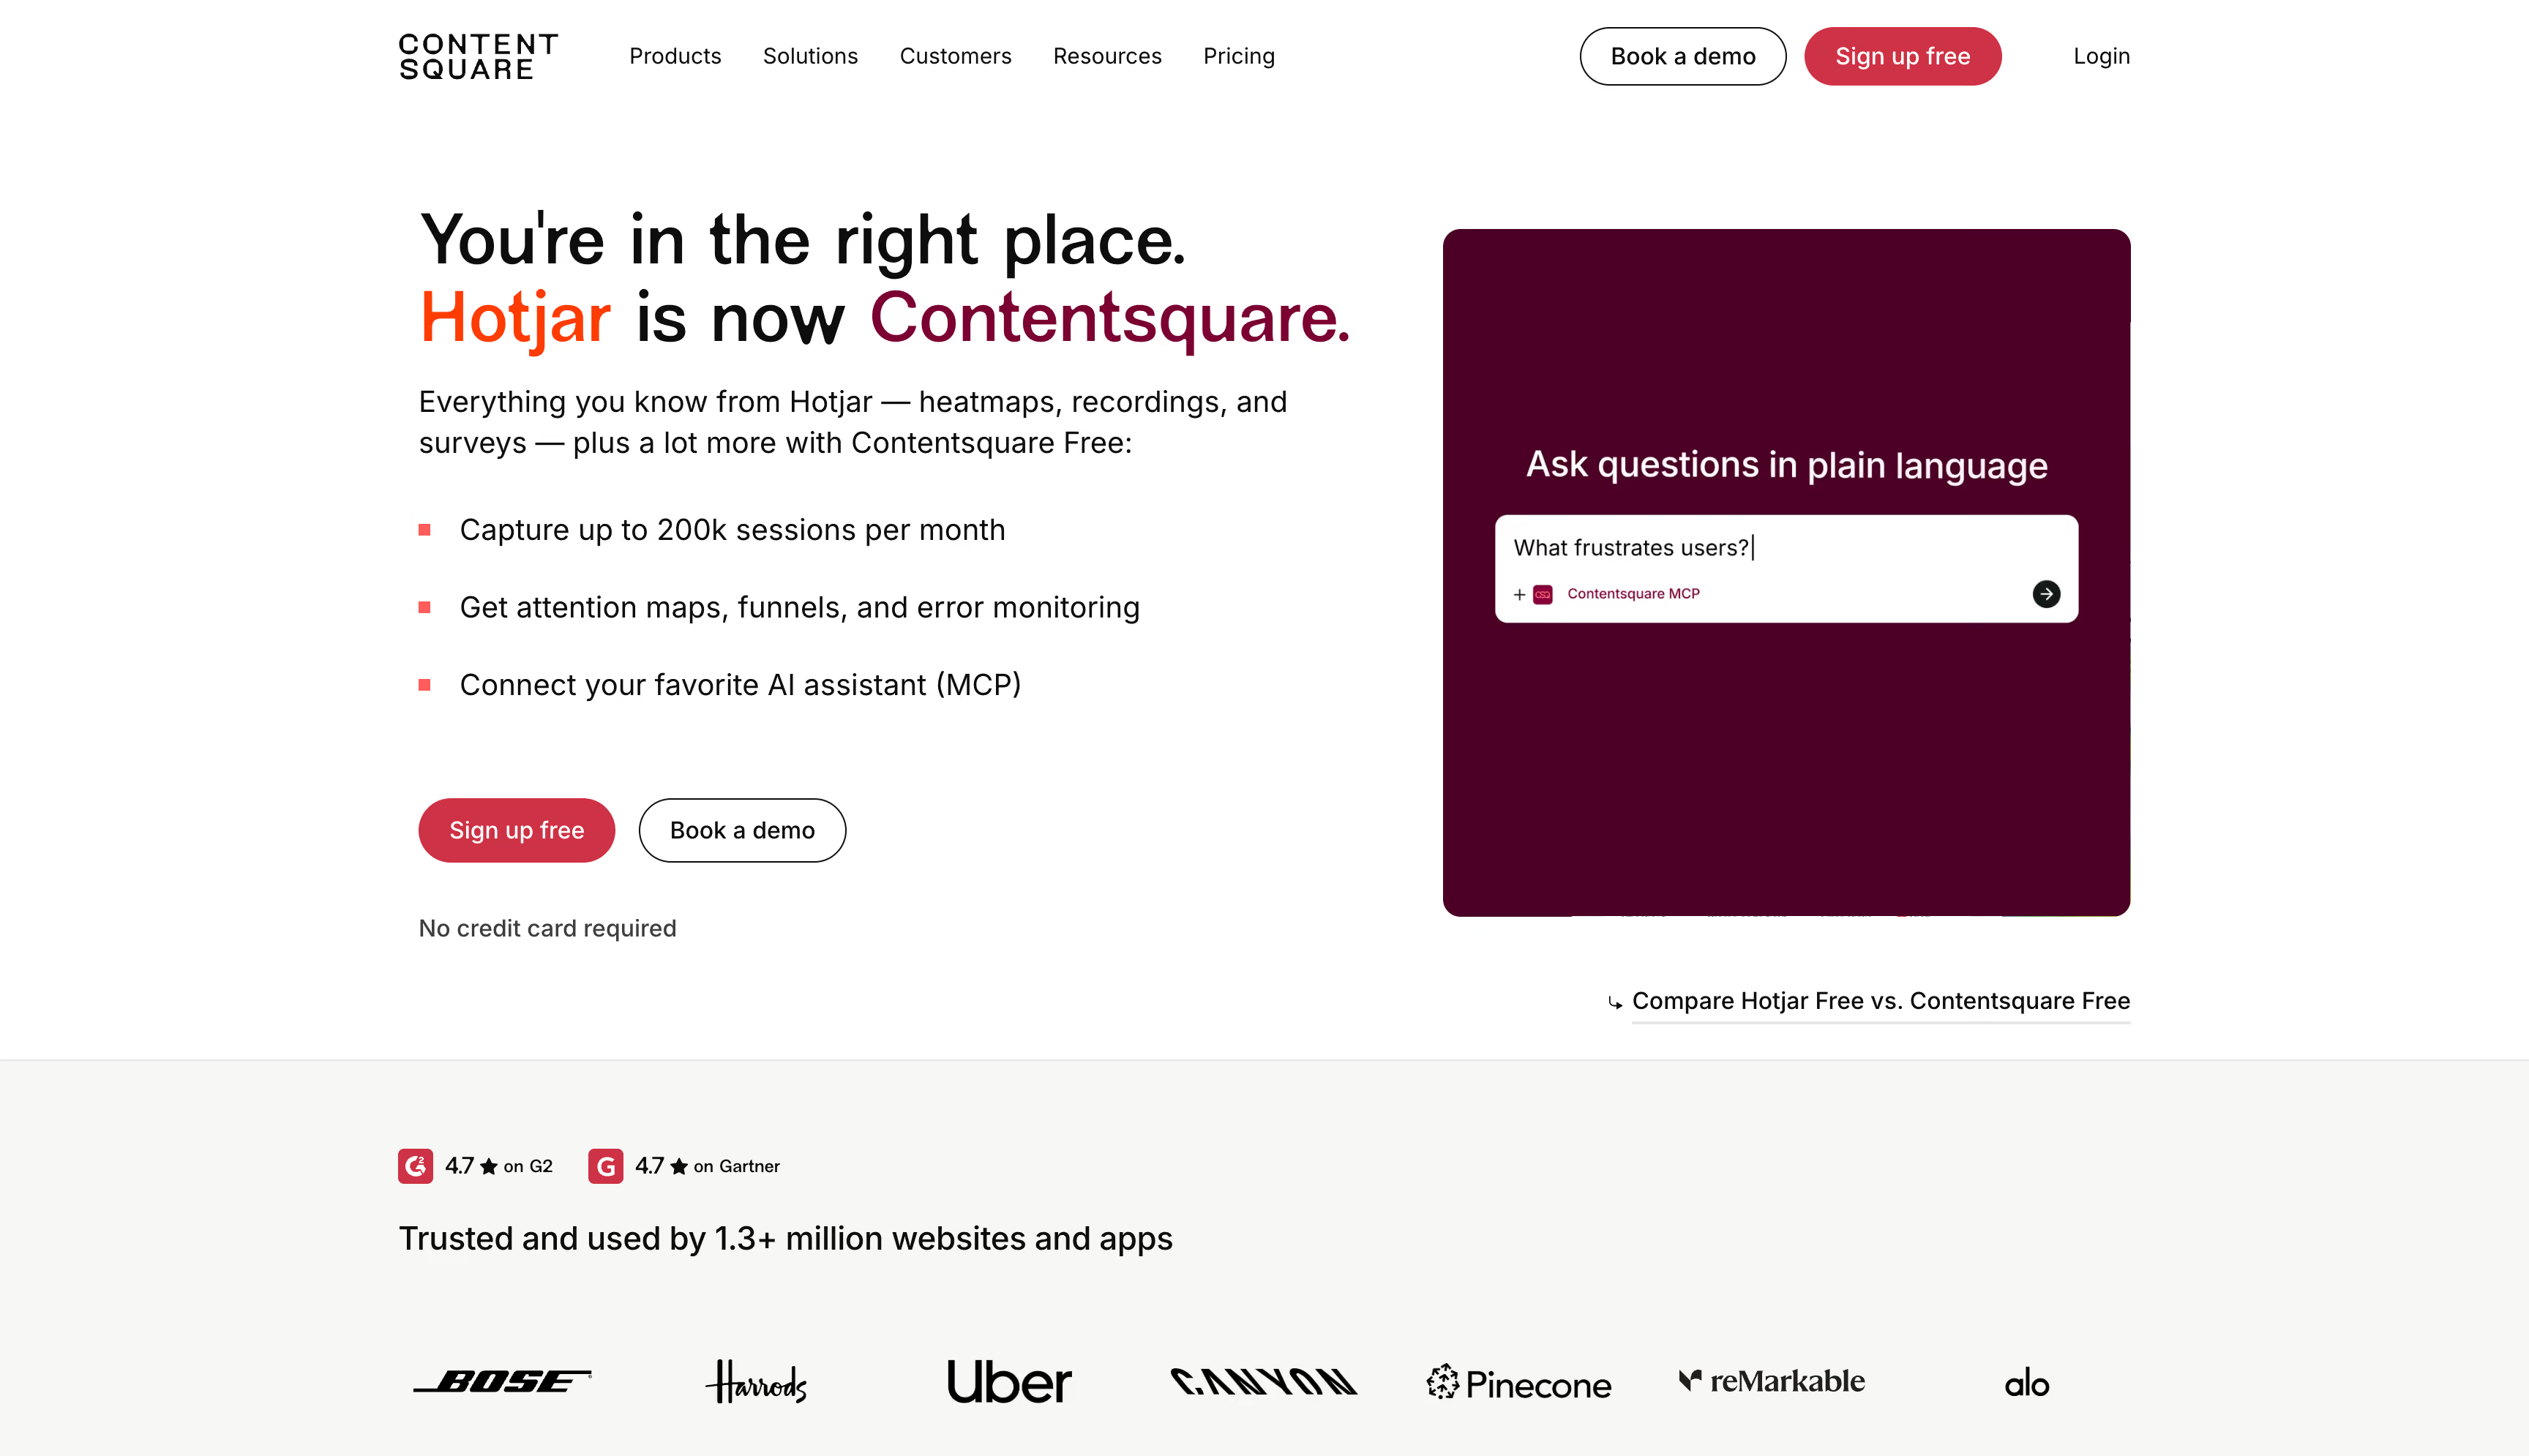
Hotjar built its reputation on being the tool anyone could install on a Friday and learn something from by Monday. Heatmaps, recordings, surveys, and later funnels, priced for a company without an analytics team. The complication is corporate. Click through to pricing from hotjar.com and you land on contentsquare.com, where the tiers are Free, Growth, Pro and Enterprise rather than the Basic, Plus, Business and Scale plans that Hotjar-branded pages still reference. Two teams evaluating in the same month can be shown different structures.
Key features
Strengths
Limitations
Pricing
Now Contentsquare pricing. Free covers 200,000 monthly sessions with around 10,000 replay captures that expire after 30 days. Growth starts at roughly $49 a month for the 7,000-session rung and climbs steeply. Pro and Enterprise are quote-only. Surveys bill separately from around $99 a month, so a team wanting funnels, replay and feedback buys two subscriptions.Reviews
Ratings sit around 4.3 on G2 across roughly 340 reviews and 4.6 on Capterra across roughly 540, and the split is informative: the G2 profile was rebuilt under the Contentsquare name, so sentiment is scattered across two records. The praise is unchanged for years: easy, visual, immediately useful. The recent criticism clusters on the transition.Bottom line
Still the best cheap way to see why people leave your checkout, and the surveys remain underrated. Just recognize what you are buying in 2026. This is the Contentsquare entry tier with a familiar name on it.Funnelytics
★4.2Best for: agencies and marketers who want the funnel diagram and the live data to be the same object.
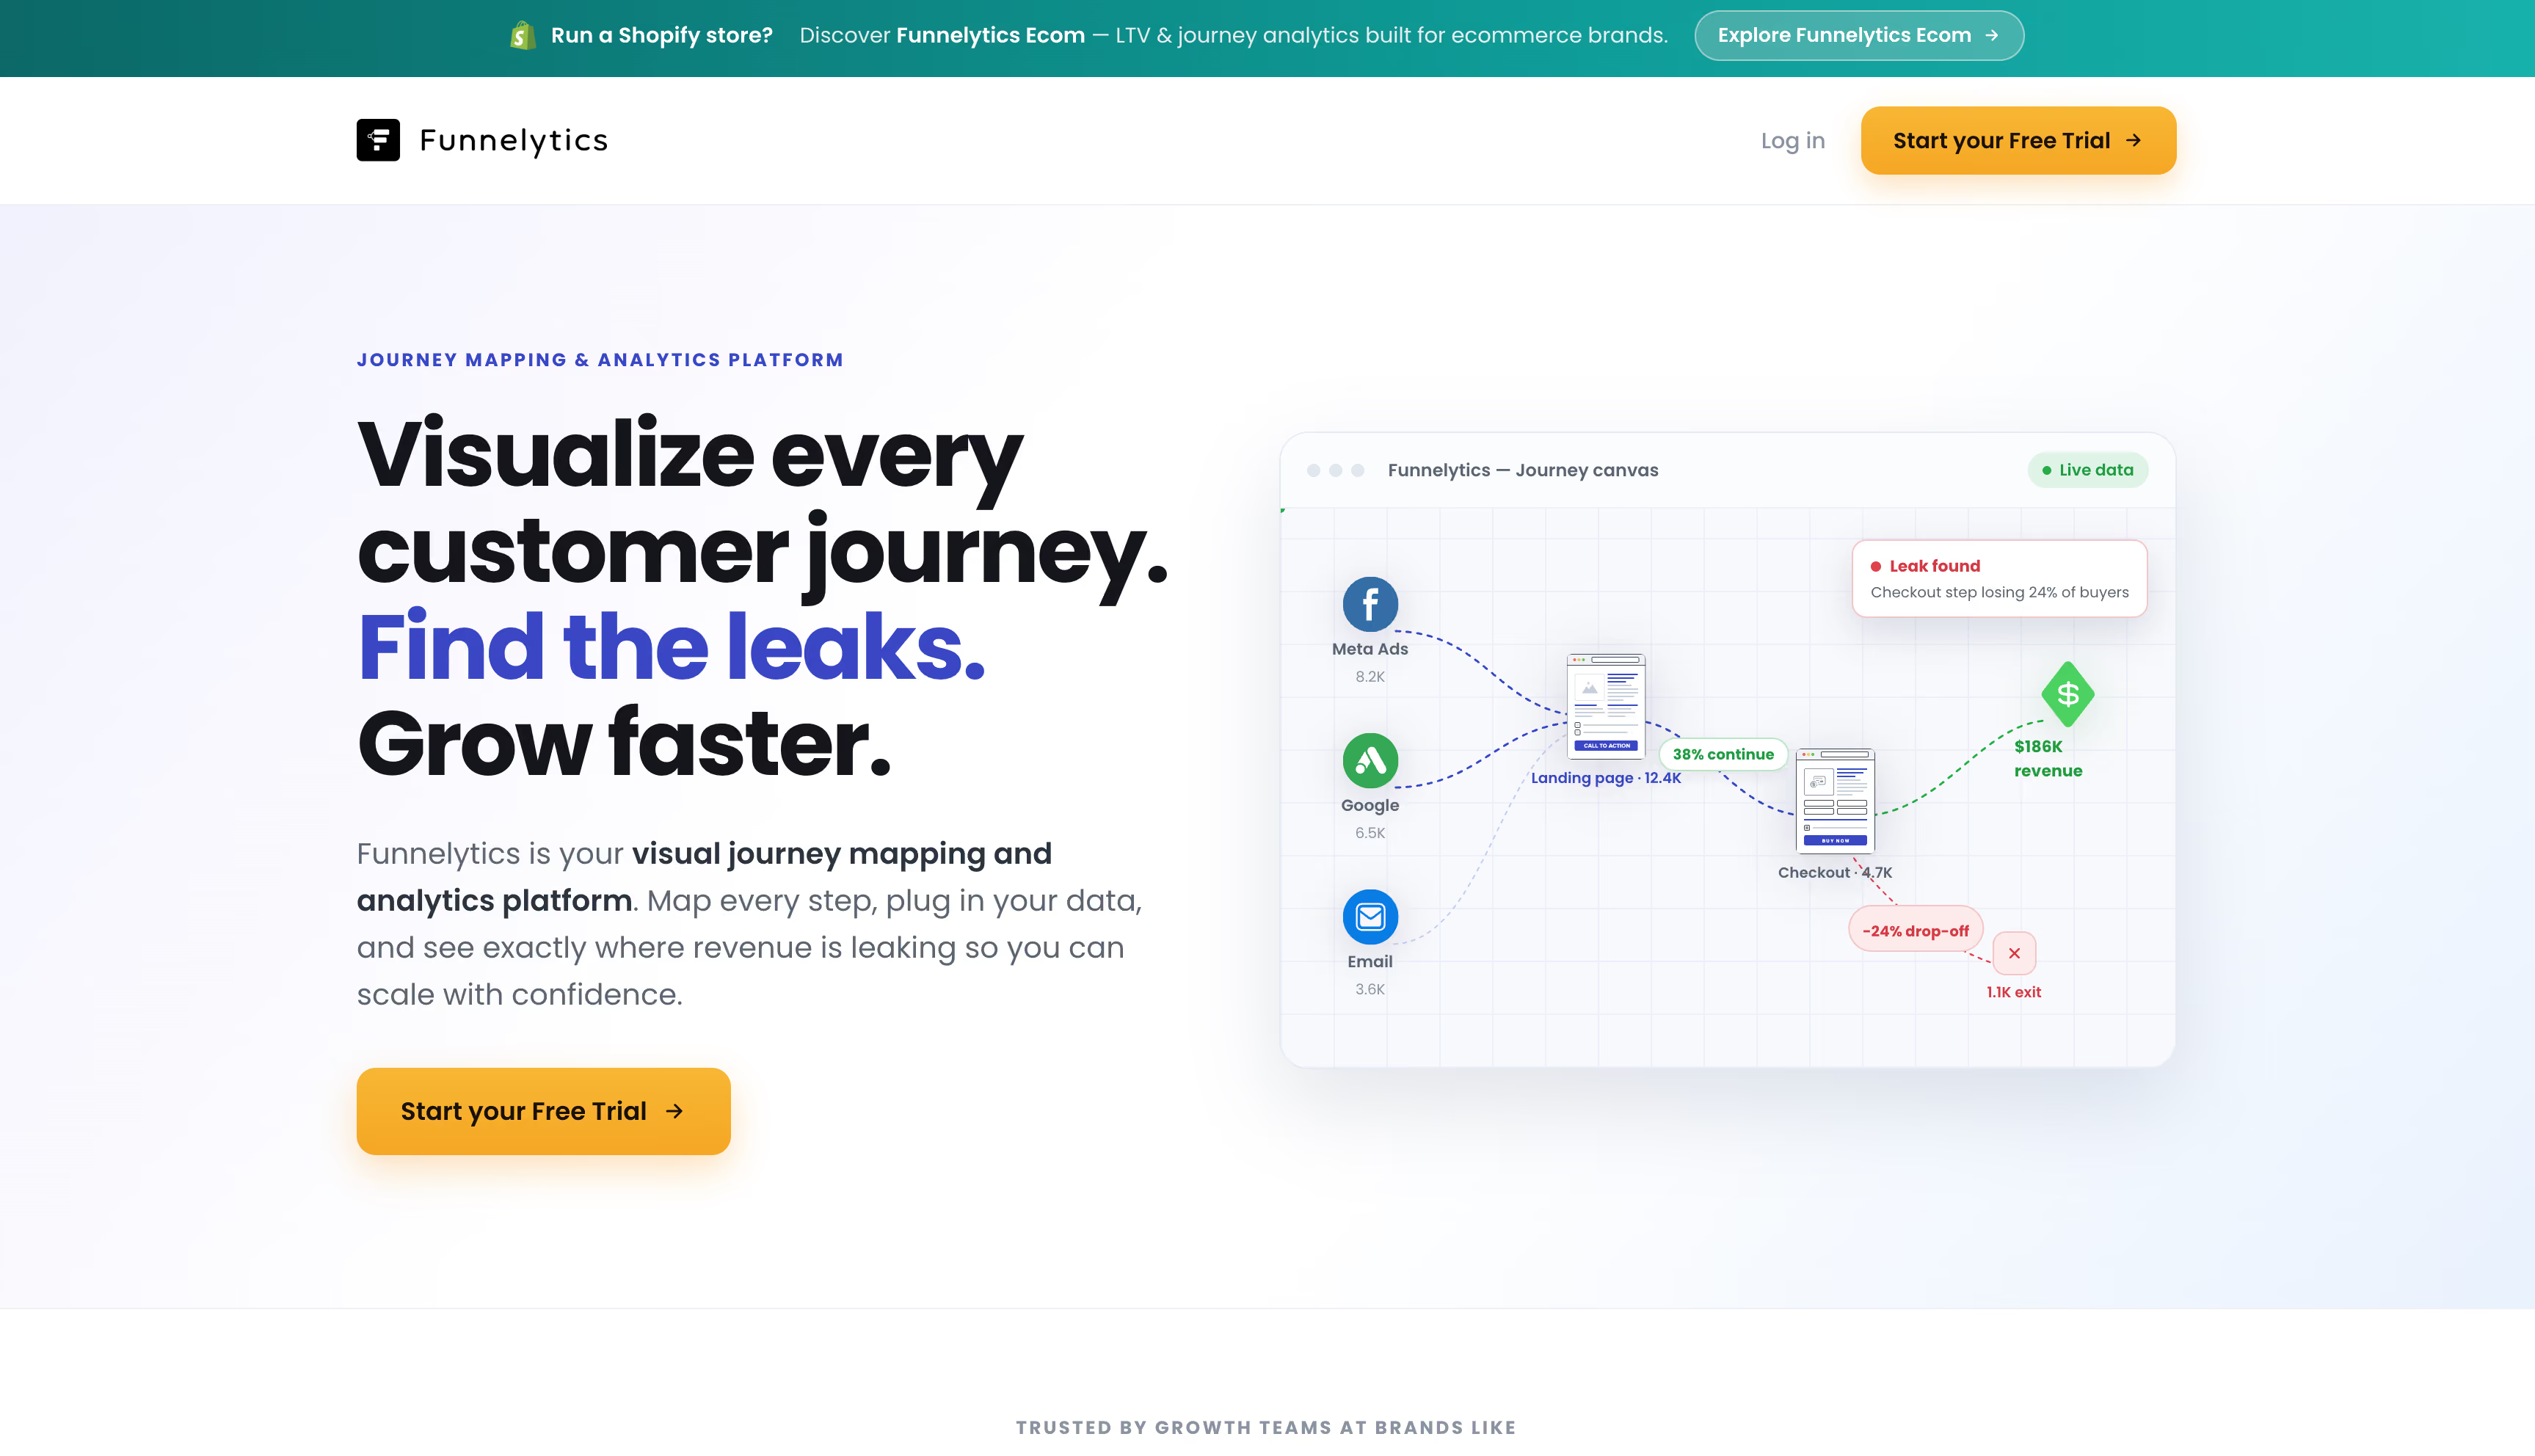
Every other tool here starts with a report and asks you to imagine the journey. Funnelytics starts with the journey. You draw the funnel on a canvas, ad source to landing page to upsell to checkout, and it overlays real traffic onto the shapes you drew. The map is the dashboard. Client conversations change when the strategist and the buyer look at the same diagram, which is why agencies make up the bulk of its user base. It is also the only competitor here that pulls ad platform data onto the canvas.
Key features
Strengths
Limitations
Pricing
Treat every number here as needing confirmation. Funnelytics has moved through several packagings and sources disagree: third-party listings put Performance Pro near $129 a month and Business near $349, while the vendor own announcement listed Starter at $79 rising to $999. A 14-day trial is consistently available.Reviews
4.2 out of 5 across roughly 35 G2 reviews, the smallest sample here and the lowest rating. The praise is consistent: the visual mapping is what people love, and ease of use scores 8.9. The criticism has two threads: setup is harder than the interface suggests, and the price stings for solo operators.Bottom line
Buy it for the map, not the measurement. If you run funnels for clients and need a shared visual language, nothing else here does that job. If you need the numbers underneath to survive consent loss and resolve to profit per path, this is analytics attached to a planning tool.The best funnel analysis tools for 2026: final verdict
Every tool here measures something real. The difference that decides your quarter is where the measurement starts and where it stops.
Admetrics wins because it does both ends. The funnel begins at the ad impression with the spend attached, survives consent loss through server-side capture tied to real orders, carries the arithmetic through COGS, shipping, fees and returns to contribution margin per step, and lets you move the budget from the same screen. Everything else starts at the session and ends at the conversion event, so it can tell you 29% abandoned the cart and never whether the 71% who did not were worth what you paid for them.
The alternatives earn their slots for narrower jobs. Mixpanel and Amplitude are the strongest in-product funnels, and only Amplitude explains a drop-off rather than locating it. Heap removes the tagging problem. Contentsquare and FullStory are the best diagnostic layers, Hotjar the cheap version. PostHog is the best value if a developer owns your analytics, GA4 the free baseline, and Funnelytics the one for a map a client will look at.
Paying to fill a funnel you can only half see is the expensive version of this problem. Start with Admetrics, then use the nine above to pressure-test it against your own stack. Run a two-week trial on live orders and watch whether pricing your drop-offs changes which one you fix first.