
Your Black Friday campaign closed at 6x ROAS, so you poured December budget into the same ads. Then January arrived with the returns. Almost a quarter of those orders came back, the rest shipped with a 30% discount code, and the campaign you scaled hardest turned out to be the least profitable of the quarter.
Nothing in that story was a tracking error. The clicks were real and so were the orders. The ecommerce attribution layer failed: it credited revenue correctly but priced it wrong, and nobody saw the gap until the refunds cleared. With Q4 weeks away, that's the mistake worth fixing first.
This guide compares 10 ecommerce attribution tools on what they track, what they can prove, whether they count profit, and whether anything happens after the report loads. We build one of them, so the method comes first and every competitor gets the same checklist.
Key takeaways
What is ecommerce attribution?
Ecommerce attribution is the method an online store uses to decide which ads, channels and touchpoints earned credit for each order, and therefore where the next dollar of ad spend should go. It connects spend on one side to orders on the other, then splits the credit across everything the buyer saw in between.
That split is where brands disagree. A typical DTC purchase might pass through a TikTok video, two Meta retargeting ads, a Klaviyo email and a branded Google search over two or three weeks. Each ad platform will happily claim the whole order. Your store will record it once. Attribution is the referee between those two views.
There are four main ecommerce attribution methods, and they answer different questions:
The strongest setups combine at least two of these and use one to check the other.
Ecommerce attribution models: which one fits a DTC brand?
Ecommerce attribution models are the rules that decide how credit gets split across a journey. Pick a different model and your "best" channel changes, which is why the choice matters more than it looks.
Single-touch models give one touchpoint 100% of the credit. Last click rewards whatever came right before checkout, usually branded search, retargeting or email. First click rewards whatever introduced the buyer. Both are easy to read and wrong in a predictable direction.
Rule-based multi-touch models split credit by position. Linear gives every touch an equal share. Time decay leans toward the most recent touches. Position-based (U-shaped) gives the most weight to the first and last touches and divides the rest across the middle. They're better than single-touch, but the weights are someone's assumption, not a measurement.
Data-driven models learn the weights from your own conversion paths, comparing journeys that converted with ones that didn't. They're the most accurate option once you have volume, and the hardest to explain to a CFO.
So what's the best attribution model for DTC ecommerce? For most brands spending across three or more channels, it's a data-driven multi-touch model, checked against MMM or a periodic lift test, with last click kept open in a second tab as a sanity check. A few DTC best practices make any model more honest:
Why server-side tracking decides attribution accuracy
Every model above depends on the same thing: seeing the conversion in the first place. Browser pixels increasingly don't. Safari caps first-party cookies, iOS users opt out of app tracking, ad blockers strip scripts, and consent banners hold the pixel back until the visitor agrees. Each of those is an order that happened and never reached your report.
Server-side tracking records the conversion from your own server instead of the shopper's browser, so it survives most of what kills a pixel. The bigger payoff comes next. Those recovered, first-party conversions can be sent back through Meta's Conversions API, Google's Enhanced Conversions and their equivalents, which means the bidding algorithms learn from buyers they would otherwise never have seen.
That's the question to put to every vendor: how many ad networks receive the enriched conversions? On this list the answers vary widely. Cometly sends to seven networks and Admetrics to six. Polar sends to Meta and Google. Wicked Reports covers Meta only, as an add-on on its lower plans, and Fospha doesn't track users at all. A tool that recovers conversions but keeps them in a dashboard fixes your report and leaves your ad delivery exactly where it was.
Beyond ROAS: attribution priced in profit
Picture two campaigns. Campaign A runs at 3.2x ROAS selling a full-price bundle that keeps 55% of revenue after COGS, shipping and payment fees. Campaign B runs at 4.5x ROAS on a discounted hero product that keeps 18% once returns are counted.
Every ROAS dashboard ranks B first. Now price them in profit. Each dollar on A returns $1.76 in contribution, so it's making money. Each dollar on B returns $0.81, so it's losing 19 cents on every dollar you give it. The campaign you'd scale on ROAS is the one draining margin.
Profit on ad spend (POAS) makes that visible by dividing contribution margin, not revenue, by spend. It needs data most attribution tools never collect: product costs, shipping, transaction fees, discounts and, above all, returns by campaign and SKU. That's the dividing line in this category. A few tools here get to gross margin, two reach contribution margin, and only one breaks out returns by campaign and product.
Measure, model, act: where most tools stop
Attribution answers three questions on three timescales. MTA tells you which ads are pulling weight this week. MMM tells you which channels deserve budget next quarter and where each one starts to saturate. Incrementality tests settle the arguments when the first two disagree. A tool that only does one leaves the others to a spreadsheet.
Then there's the step after the answer. Most platforms in this guide finish with a recommendation, and someone on your team still opens five ad accounts and moves the money by hand. That handoff is where good analysis goes to wait.
A few tools now close it. Triple Whale's Moby and Cometly's AI Ads Manager can change budgets or pause ads inside rules you set. Fospha can push its model into Smartly on Enterprise plans. Admetrics' Ad Pilot executes cross-platform budget moves with approvals, rollback and a decision log, and it's the only one here that plans those moves on contribution margin rather than revenue.
How we tested and scored
We build Admetrics, so read this section before the rankings. Every tool, ours included, was scored on the same four criteria, weighted by how directly each one changes a budget decision:
Features come from each vendor's own website and product documentation, checked in September 2026. Strengths and limitations come from recurring patterns across G2, Capterra and Trustpilot reviews, not single complaints. Where the documentation and the reviews disagreed, we noted it in the entry. Where a vendor publishes nothing on a capability, we say so rather than guess.
Best ecommerce attribution software compared (2026)
Admetrics
★4.97Best for: stores selling physical products on Shopify, WooCommerce or Magento where marketing and finance keep naming different winners, and the team wants one system to settle it and then reallocate spend.
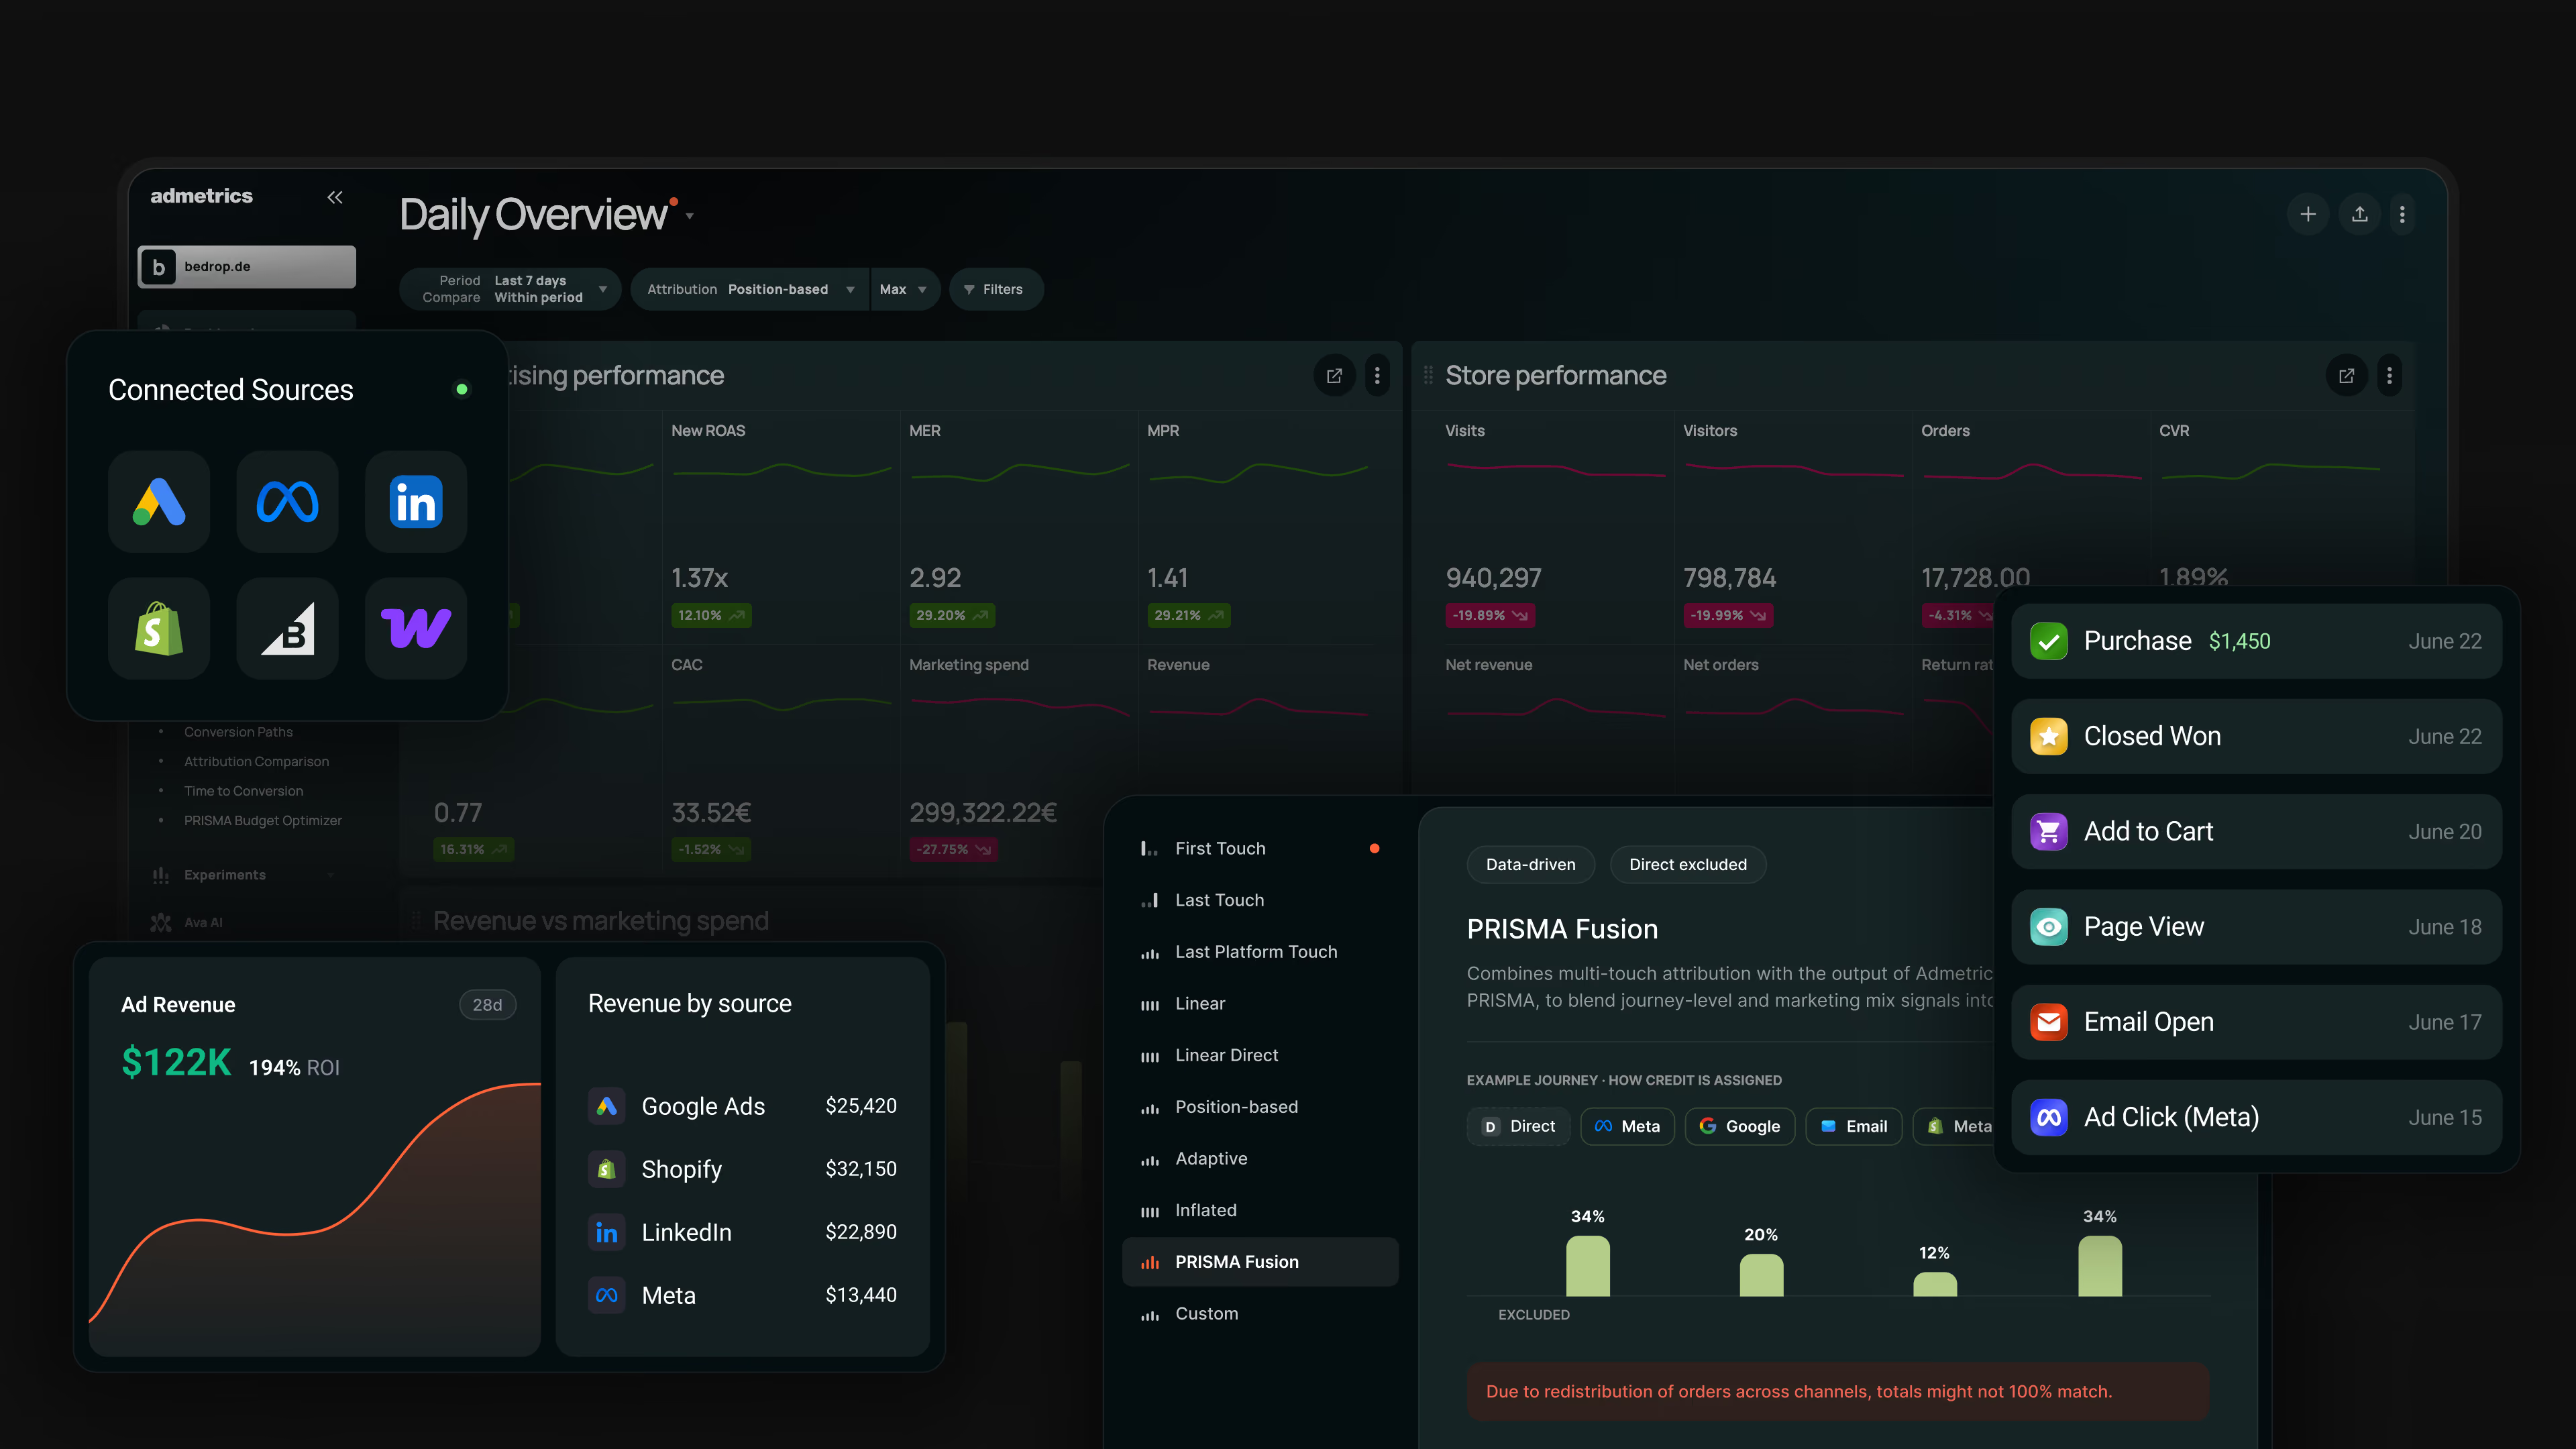
Most stacks answer three questions in three places: which ad produced the order, whether the order made money, and what to change on Monday. Admetrics answers all three on the same order record. Its ecommerce attribution starts server-side, each order then carries its own product, shipping, fee and refund costs, and by the time a campaign reaches the Budget Optimizer, it's judged on what it earned rather than what it billed. Ad Pilot pushes the resulting shift into the ad accounts once you approve it.
Key features
Strengths
Limitations
Pricing
Three plans, each with a monthly ad spend allowance and a percentage charged above it. With annual billing, which saves 15%, Growth costs €339 a month with €20,000 of spend included and 1.5% on the rest, and Business costs €764 with €70,000 included and 1% above. Custom starts at €1,100 for €100,000+ in spend. S2S conversion pushback is an add-on on every plan, Ad Pilot from Business up, and MMM and the Budget Optimizer on Custom. All plans include a 21-day free trial with no card.Reviews
4.97 out of 5 on G2. Reviewers keep pointing to purchases recovered server-side and budget talks that moved from revenue to margin; spend-linked cost is the repeated caveat. NATURTREU grew its BFCM budget 122% while ROAS rose 23%, and ESN grew paid social revenue 81% after switching to profit-led allocation.Bottom line
The ecommerce attribution pick for any store where the argument is about which number to trust. Admetrics settles it in margin and then acts on it; the trade-offs are spend-linked pricing and an automation layer still growing into its role.Northbeam
★4.5Best for: ecommerce brands whose media plan leans on YouTube, TikTok, Meta video and CTV, where much of the spend earns views rather than clicks.
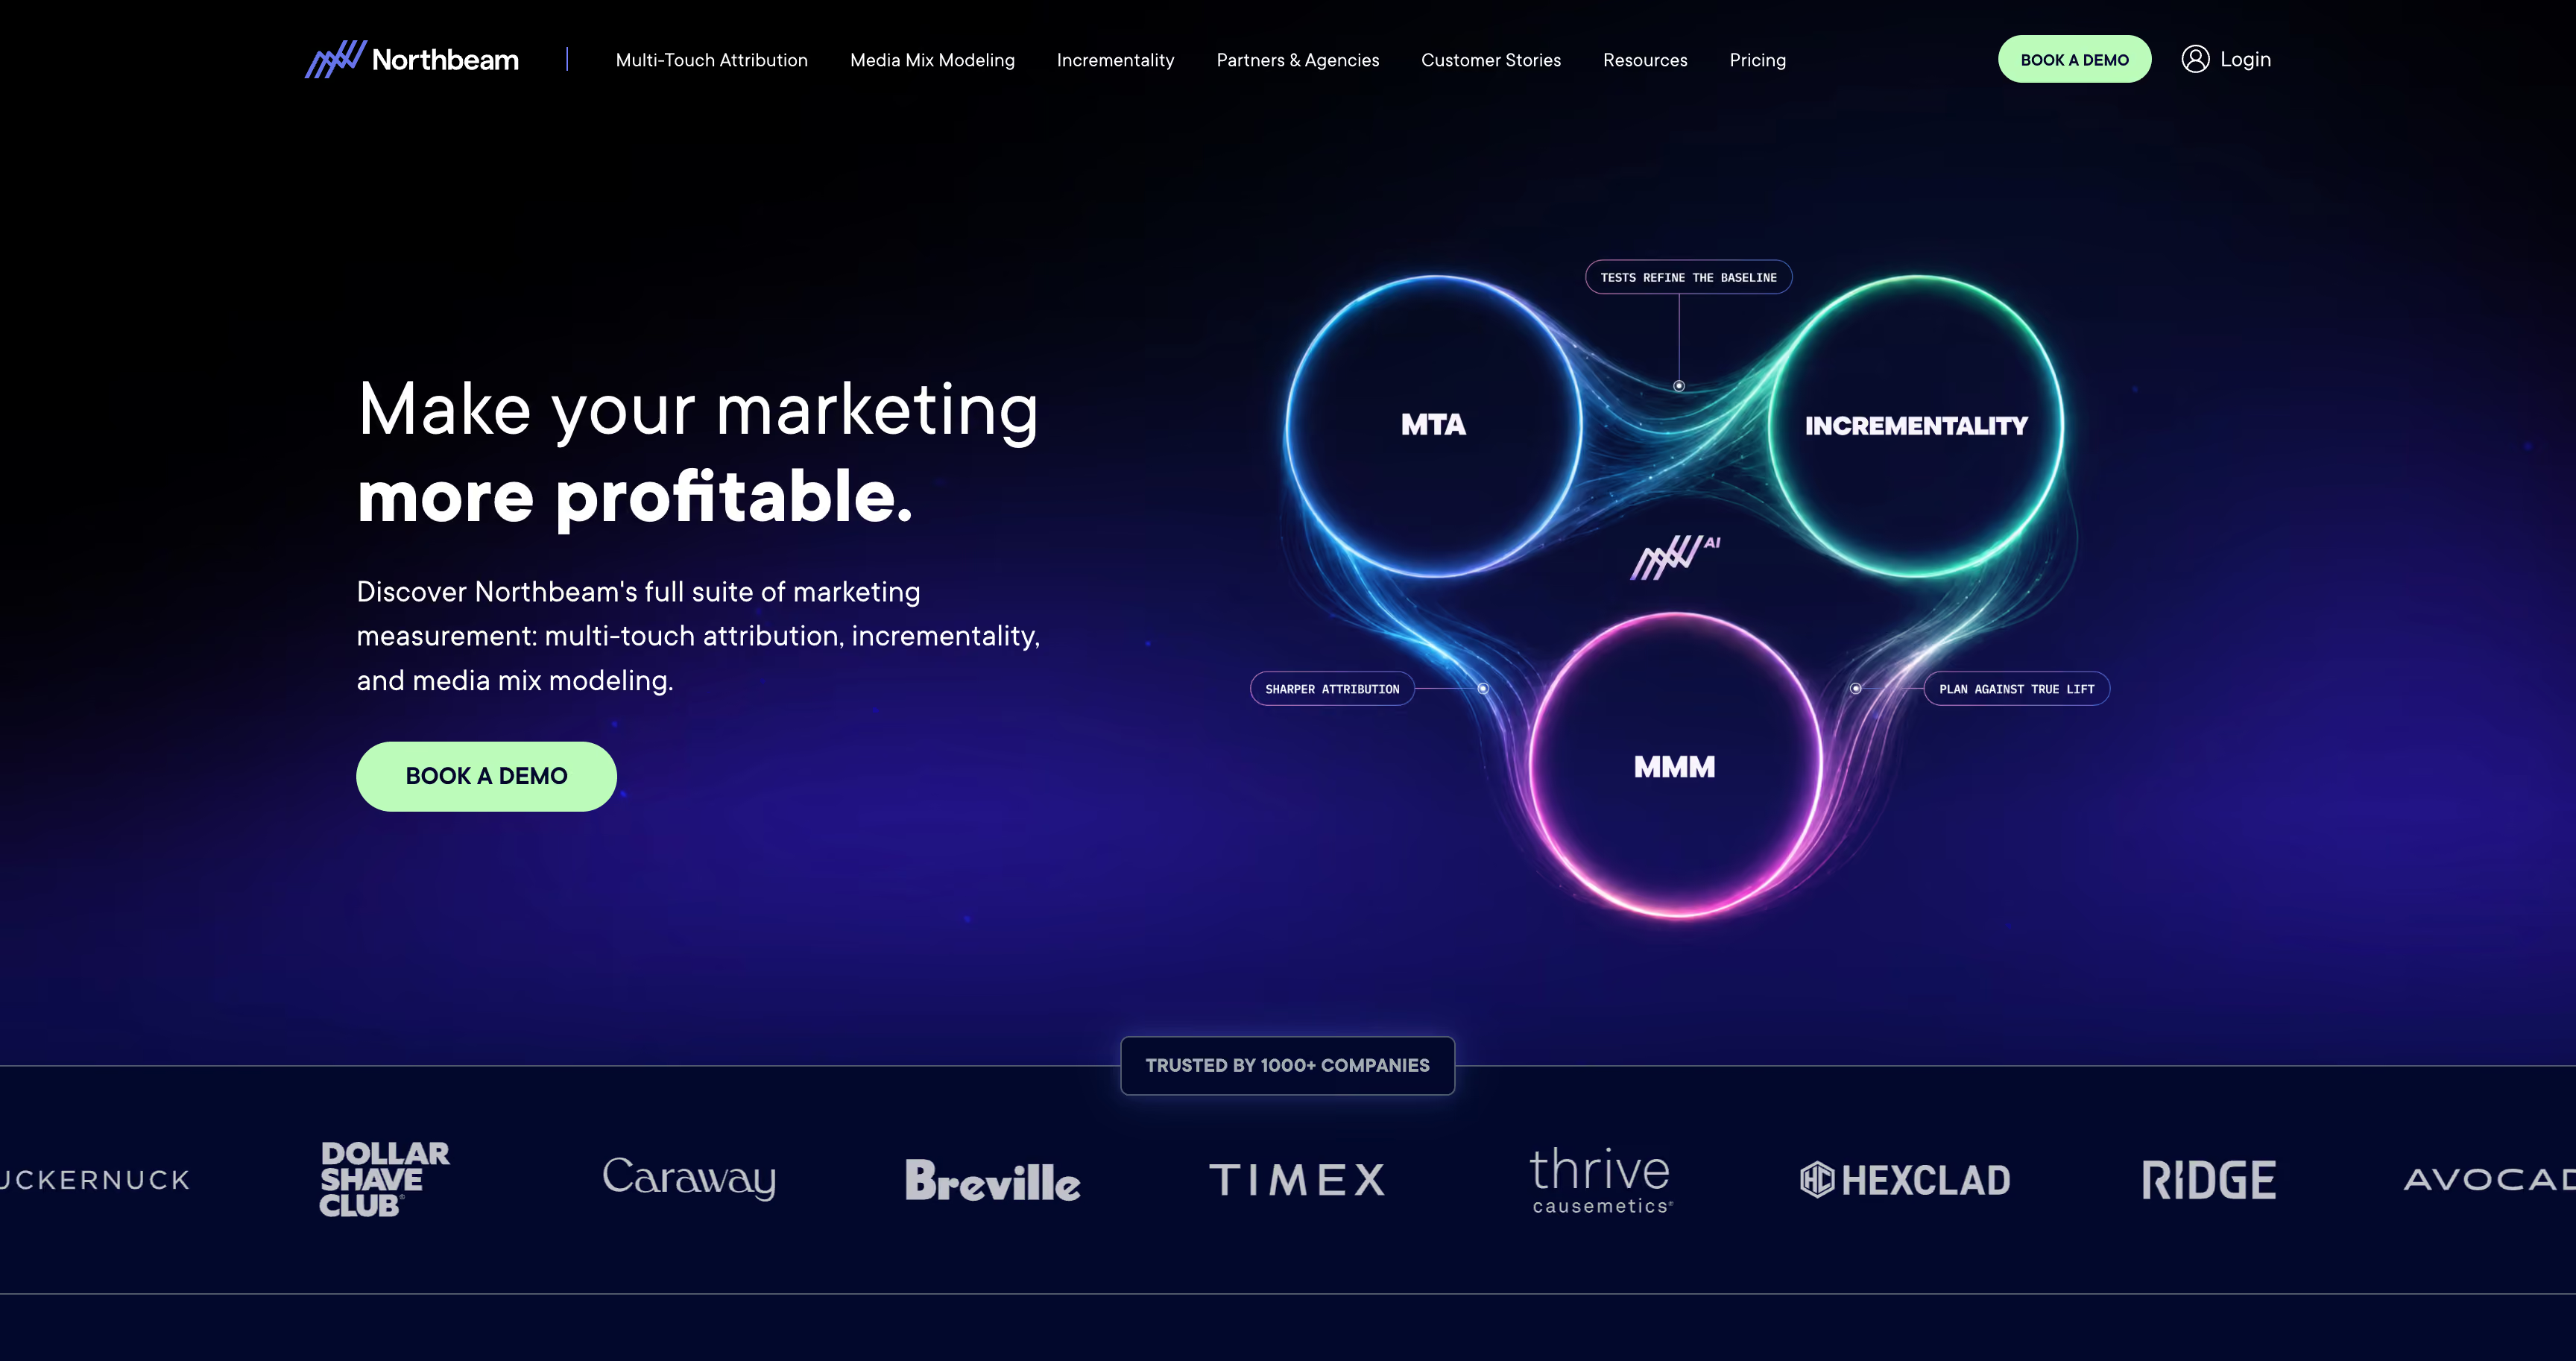
Ask a click-based tool what your YouTube campaign did and it will usually say: very little. Northbeam starts from the opposite assumption. Its Clicks + Deterministic Views model matches impressions verified by the ad platforms to actual orders, and MMM+, self-serve lift tests and Apex sit around it. The depth is real, and so is the expectation that someone will spend time inside it daily.
Key features
Strengths
Limitations
Pricing
Starter from $1,500 a month, billed on data volume. Professional (above $250K monthly spend) and Enterprise (above $500K) are quoted, and MMM+ costs extra. No free plan or trial.Reviews
Sixteen G2 reviews average 4.5. Praise returns to trust in the numbers; criticism focuses on ramp-up time and cost, rarely on the data.Bottom line
If the hardest question on your team is what video and CTV spend really does, Northbeam answers it better than anything here. Turning that answer into margin, and into a budget change, stays with you.Triple Whale
★4.5Best for: Shopify brands, typically below a few million in GMV, that want a working ecommerce attribution dashboard this week rather than after a data project.
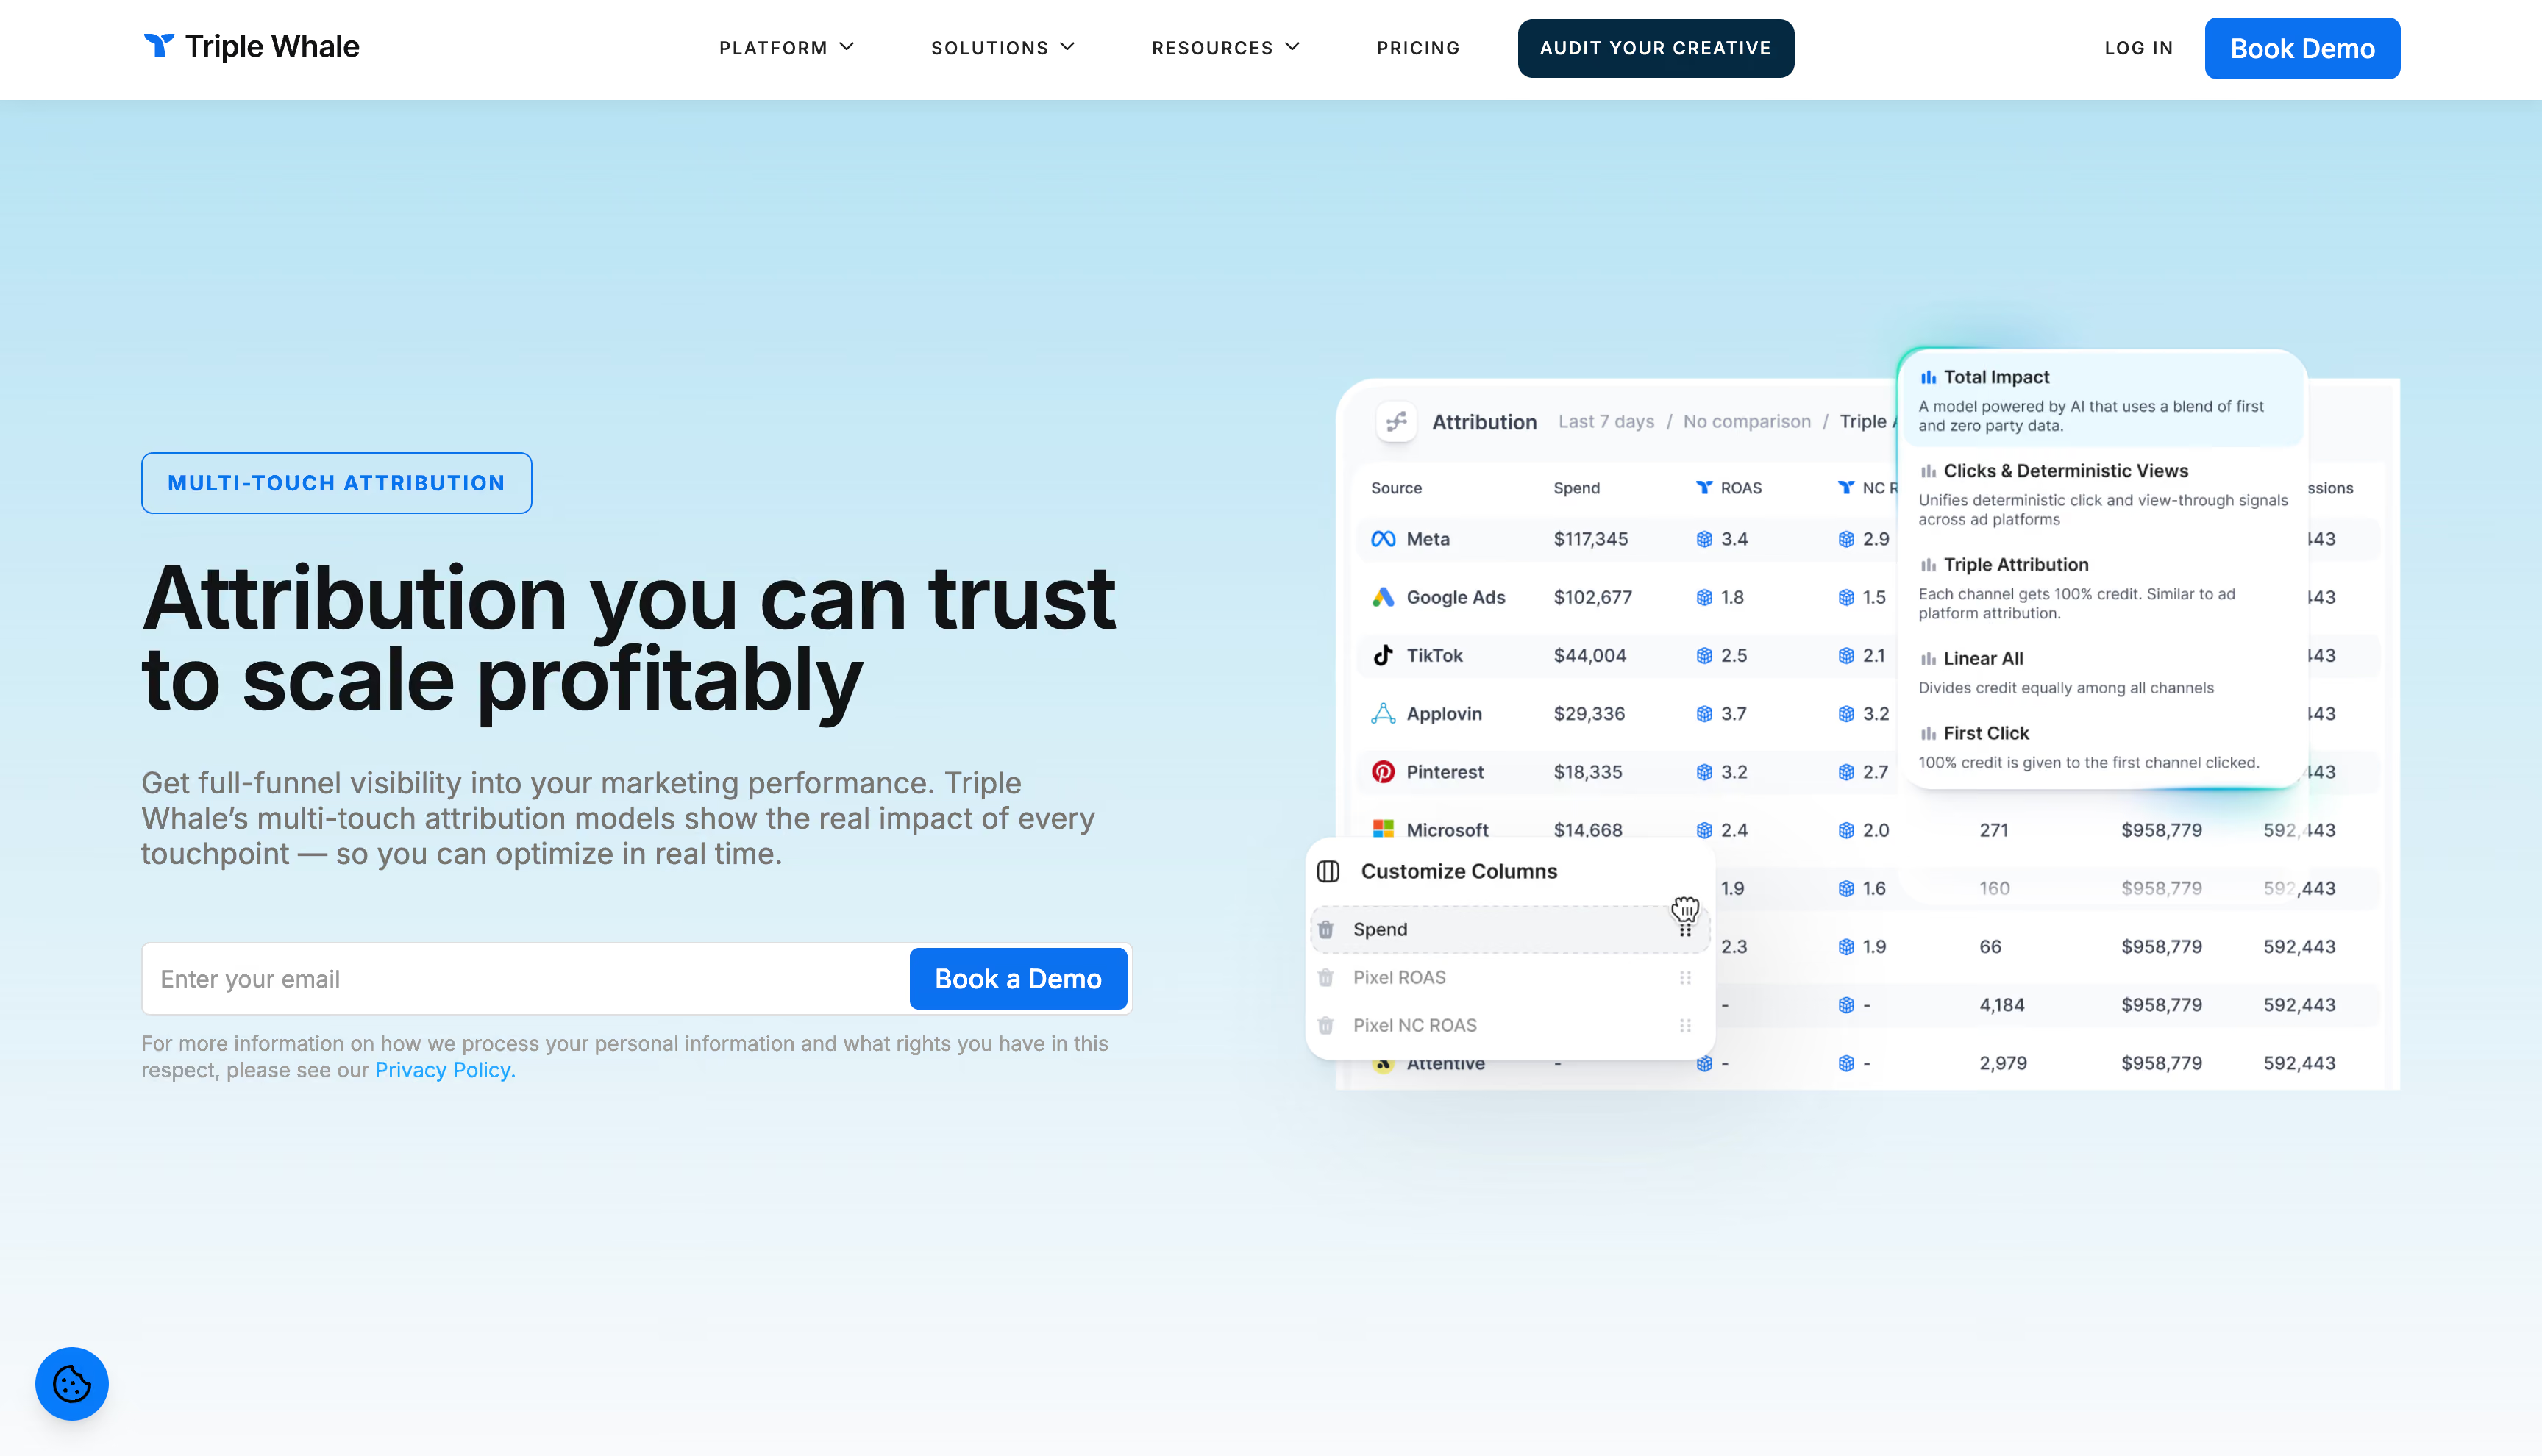
Most Shopify founders meet Triple Whale the same way: the free dashboard goes in on a Tuesday, and by Friday nobody has Ads Manager and Shopify open side by side anymore. Underneath sit the Triple Pixel, Sonar for sending conversions back to ad platforms, and Moby, which on the Automate plan can pause ads or shift budget within limits you approve.
Key features
Strengths
Limitations
Pricing
Free plan available. Foundation starts at $219 a month and Automate at $749 for stores under $250K GMV, rising with each revenue band on 12-month contracts. Enterprise is quoted.Reviews
Nearly 480 G2 reviews average 4.5, mostly from small businesses. Support and ease of use earn the credit; numbers that don't match other sources and cost that climbs with GMV draw the complaints.Bottom line
Pick it when getting the whole team onto one screen matters most. Revisit once returns, a second storefront or contribution margin start driving budget debates.Rockerbox
★4.6Best for: brands with a genuinely diversified media mix, including TV, CTV, podcasts or direct mail, that need one deduplicated dataset and a way to test what each channel caused.
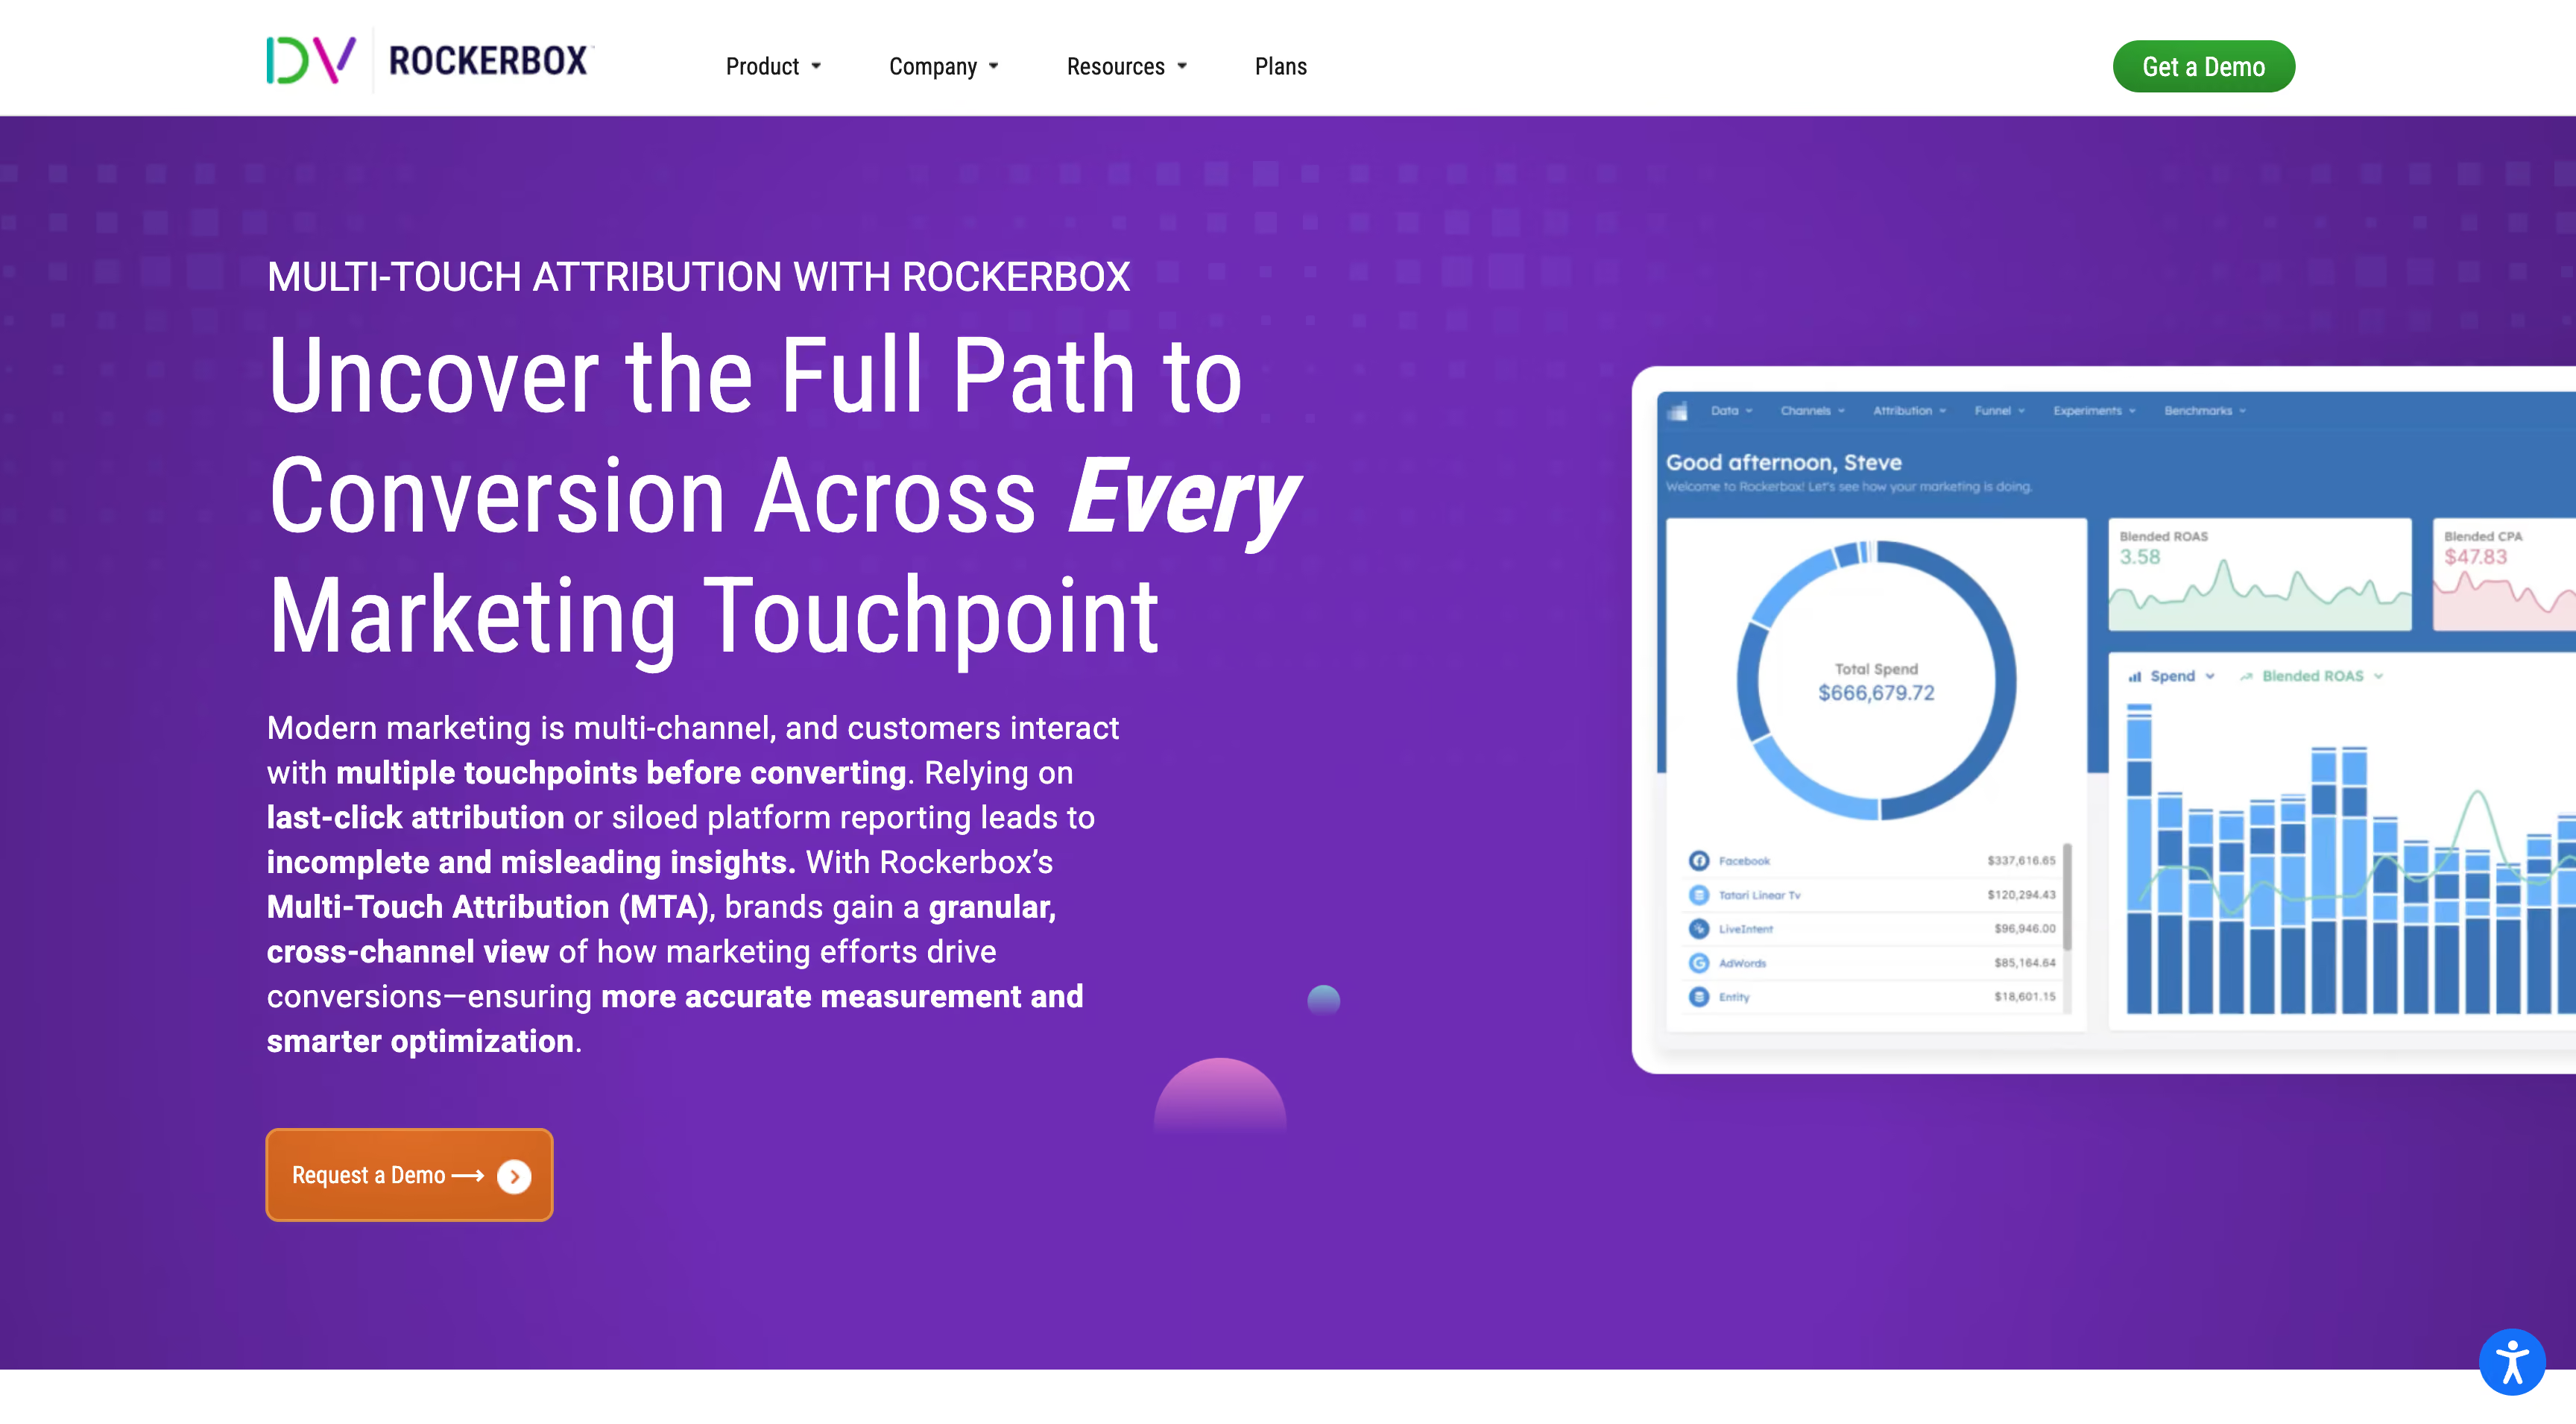
A brand running podcast reads, direct mail and CTV alongside Meta has a problem most click trackers can't touch: half its spend never produces a click. Rockerbox pulls 100+ online and offline channels into one deduplicated dataset, then runs MTA, MMM and incrementality tests on it. It's been part of DoubleVerify since February 2025, sold as DV Rockerbox.
Key features
Strengths
Limitations
Pricing
Custom quotes only. Third-party estimates start around $2,000 a month, with mid-market contracts of roughly $40,000 to $90,000 a year.Reviews
4.6 out of 5 across 47 G2 reviews. Praise centers on seeing online and offline channels together and responsive support; complaints cite a tedious setup and months of data before insights turn actionable.Bottom line
The right ecommerce attribution choice when offline and CTV are a real share of spend. It stops at revenue and leaves the profit math and budget moves to you.Polar Analytics
★4.6Best for: Shopify teams after ecommerce attribution on a warehouse they own, with contribution margin built in and a team willing to write the odd SQL query.
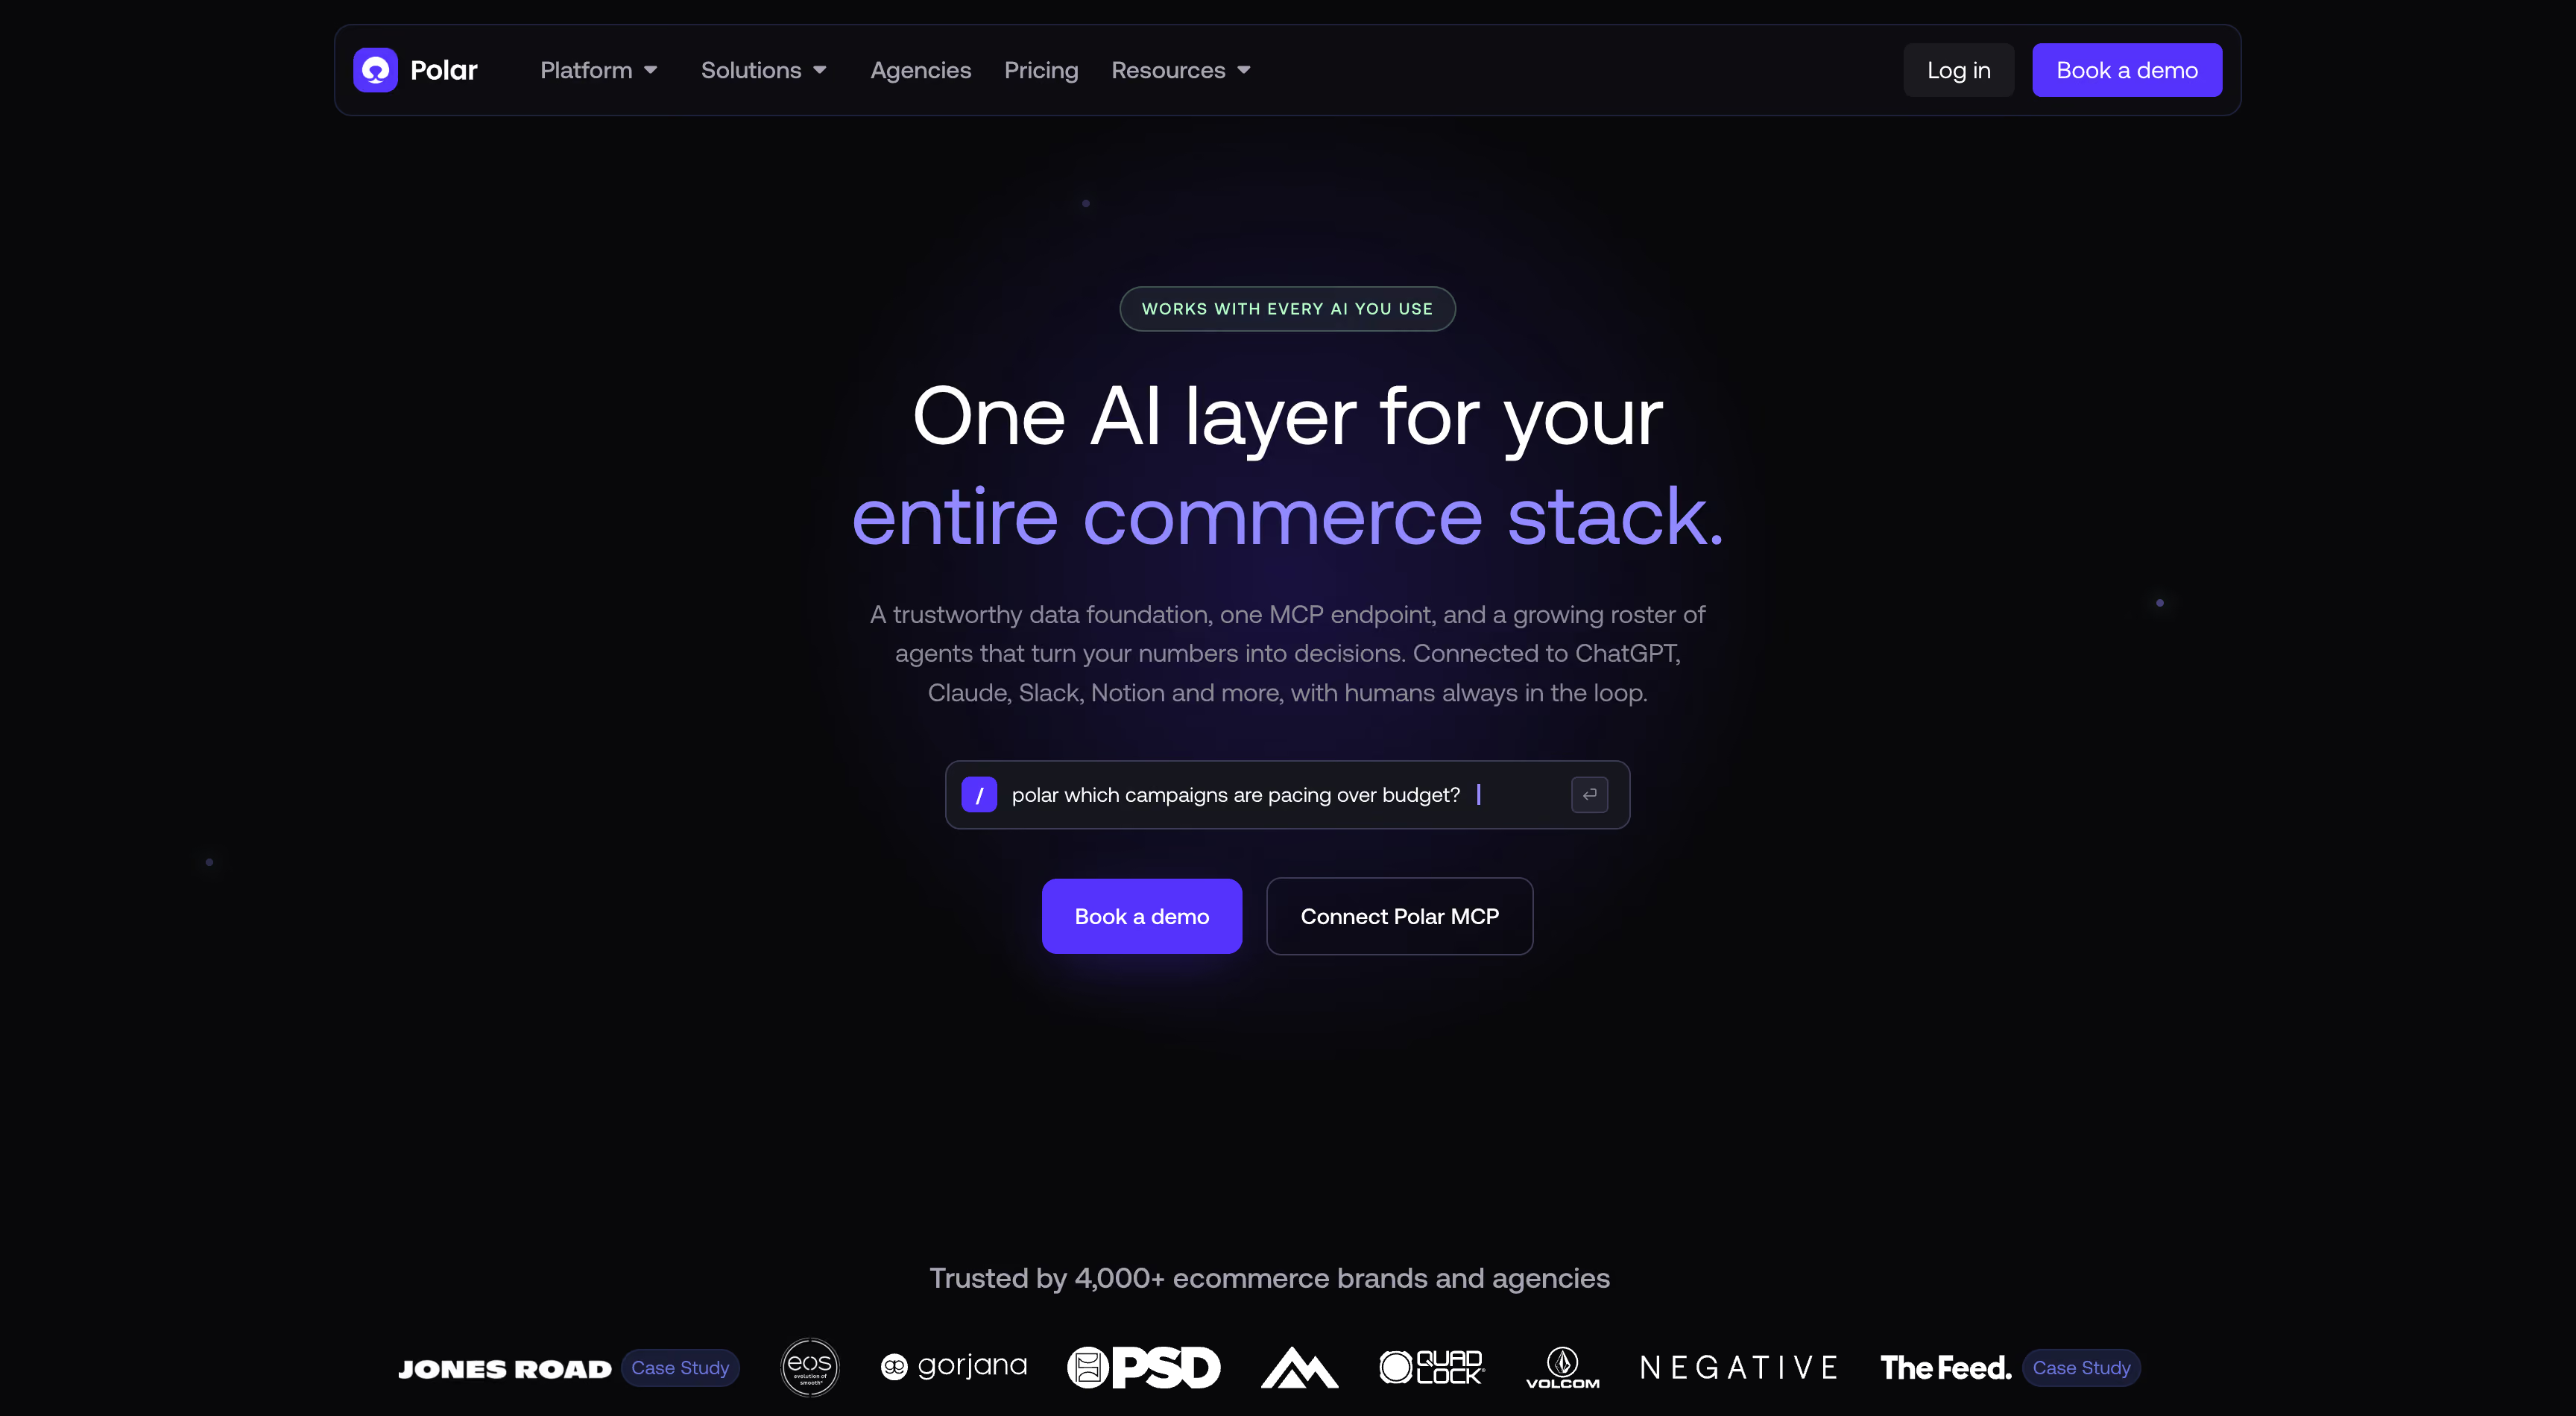
Plenty of brands outgrow their dashboard long before they outgrow their data. Polar's fix is structural: every customer gets a dedicated Snowflake database with 400+ pre-built ecommerce metrics, so dashboards, AI agents and analysts read from the same definitions, and attribution runs on top through Polar's own server-side pixel.
Key features
Strengths
Limitations
Pricing
GMV-based, from around $720 a month for the Core plan under $5M annual GMV, rising as revenue grows. No free plan, but a demo account is open without a sales call.Reviews
4.6 out of 5 on G2 from about 20 reviews, and 4.9 on the Shopify App Store. Support and ease of use come up most; connector glitches are the main complaint.Bottom line
The best pick for a data-literate Shopify team that wants margin-aware attribution on its own warehouse. Saturation modeling and budget moves stay with you.Hyros
★4.5Best for: high-ticket and funnel-driven sellers, where a buyer clicks an ad on Monday and pays after a sales call two weeks later.
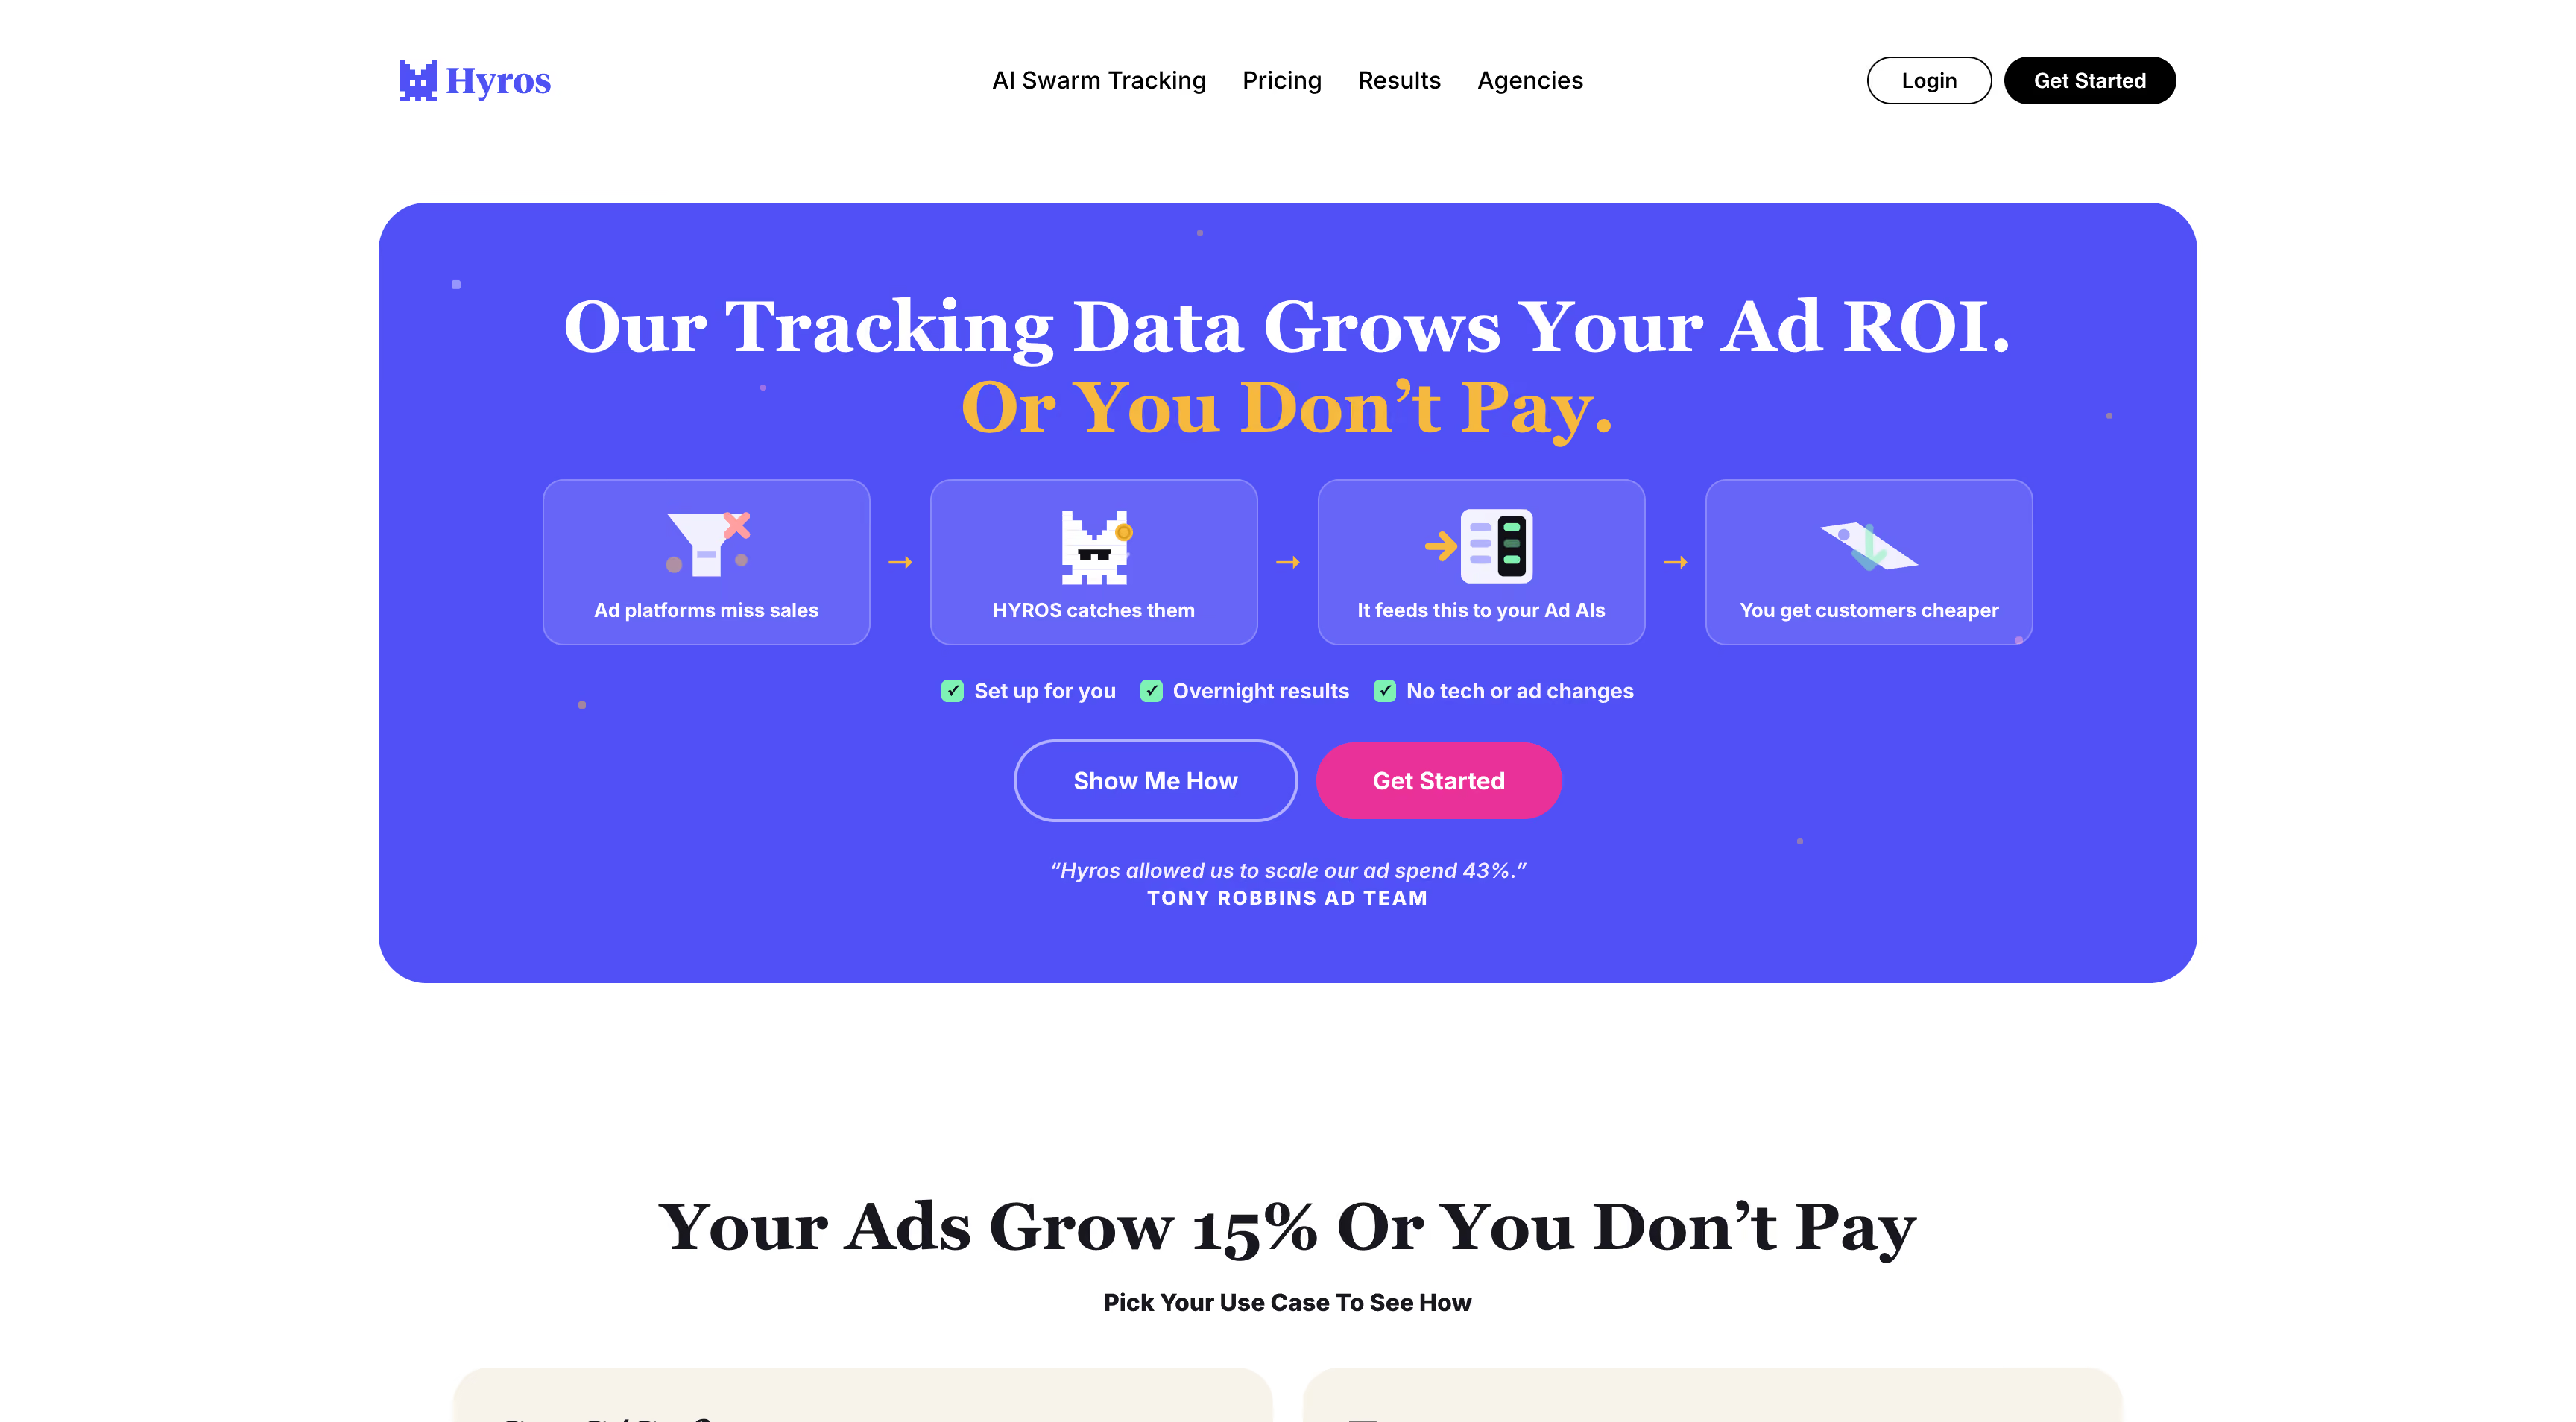
Hyros grew up on webinars and sales calls, not Shopify carts. Its patented Print Tracking stitches clicks, emails, phone numbers and devices into one identity, so a laptop purchase days later still lands on the phone ad that started it, and that recovered revenue is fed back to Meta and Google.
Key features
Strengths
Limitations
Pricing
Based on tracked monthly revenue. The Shopify track starts at $69 a month for $5K tracked; Business starts at $230 a month (annual) for $20K and climbs to roughly $1,499 at $750K. AIR bills around $0.10 per message.Reviews
Around 660 Trustpilot reviews with a near-perfect average, but little presence on G2. Praise centers on tracking depth and support; complaints cite rising cost, long setups and refund disputes.Bottom line
Excellent for tracing call-assisted journeys to the ad, but margin and SKU questions aren't what it was built for.Cometly
★4.5Best for: media buyers running heavy daily spend on Meta and Google who need cleaner conversion signals and one place to pause or scale ads.
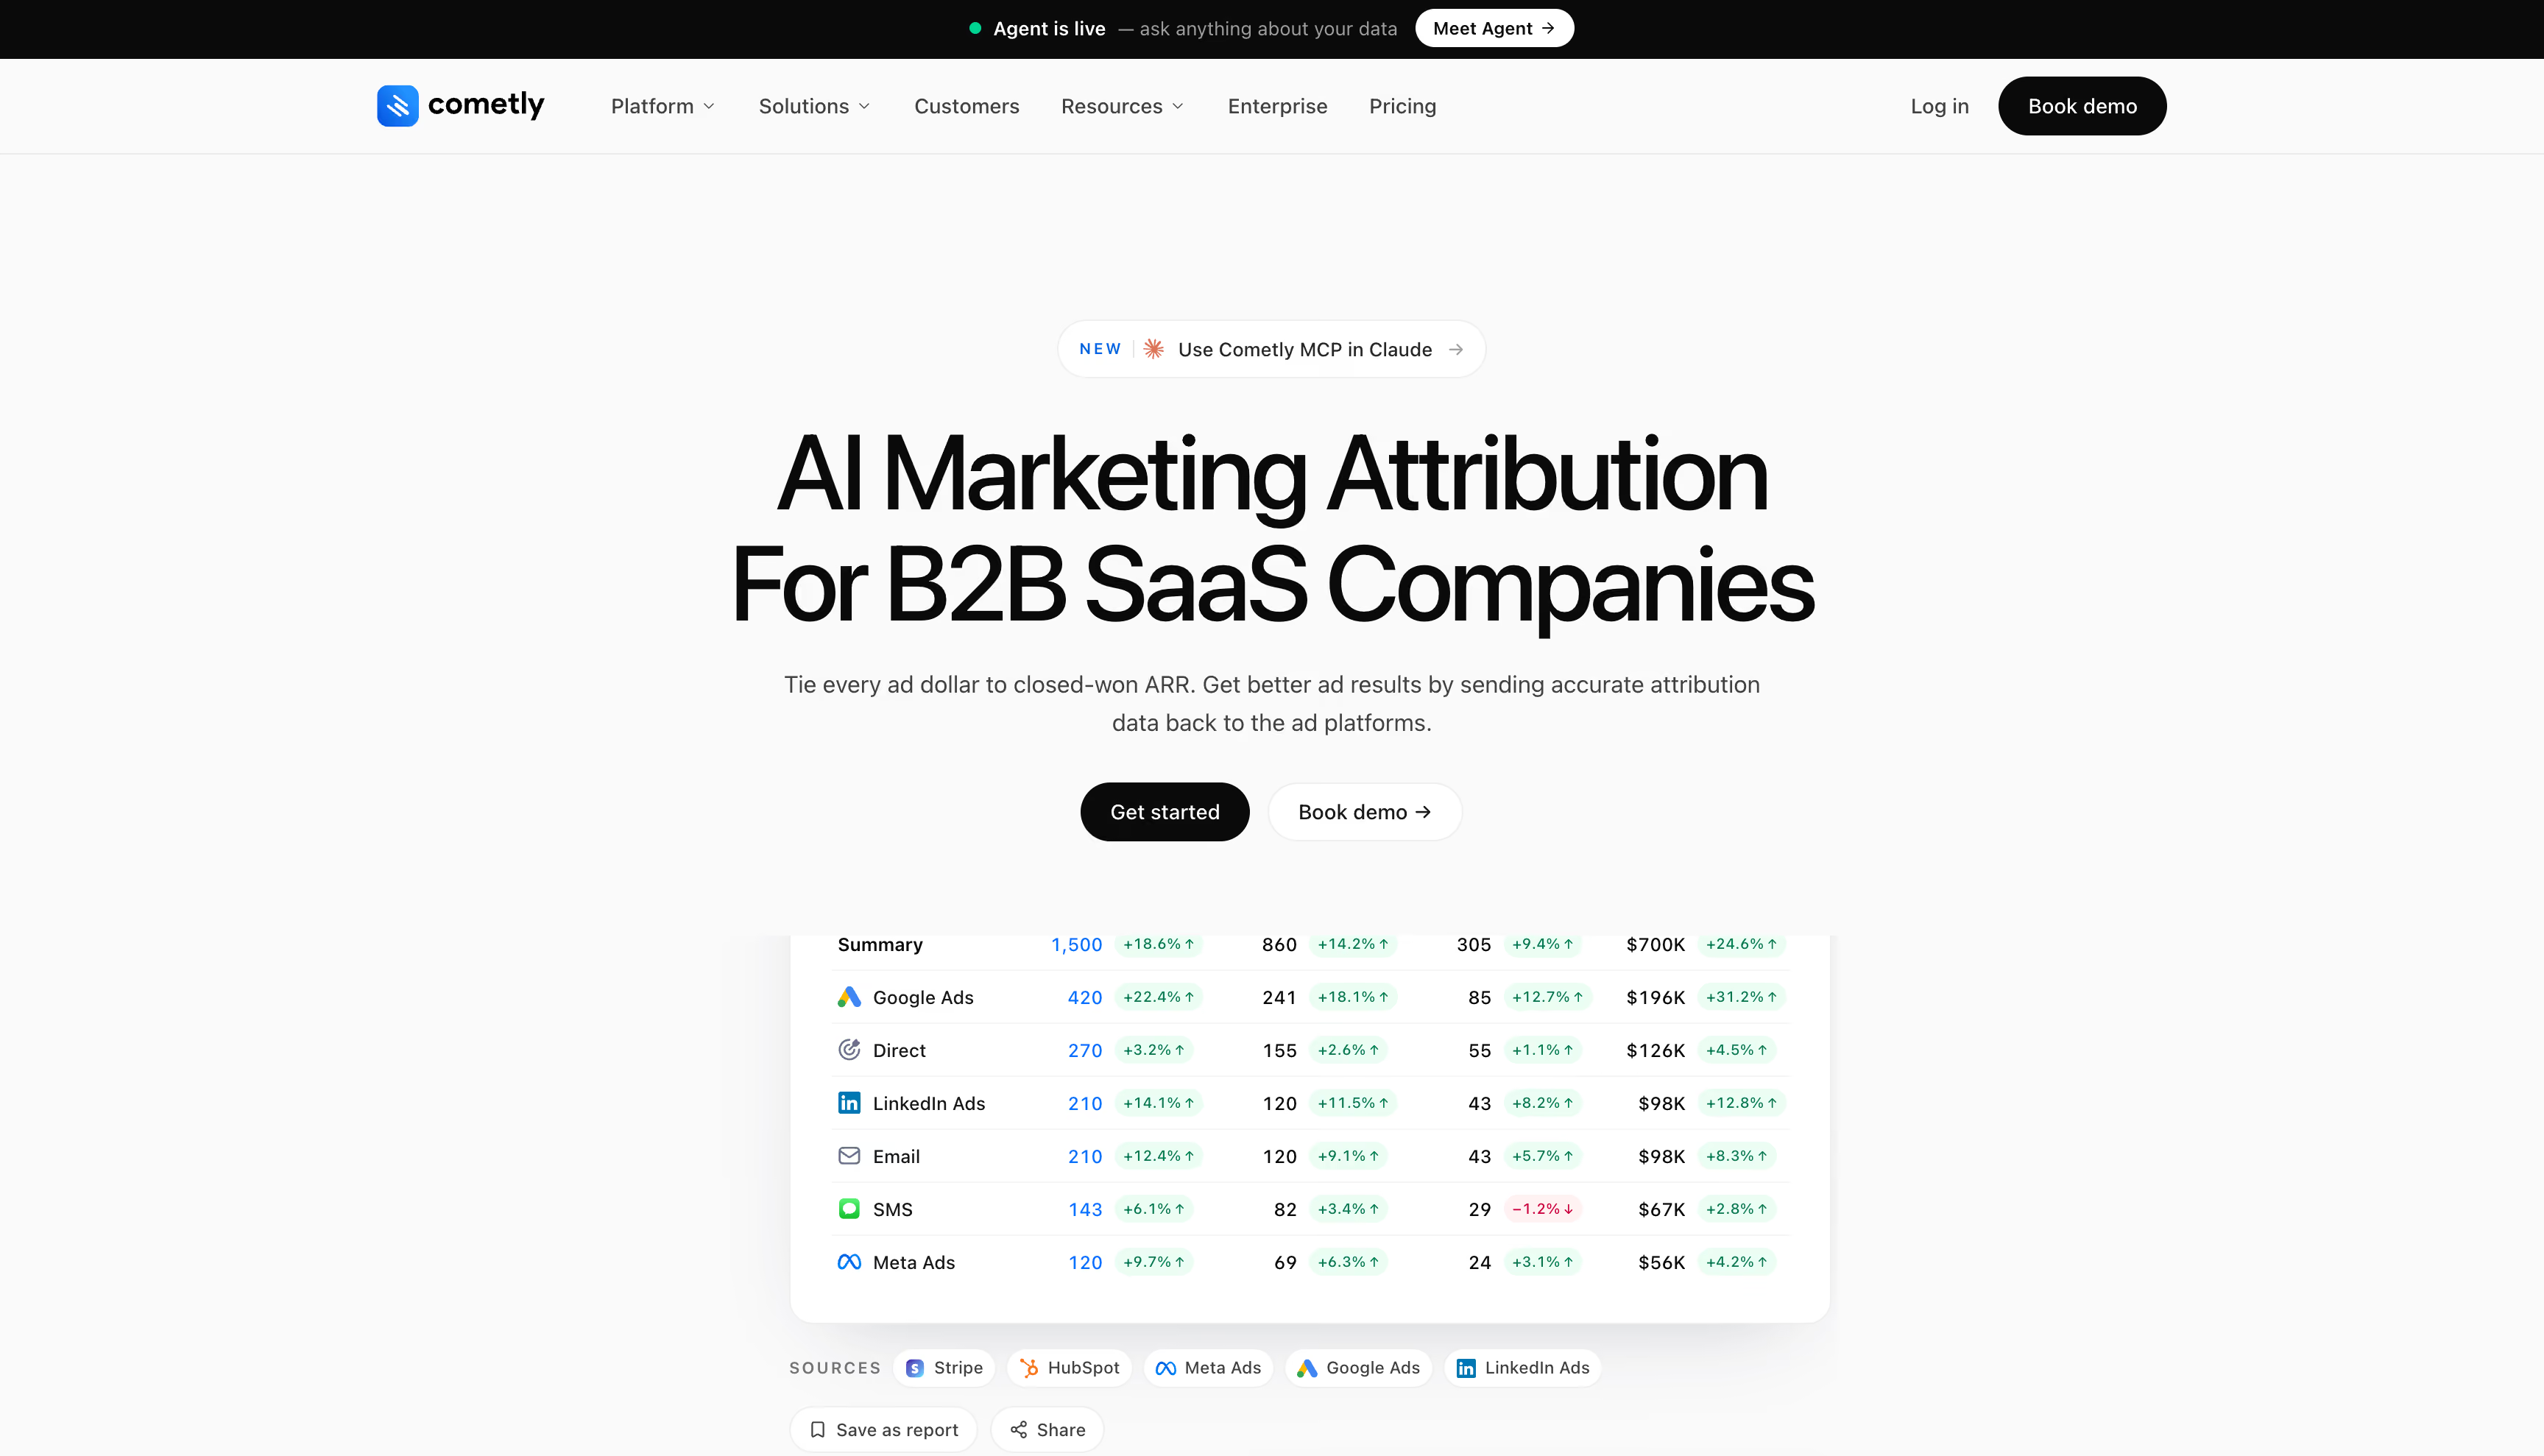
Cometly's core promise is signal quality. The Comet Pixel tracks visitors server-side, Conversion Sync pushes enriched events to seven ad networks, and the AI Ads Manager lets a buyer switch ads on or off and adjust budgets without hopping between accounts. The catch is direction: its messaging increasingly targets B2B SaaS pipelines, and the ecommerce side has stayed thin.
Key features
Strengths
Limitations
Pricing
Quoted through sales. Third-party trackers put Core near $750 a month for up to 50,000 sessions, climbing toward roughly $3,150 near a million, plus onboarding. Annual billing saves 20%.Reviews
Trustpilot skews strongly positive, mostly from media buyers crediting better match scores. Some users report slow support on technical issues, and price relative to scope recurs.Bottom line
A strong signal and action tool for Meta-heavy buyers. It won't tell you whether the revenue you scaled was profitable.Fospha
★4.5Best for: scaling ecommerce brands with heavy upper-funnel spend on TikTok, YouTube or CTV, and a real Amazon or TikTok Shop business.
Every click-based tool here shares a blind spot: the TikTok video someone watched on Tuesday doesn't exist unless they tap it. Fospha's answer to ecommerce attribution skips user tracking entirely. It runs an always-on Bayesian mix model that refreshes daily and still reports down to the ad, which makes it strong for planning and weak wherever you need a per-customer view.
Key features
Strengths
Limitations
Pricing
Sales-led. Third-party sources put Lite near $1,500 a month, Pro at $2,000 plus a share of media spend, and Enterprise as custom.Reviews
4.5 out of 5 across 51 G2 reviews, mostly mid-market. Fast setup, support and saturation curves earn praise; a clunky dashboard and a hard-to-inspect model draw complaints.Bottom line
The right pick when upper-funnel and marketplace spend are what you can't measure. It won't show profit, and it won't show a customer.Wicked Reports
★4.2Best for: subscription and repeat-purchase brands on Klaviyo, ReCharge or a CRM that need to know what a customer from each ad is worth after 6 or 12 months.
A Meta campaign that looks mediocre at a 7-day ROAS can be your best acquisition channel once its customers have reordered four times. Wicked Reports is one of the older independent tools here, built around that gap: it joins ad clicks to email opt-ins, CRM records and subscription orders, then follows each customer's revenue long after the first purchase.
Key features
Strengths
Limitations
Pricing
By trailing 12-month revenue. Measure is $499 a month under $2.5M, Scale $699 and Maximize $999, with Enterprise from $4,999. Advanced Signal and 5 Forces AI cost $199 a month each below Maximize.Reviews
4.2 out of 5 across 27 G2 reviews, mostly small businesses. Reviewers value multiple attribution views and long tracking windows; navigation and load times are the recurring complaints.Bottom line
The most useful LTV-by-campaign view here for subscription brands. It stops at revenue and leaves the budget moves to you.AdBeacon
★4.5Best for: Meta-heavy brands and agencies that want click-verified ecommerce attribution they can audit order by order, delivered inside Ads Manager.
Every media buyer knows the moment: Ads Manager says a campaign returned 3x, the store says it barely broke even, and nobody can show which orders the platform counted. AdBeacon ties each sale to the click behind it with its own first-party pixel, and a Chrome extension overlays that data directly on Meta Ads Manager, right where the buyer makes the change.
Key features
Strengths
Limitations
Pricing
By monthly tracked revenue, from around $299 a month for up to $50K tracked, per third-party sources. Annual plans lock in a fixed price, and new customers start with a 30-day pilot.Reviews
Only a small number on Capterra and G2, praising transparent tracking, responsive support and the time the Meta extension saves.Bottom line
An affordable pick for Meta-first teams that want verifiable click attribution in the tool they already use. It sees only clicks and stops short of profit and cross-channel budget moves.Final verdict: the best ecommerce attribution tools for 2026
Every tool on this list measures something real. What separates them is what happens next: whether the number is priced in profit, and whether it turns into a budget change or sits in a dashboard waiting for someone to act.
Admetrics is the only platform here that does all of it on the number finance cares about. It tracks server-side and feeds recovered conversions to six ad networks, prices every channel in contribution margin with returns broken out by campaign and SKU, models saturation with PRISM4, and executes the resulting budget moves through Ad Pilot. That's why it's our pick for the best attribution tool for DTC brands in 2026.
The others win specific jobs. Northbeam measures view-through better than anyone here. Rockerbox is the pick when offline media is a real share of spend, and Fospha when upper-funnel video and Amazon are. Polar gives analysts a warehouse they own. Triple Whale and Cometly act quickly, just on revenue. Wicked Reports reads subscription LTV, Hyros tracks calls, and AdBeacon puts auditable numbers inside Meta.
If your store ships physical products and paid media is a real line in your P&L, start a 21-day Admetrics trial against your live data and see whether the profit view changes which campaigns you'd scale this Q4.