
Your Black Friday campaign closed at 6x ROAS, so you poured December budget into the same ads. Then January arrived with the returns. Almost a quarter of those orders came back, the rest shipped with a 30% discount code, and the campaign you scaled hardest turned out to be the least profitable of the quarter.
Nothing in that story was a tracking error. The clicks were real and so were the orders. The ecommerce attribution layer failed: it credited revenue correctly but priced it wrong, and nobody saw the gap until the refunds cleared. With Q4 weeks away, that's the mistake worth fixing first.
This guide compares 10 ecommerce attribution tools on what they track, what they can prove, whether they count profit, and whether anything happens after the report loads. We build one of them, so the method comes first and every competitor gets the same checklist.
Key takeaways
What is ecommerce attribution?
Ecommerce attribution is the method an online store uses to decide which ads, channels and touchpoints earned credit for each order, and therefore where the next dollar of ad spend should go. It connects spend on one side to orders on the other, then splits the credit across everything the buyer saw in between.
That split is where brands disagree. A typical DTC purchase might pass through a TikTok video, two Meta retargeting ads, a Klaviyo email and a branded Google search over two or three weeks. Each ad platform will happily claim the whole order. Your store will record it once. Attribution is the referee between those two views.
There are four main ecommerce attribution methods, and they answer different questions:
The strongest setups combine at least two of these and use one to check the other.
Ecommerce attribution models: which one fits a DTC brand?
Ecommerce attribution models are the rules that decide how credit gets split across a journey. Pick a different model and your "best" channel changes, which is why the choice matters more than it looks.
Single-touch models give one touchpoint 100% of the credit. Last click rewards whatever came right before checkout, usually branded search, retargeting or email. First click rewards whatever introduced the buyer. Both are easy to read and wrong in a predictable direction.
Rule-based multi-touch models split credit by position. Linear gives every touch an equal share. Time decay leans toward the most recent touches. Position-based (U-shaped) gives the most weight to the first and last touches and divides the rest across the middle. They're better than single-touch, but the weights are someone's assumption, not a measurement.
Data-driven models learn the weights from your own conversion paths, comparing journeys that converted with ones that didn't. They're the most accurate option once you have volume, and the hardest to explain to a CFO.
So what's the best attribution model for DTC ecommerce? For most brands spending across three or more channels, it's a data-driven multi-touch model, checked against MMM or a periodic lift test, with last click kept open in a second tab as a sanity check. A few DTC best practices make any model more honest:
A measurement is worth the decision it changes
The fourth criterion is quicker to explain and much harder to satisfy. A measurement is worth precisely the decision it changes.
Most of this category ends at a well-designed dashboard, which means the last mile still runs through a person, a spreadsheet and whatever attention is left on a Friday afternoon.
A recommendation isn't an action.
Moving a budget is: a cross-channel allocation the platform produces and can execute inside limits you set, logged and reversible if it gets it wrong.
That's the question to put to every vendor: how many ad networks receive the enriched conversions? On this list the answers vary widely. Cometly sends to seven networks and Admetrics to six. Polar sends to Meta and Google. Wicked Reports covers Meta only, as an add-on on its lower plans, and Fospha doesn't track users at all. A tool that recovers conversions but keeps them in a dashboard fixes your report and leaves your ad delivery exactly where it was.
How the best tools measure marketing performance: MTA, MMM, and the next dollar
Multi-touch attribution tells you Meta prospecting earned 18% of last month's tracked conversions. Useful — until you remember what "tracked" leaves out: the CTV spot with no click, the podcast heard in the car, the point where Meta stopped returning anything and you kept spending. MTA only divides credit among the touchpoints it recorded. That's the ceiling of every multi-touch model: a click-level lens, right for the daily question — which campaign or creative is pulling weight in your trackable mix, which the best multi-touch attribution tools answer well. What it can't answer is the question that sets your budget: is the next dollar into this channel still worth spending?
Marketing mix modeling works from the other end, modeling spend against outcomes in aggregate — catching what MTA misses (offline, upper-funnel, brand) and where each channel saturates. Neither replaces the other: MTA is your performance attribution tool for the week, MMM the marketing performance measurement layer for the quarter and the marginal call. The tools worth paying for run both — the lens we used to rank them.
Profit on ad spend (POAS) makes that visible by dividing contribution margin, not revenue, by spend. It needs data most attribution tools never collect: product costs, shipping, transaction fees, discounts and, above all, returns by campaign and SKU. That's the dividing line in this category. A few tools here get to gross margin, two reach contribution margin, and only one breaks out returns by campaign and product.
How we scored these marketing intelligence tools
The ranking runs on four criteria, applied in the weighted order below.
Scores draw on hands-on use, official product documentation and 2026 release notes, published rate cards and aggregated procurement data, and verified reviews on G2, Capterra and Trustpilot. Where a product's marketing claims and its observed behavior parted company, the behavior set the score.
Which is why our order differs from rankings you may have just read. Crayon is a Gartner Leader and sits top-three on several competitor lists, and it ranks ninth here because three of our four criteria measure things it never set out to do. One disclosure while we're being precise about bias: Admetrics publishes this guide and ranks first in it. Every competitor entry is sourced from that vendor's own documentation and public reviews, and the Admetrics entry carries its real limitations, including which capabilities sit behind add-ons.
Quick comparison: the best marketing intelligence tools in 2026
Admetrics
★4.97Best for: ecommerce and DTC operators who want marketing intelligence priced in contribution margin, and wired straight to the budget decision that follows from it.
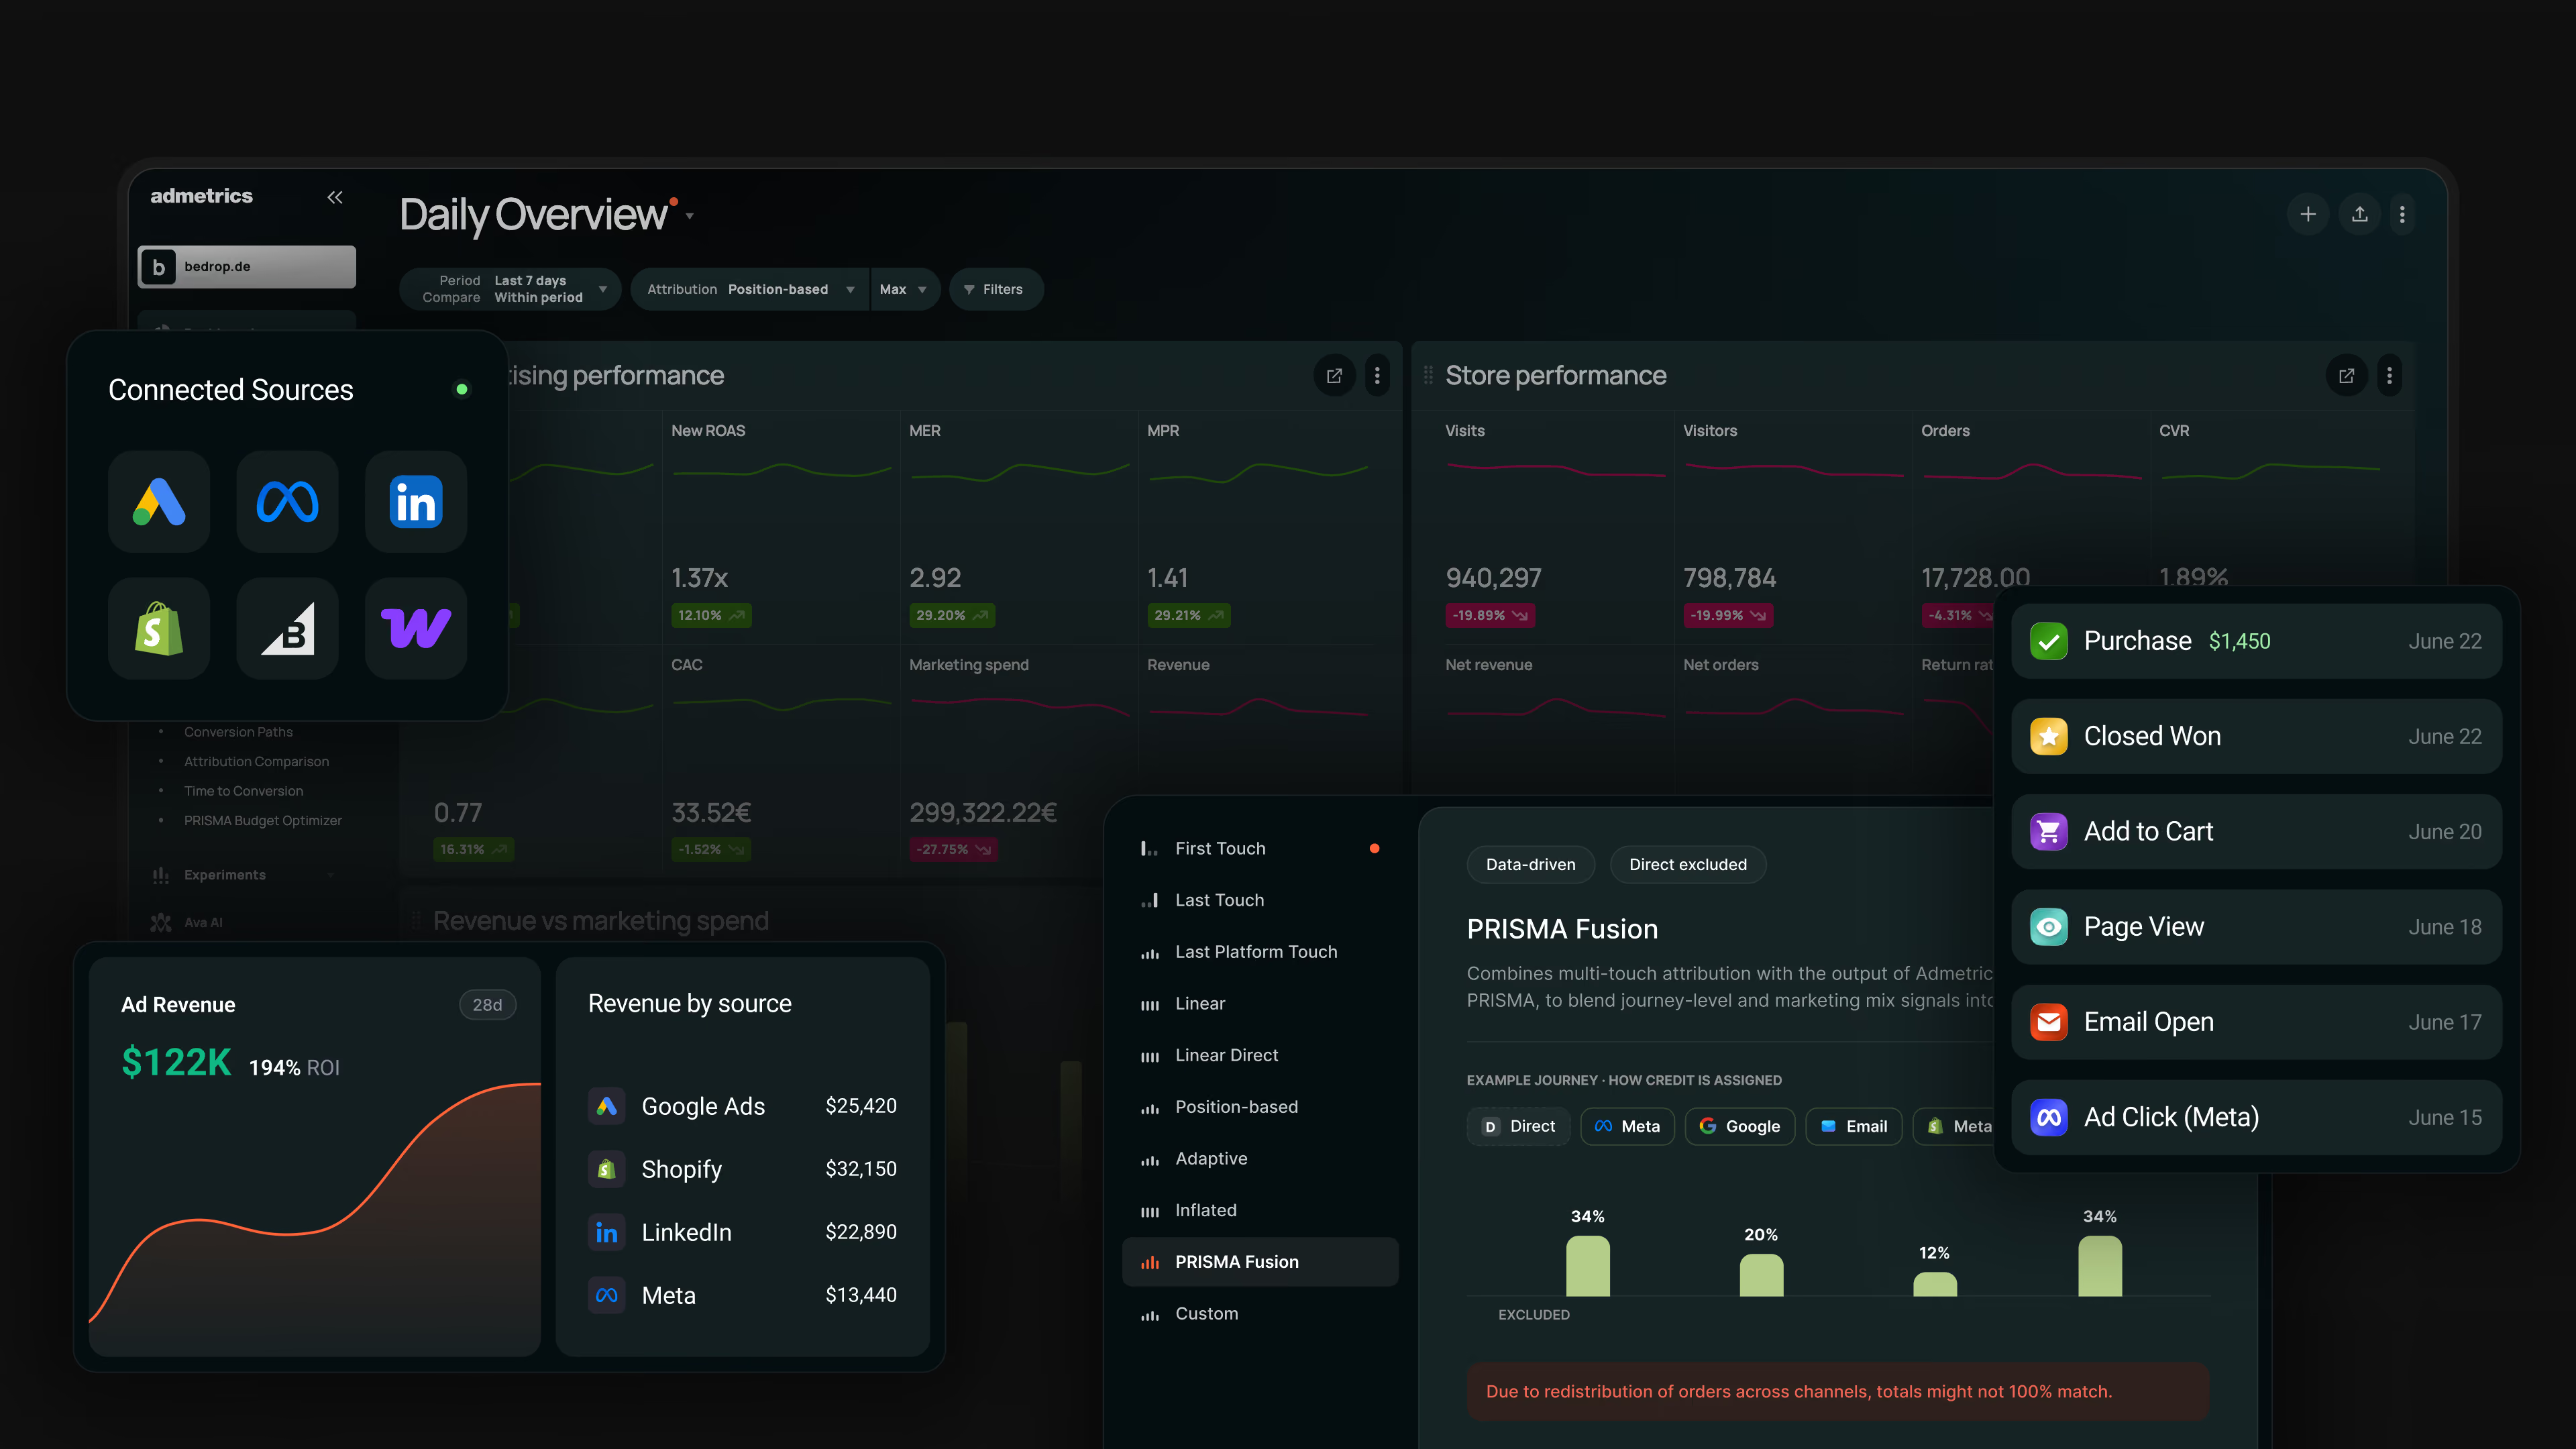
Most of the tools filed under marketing intelligence spend their time watching other companies. Admetrics watches yours. When you sell physical products, the intelligence that changes a decision isn't what a rival put on their pricing page last week. It's which of your own campaigns produced a customer still worth having once cost of goods, shipping, fees and returns came out. So the product is a loop rather than a dashboard: connect, measure, analyze, then move the budget. Marketing Intelligence is one module inside that system rather than the whole of it, and that's the tell. The reporting exists to feed an allocation.
Key features
Strengths
Limitations
Pricing
Billing follows monthly ad spend rather than headcount. Growth is €339/month and covers €20,000 of spend, then 1.5% above it. Business is €764 and covers €70,000, then 1%. Custom starts at €1,100. Annual terms cut 15%, and every plan carries a 21-day trial with no card.Reviews
G2 reviewers average the platform at 4.97, and the pattern behind that score is consistent: tracking that survives inspection, support that doesn't stop at onboarding. The case studies are unusually specific too, among them a 220% lift in new-customer ROAS at Freiluftkind.Bottom line
The only tool here where marketing intelligence ends in a budget change rather than a slide. If you sell physical products and the weekly question is which euro to move, start here. If the question is what your competitors are up to, this is the wrong shelf.Improvado
★4.5Best for: enterprise and agency teams running dozens of channels who need the data layer unified and governed before anyone argues about whose number is right.
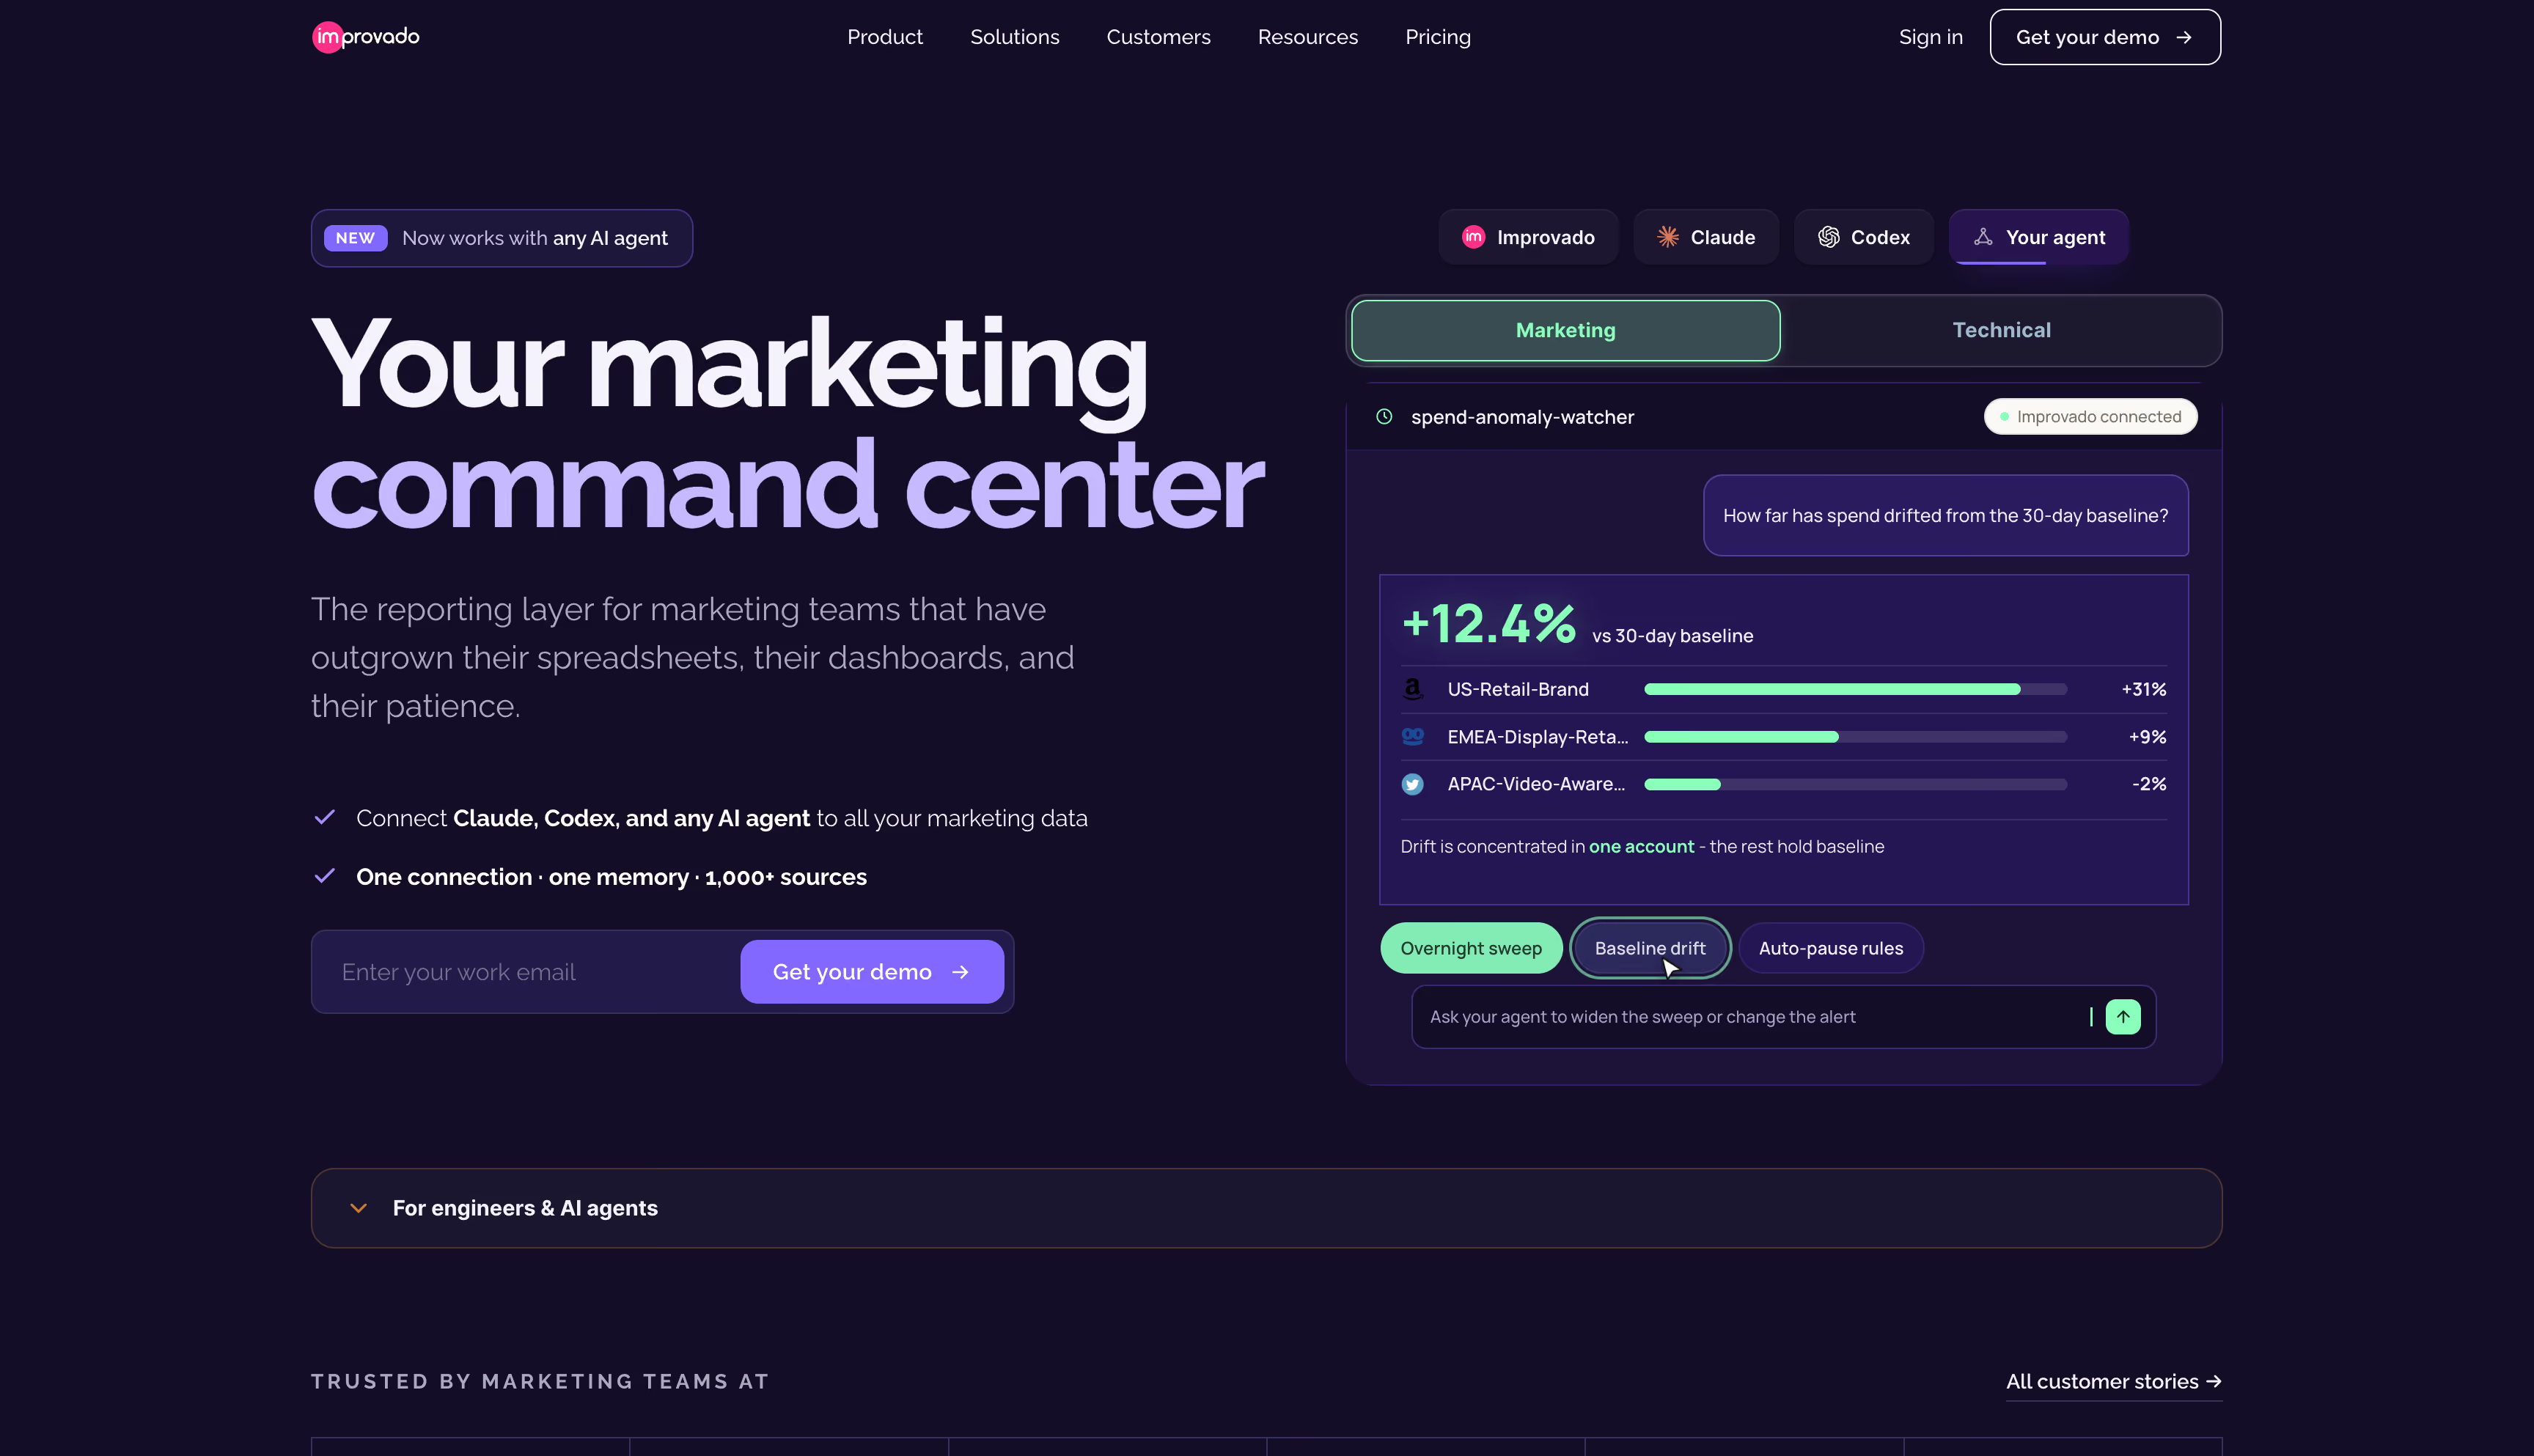
Improvado is the incumbent among marketing intelligence platforms, and it ranks itself first on its own guide to the category. On one axis that's defensible: nobody here moves marketing data better. It pulls from 500+ sources, harmonizes the schemas, lands everything in your warehouse and hands it to Tableau, Looker or Power BI. What separates it from a plain ETL vendor is governance, because it watches your campaigns against your own rules instead of just moving rows.
Key features
Strengths
Limitations
Pricing
Quote-based, scaled on data volume, source count and transformation complexity rather than seats. No public rate card, no free tier. Procurement data puts a typical mid-market contract near $3,000/month before add-ons.Reviews
Ratings sit near 4.5 on G2 and Capterra, and the praise is operational rather than analytical: support quality, and manual reporting work disappearing. The case studies lead with engineering hours saved rather than revenue moved.Bottom line
Buy Improvado when the problem is forty data sources and no dataset anyone trusts. It won't tell you which campaign earned money after returns, and it won't spend the next dollar for you.Triple Whale
★4.3Best for: Shopify and Shopify Plus brands that want marketing intelligence, peer benchmarks and agents that act inside one product, and can live with their data sitting in the US.
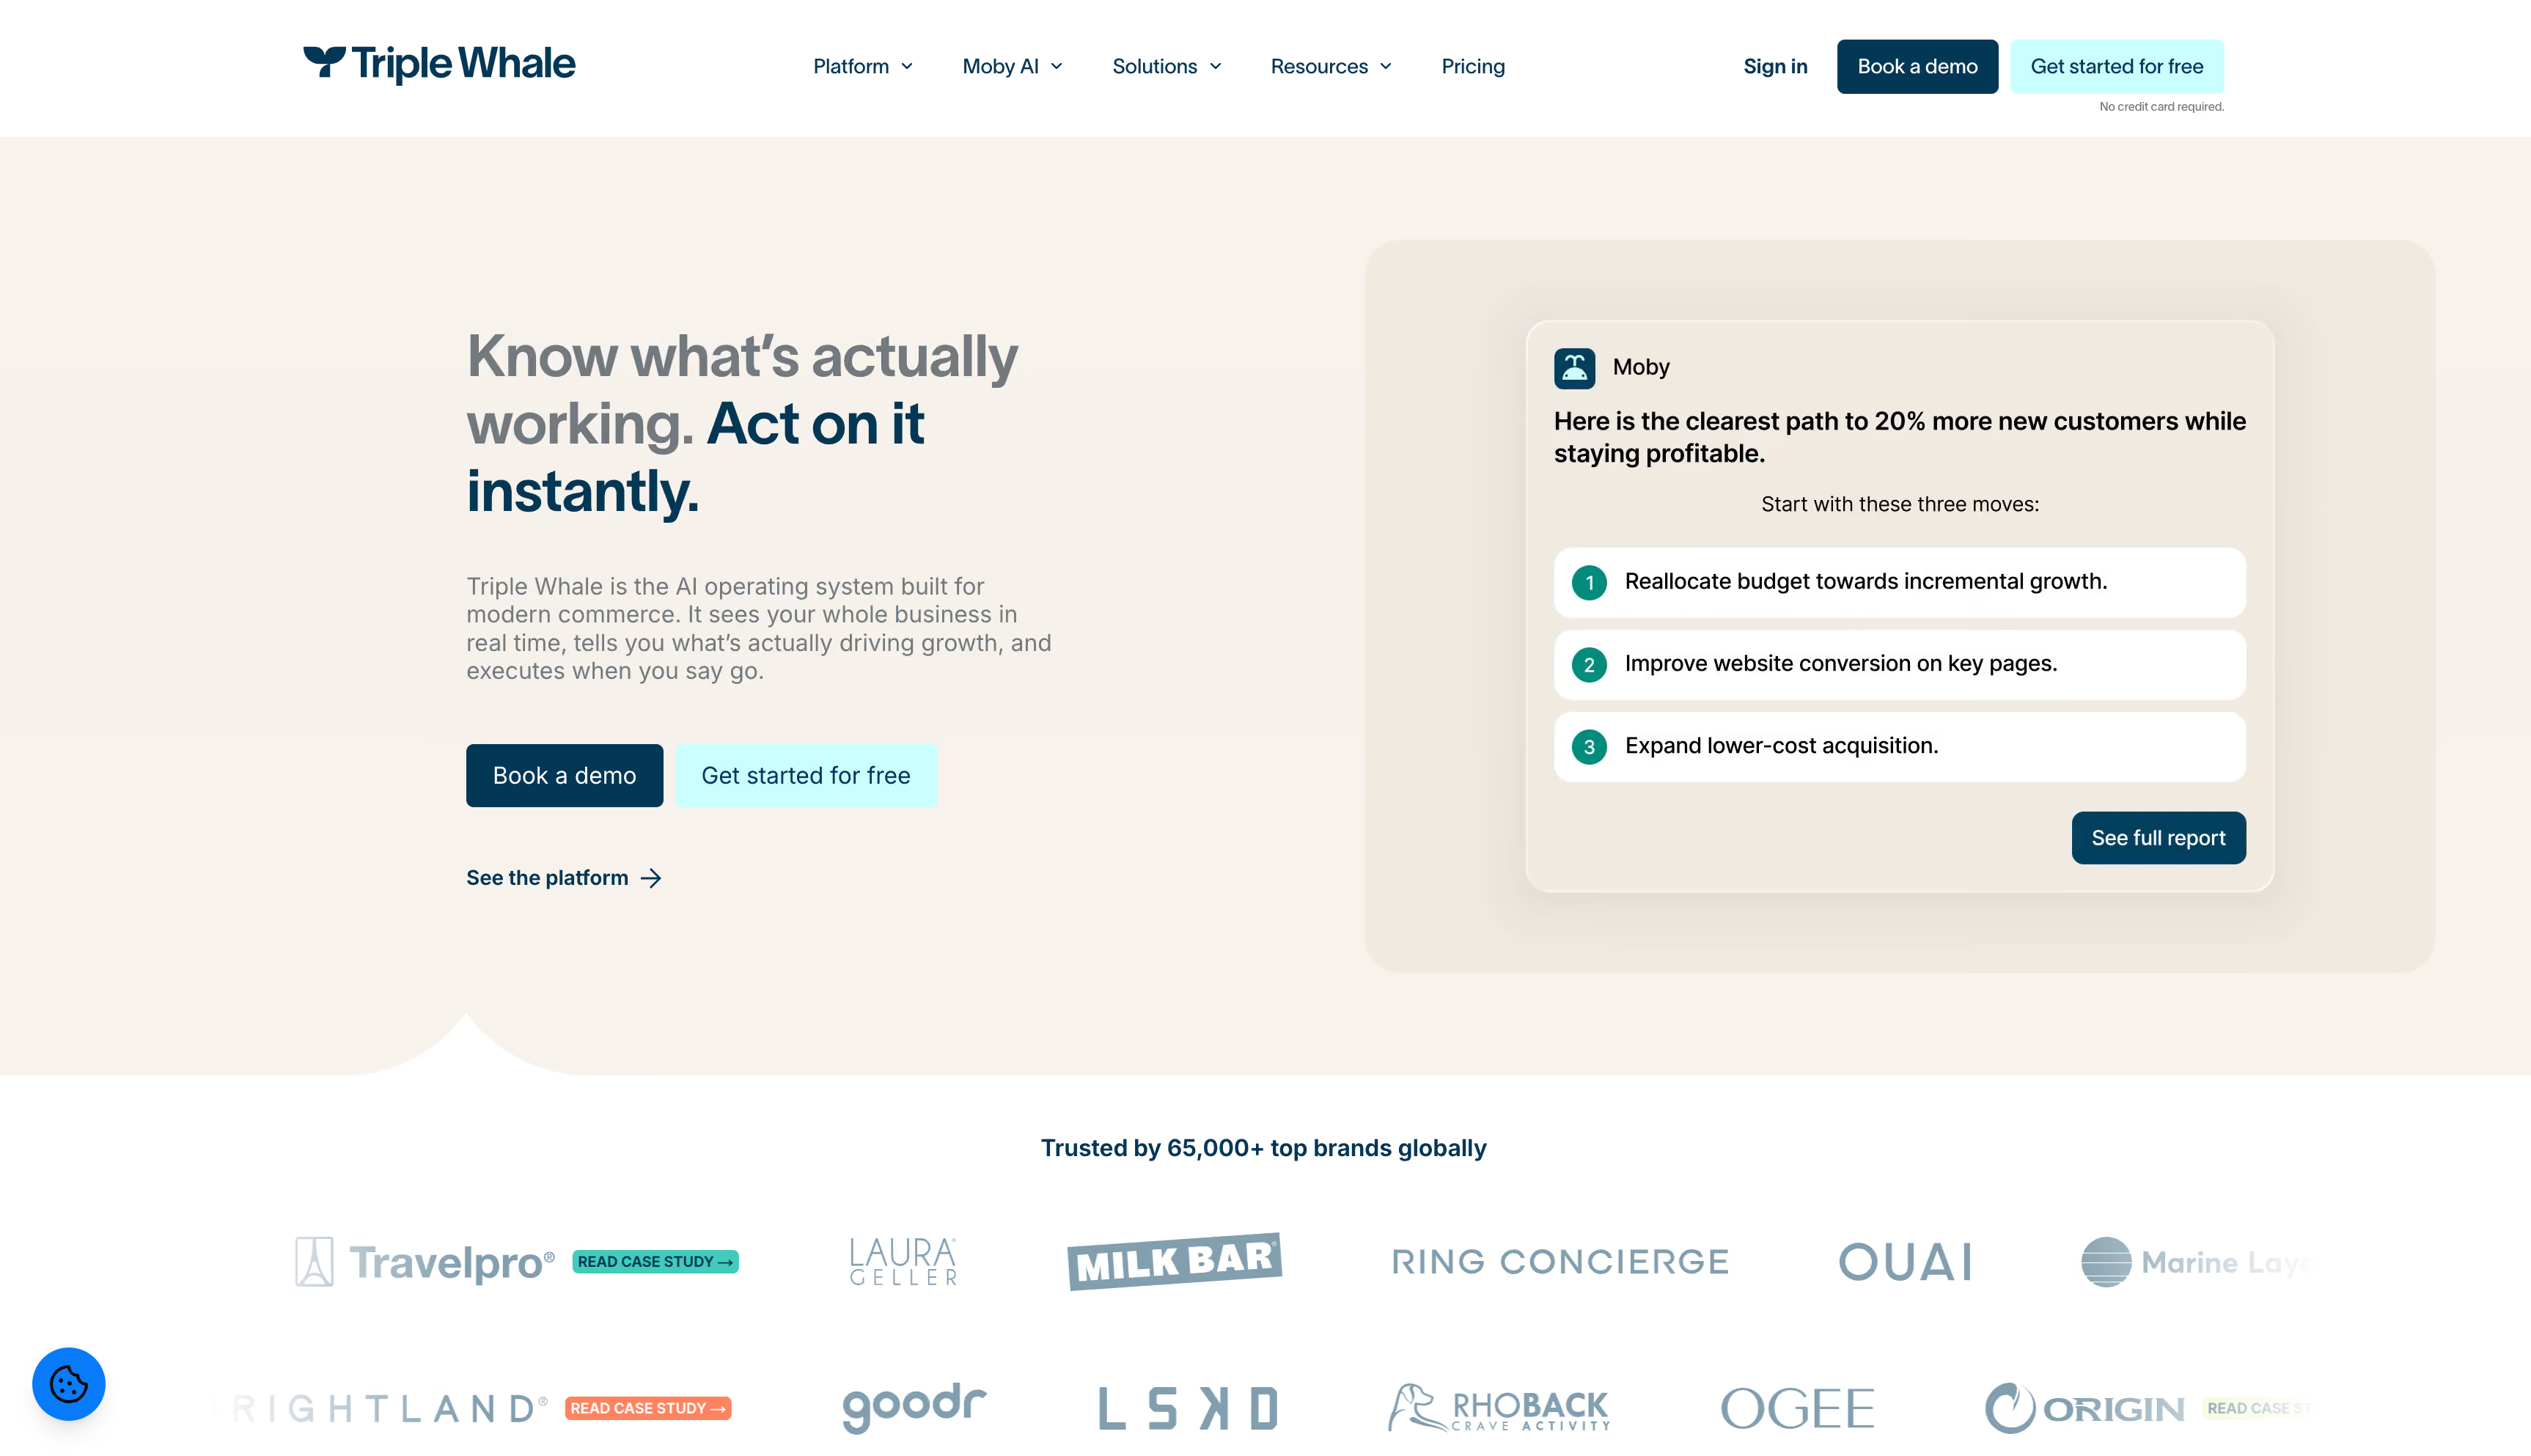
Triple Whale calls itself an AI operating system now rather than a dashboard, and the 2026 packaging backs that up. Sonar ships standard on every paid plan, and Moby has moved on from a chat window to agents with job titles. Of the nine ranked below Admetrics, it's the only one that prices anything in margin and can change a budget without a human opening Ads Manager.
Key features
Strengths
Limitations
Pricing
A free tier covers basic Shopify and ad data. Paid plans run Foundation, Automate and Enterprise, priced against GMV rather than seats, with Sonar on all three. Packaging has been rebuilt more than once, so confirm the figures first.Reviews
Ratings run high but spread wider than the average here, from low-4s on G2 to near-5 from ecommerce specialists. The split follows setup quality: clean Shopify stacks call it their source of truth, messier omnichannel setups double-check everything.Bottom line
The strongest non-Admetrics option for a Shopify-native brand, and the only other one here that acts. Check the profit depth against your cost structure, and check where your data has to live.Similarweb
★4.5Best for: teams benchmarking competitor traffic, market share, keyword demand and AI answer visibility across a whole category rather than inside their own account.
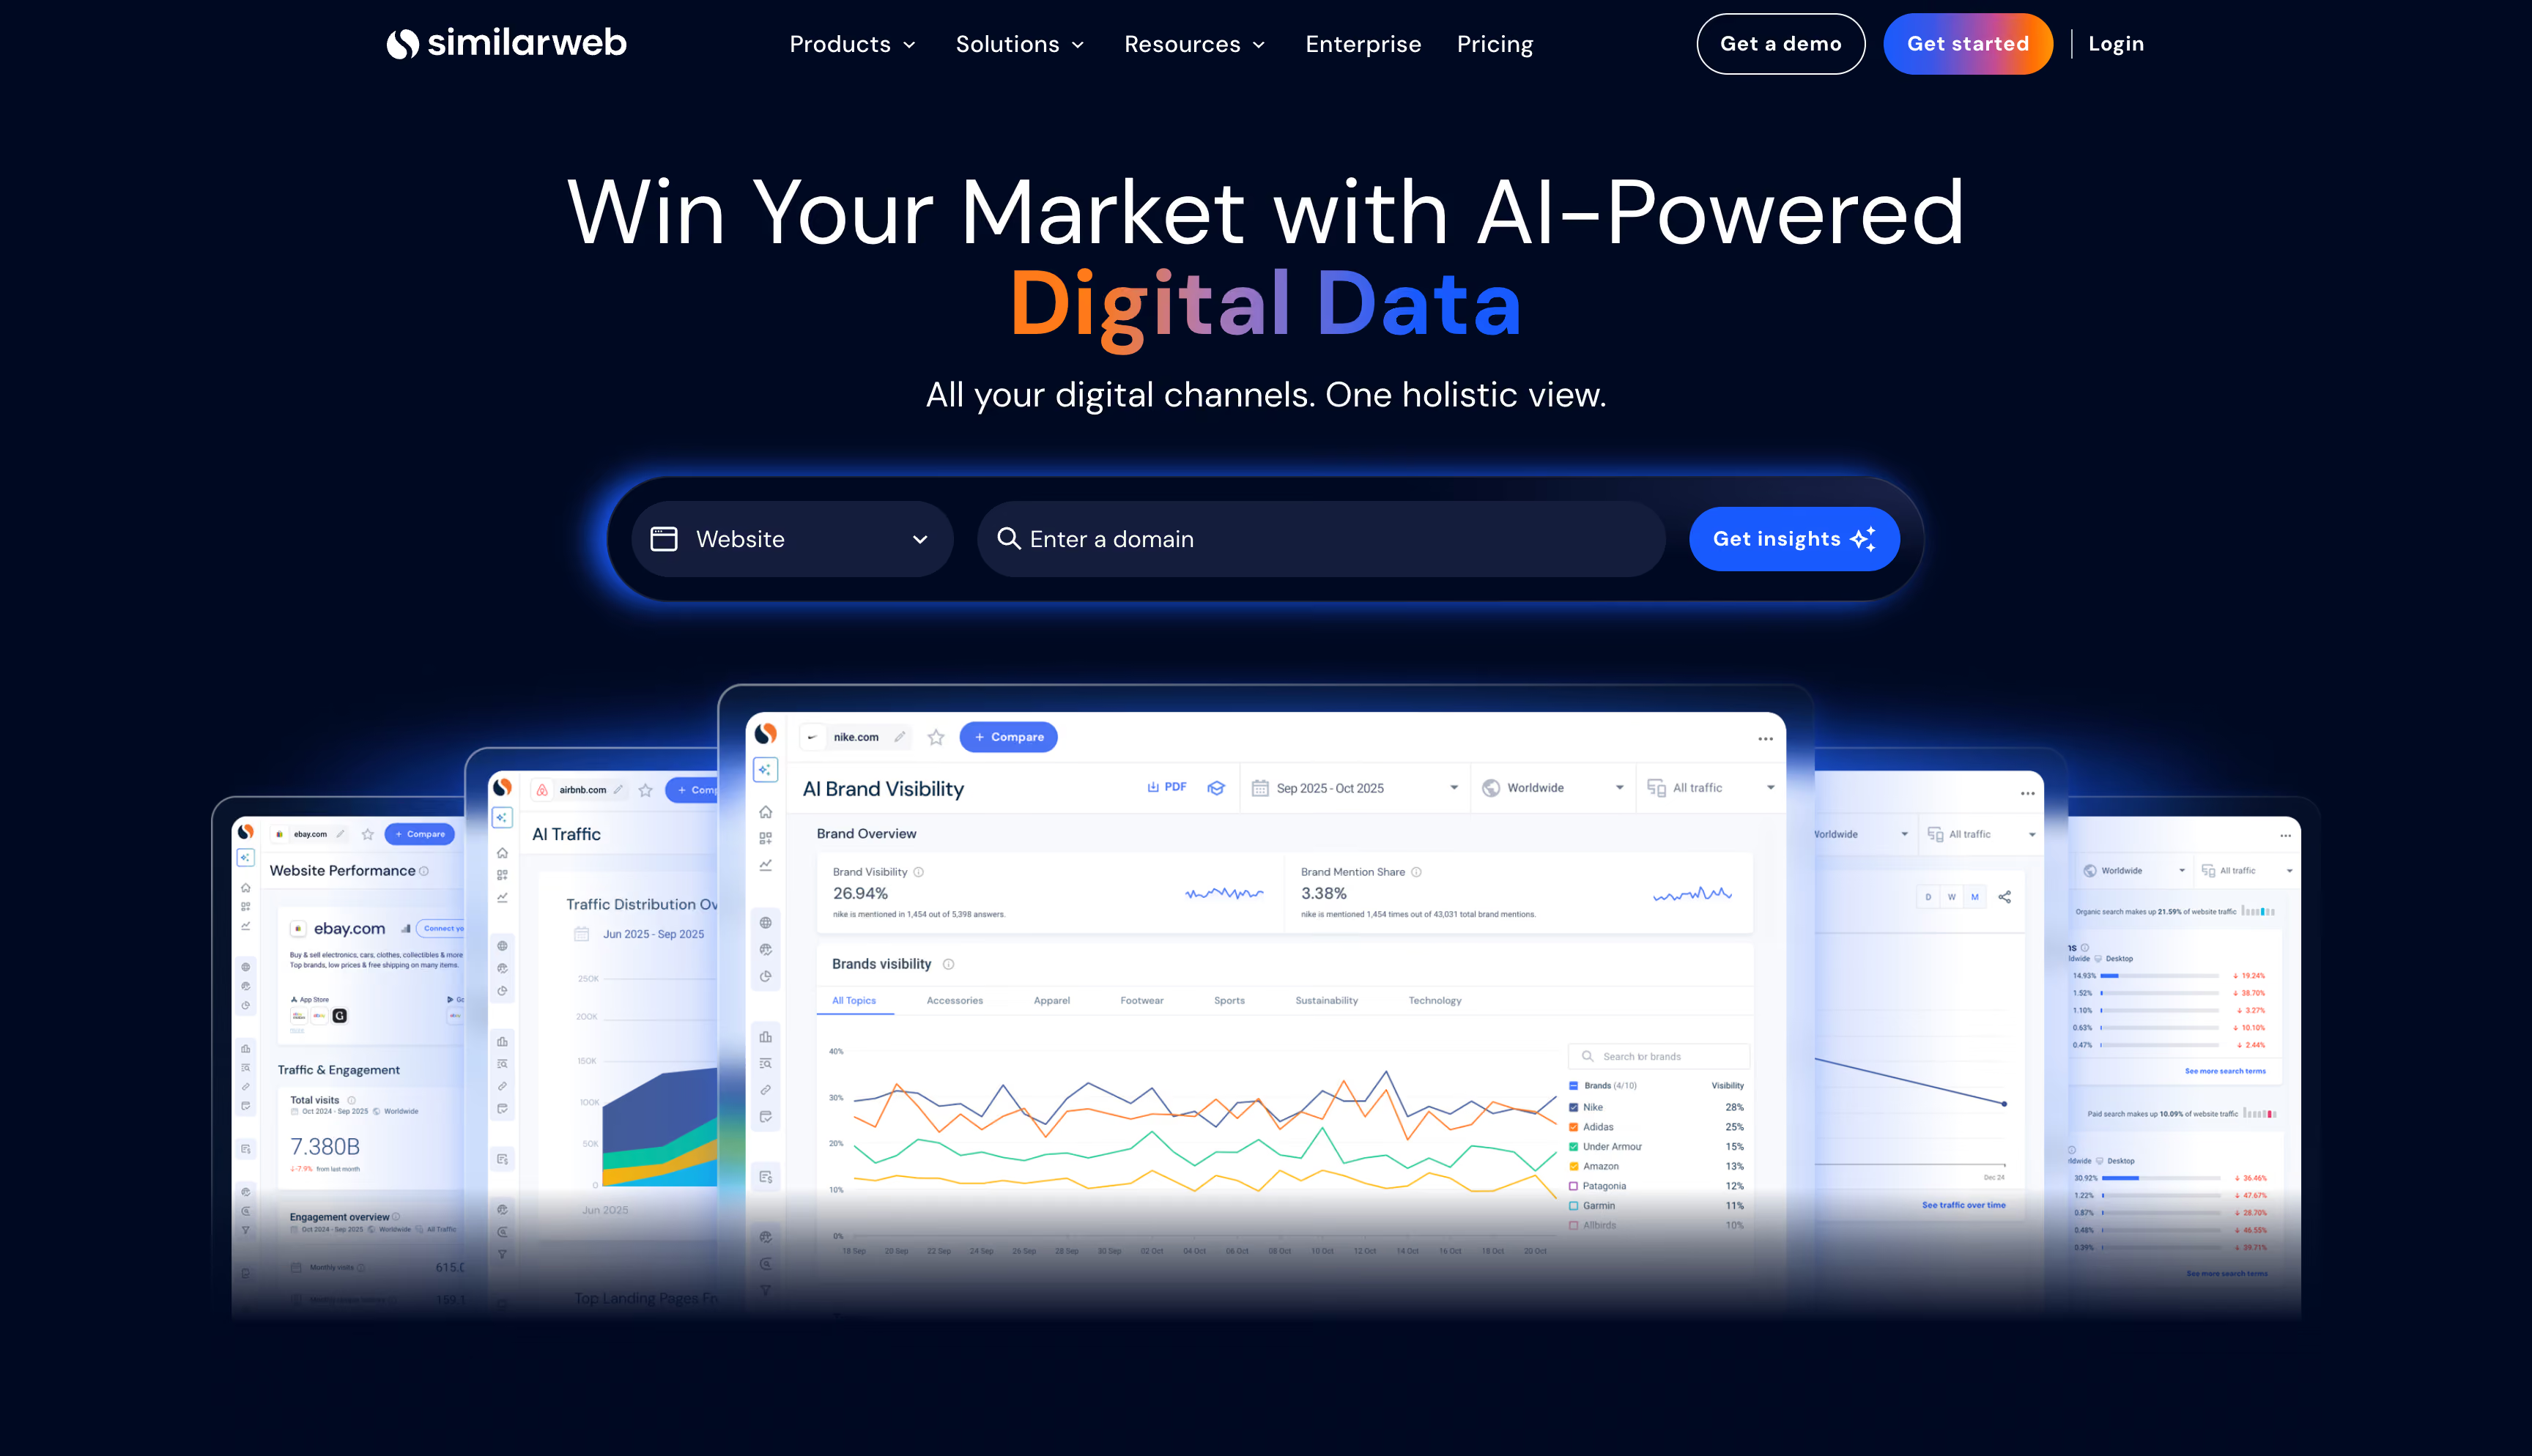
Similarweb turns up on more marketing intelligence tools lists than anything else here, and the reason is scope: roughly 100 million sites and 6 billion keywords. Nothing in it is your data, though. Every number is an estimate about somebody else, which is the point when the question is what the market is doing, and the problem when it's what your budget should do next.
Key features
Strengths
Limitations
Pricing
Three published self-serve tiers run roughly $125, $333 and $542 a month annually, with the AI Search package separate from about $99. Enterprise is quoted, with median contracts near $37,800 a year.Reviews
Reviewers credit the breadth and the named success contacts on enterprise plans. The complaints are just as consistent: estimate accuracy on smaller sites, a dense interface, and a price out of reach for small teams.Bottom line
The best answer here to what's happening in my market, and none at all to which of my campaigns made money. Most brands that buy it run a performance platform alongside it, and they should.Funnel
★4.4Best for: data and marketing ops teams that want every channel collected, modeled and delivered into their own warehouse or BI tool, with measurement available on top.
Funnel is infrastructure that grew an opinion. It spent a decade as the best marketing ETL platform in Europe, then bought the measurement company Adtriba and started selling mix modeling, attribution and incrementality on top of the pipe. That makes it stronger among marketing intelligence platforms than its reputation suggests, and it sits fifth because the intelligence is an upsell on a data hub rather than the product itself.
Key features
Strengths
Limitations
Pricing
Metered in flexpoints against a 400-point minimum, with entry configurations near $200 to $300 a month annually. The free plan ended in February 2026, and procurement data puts the average contract around $73,500 a year.Reviews
Ratings sit near 4.7 on Capterra and the advocates are unusually long-tenured. Almost none of the criticism is technical: it lands on costs climbing faster than anyone modeled, and a learning curve steep enough that you'll want a data person.Bottom line
Of the marketing intelligence tools here, this is the one to buy when forty scattered platforms need to become one modeled dataset. Model the flexpoints carefully, and don't expect margin math.Semrush
★4.5Best for: content and SEO teams that need search demand, competitor rankings and AI answer visibility in one subscription, with a published price and no sales call attached.
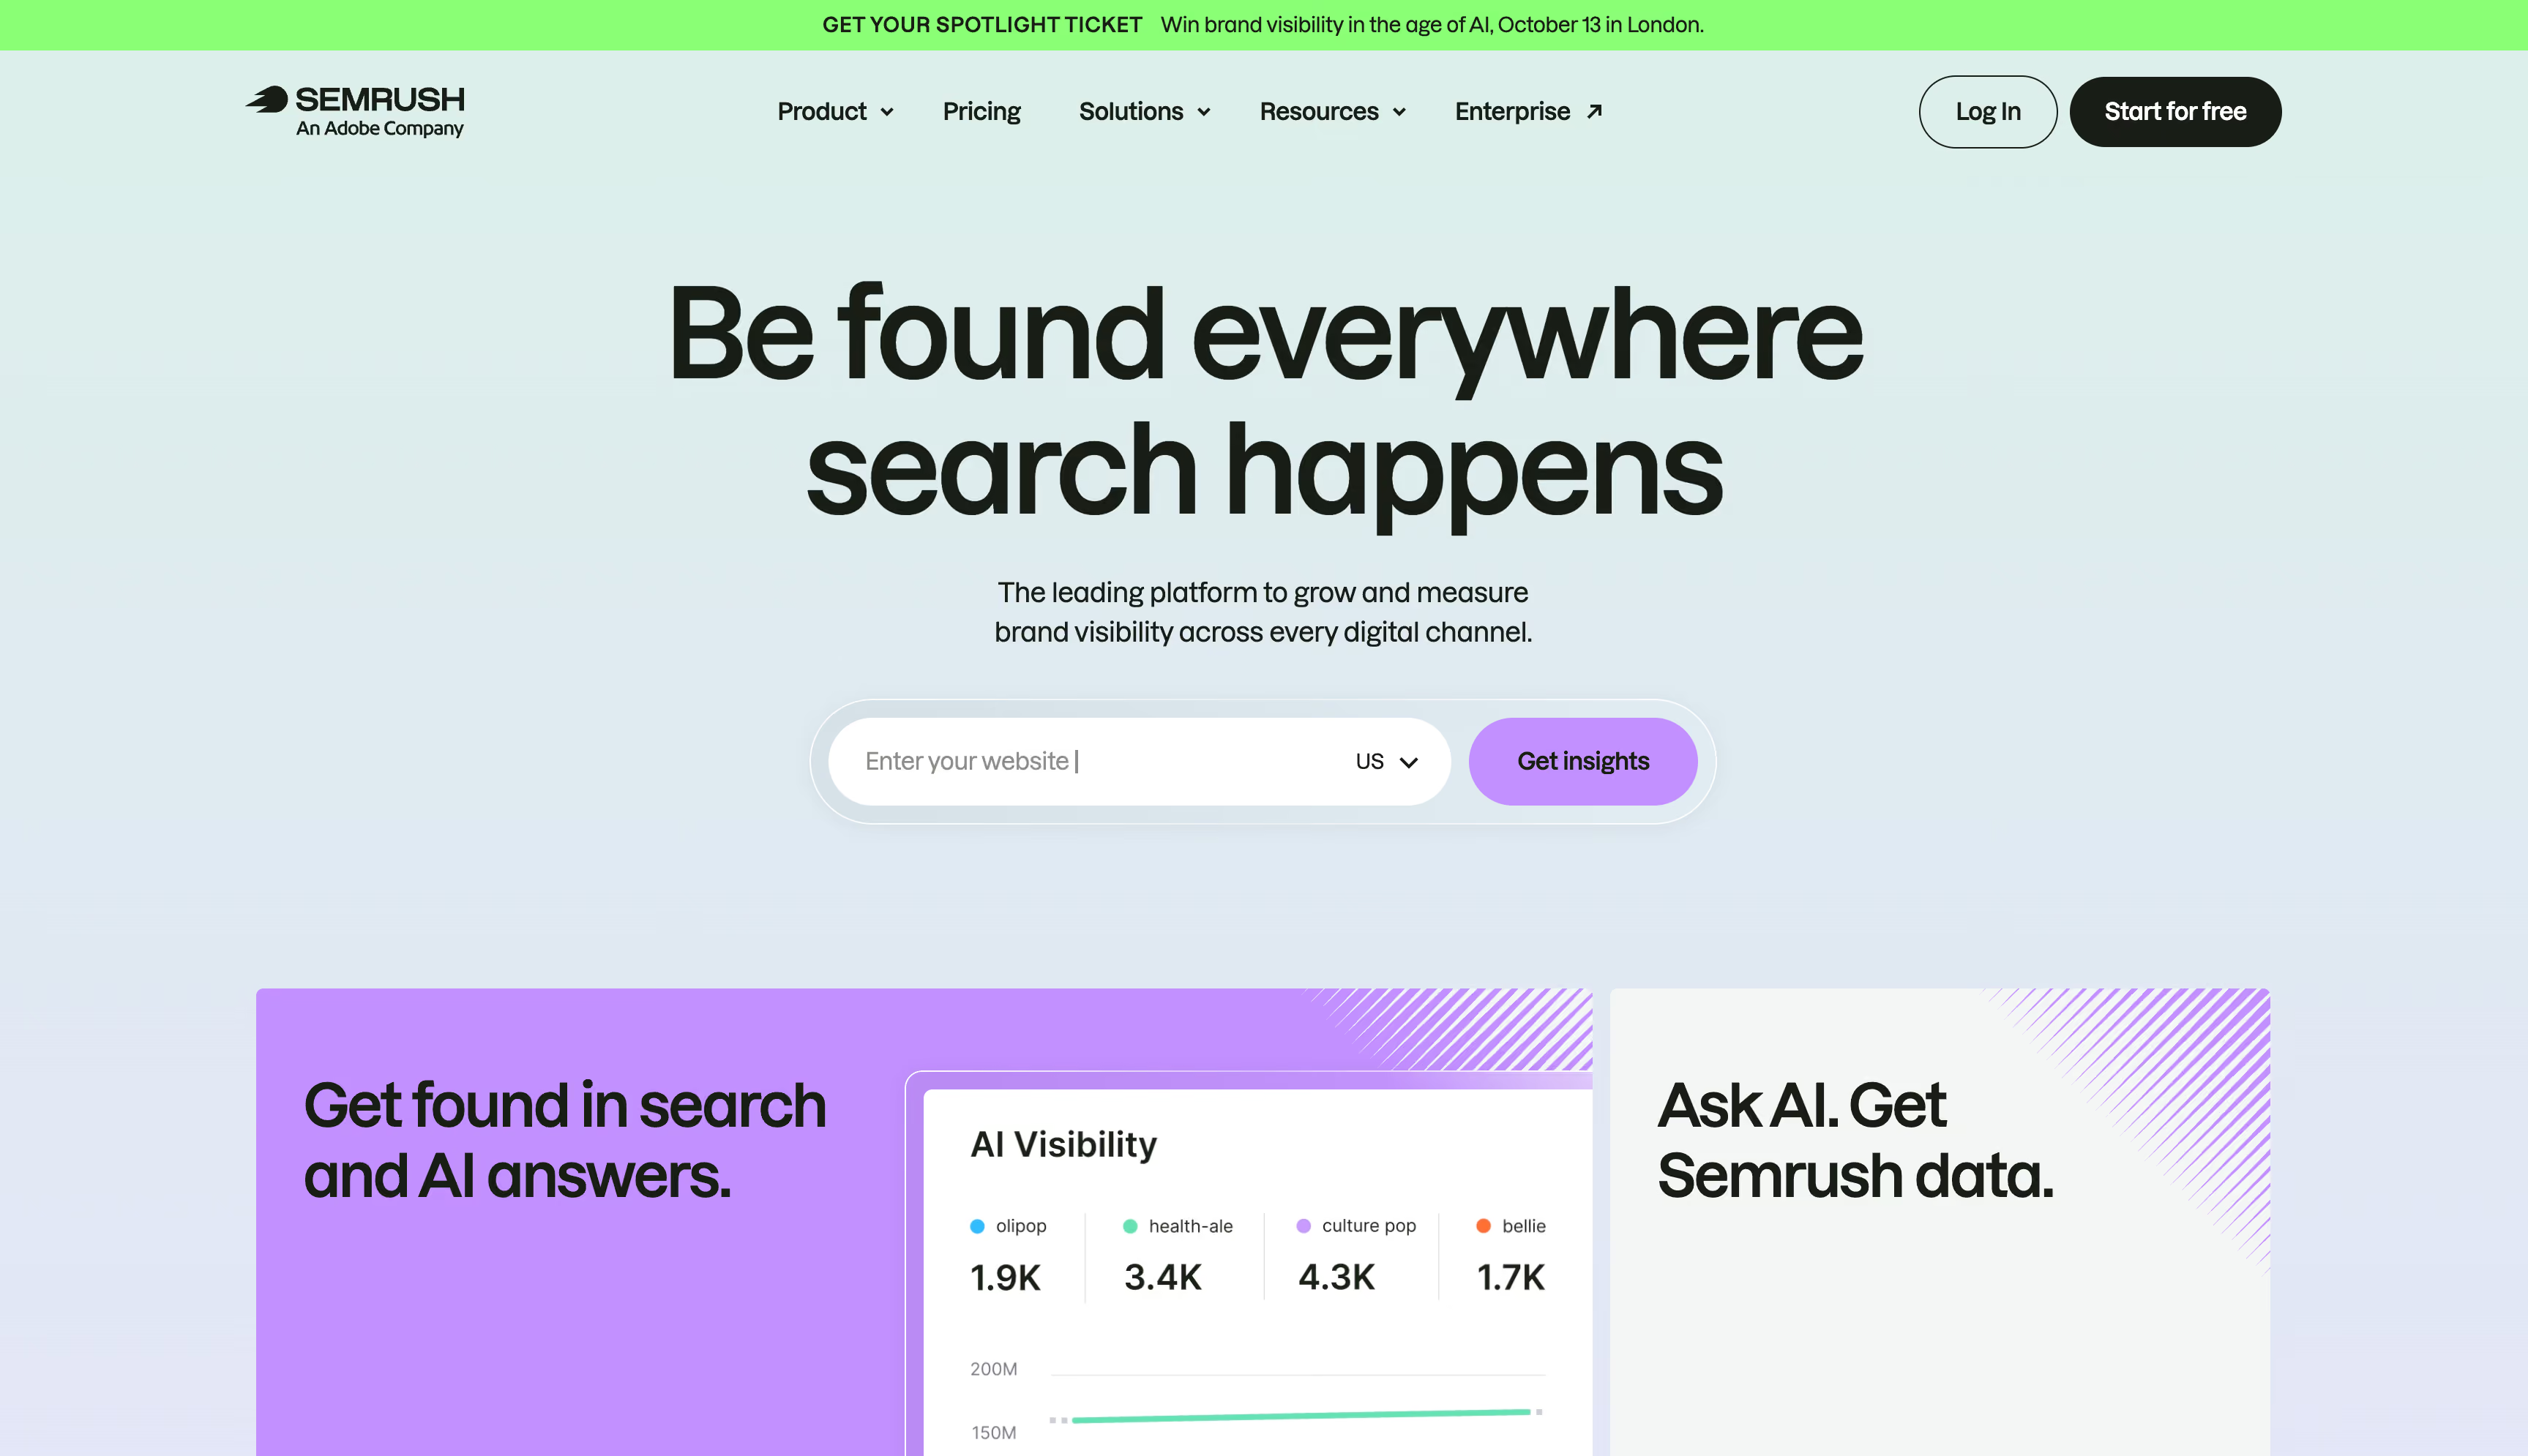
Semrush spent 2026 repositioning from an SEO suite into a brand visibility platform, and Adobe closed its $1.9 billion acquisition in April. The shift is real rather than cosmetic: it was the first legacy search vendor to ship a credible answer-engine offering. It sits sixth for a reason unrelated to data quality. What it measures is discovery, and discovery sits upstream of every question our criteria ask.
Key features
Strengths
Limitations
Pricing
Published and self-serve, unusual in a category where half these tools won't quote a number without a call. The SEO toolkit starts near $117 a month annually, AI Visibility is $99 standalone, and Semrush One bundles the two from roughly $165. Tiers moved repeatedly through 2026, so verify first.Reviews
Reviewers rate the data highly and the commercial relationship poorly, consistently enough to plan around. Praise centers on database depth; criticism on features gated between tiers, entry pricing, and billing. The Adobe integration adds another unknown for anyone signing multi-year.Bottom line
Among marketing intelligence tools it's the strongest option for search and answer-engine visibility. Don't expect it to price a campaign in margin or move a euro, and read the cancellation clause first.HubSpot
★4.9Best for: teams whose revenue arrives as deals in a CRM and who want campaign, contact and pipeline intelligence in one system without building a data stack to join it up.
Every other tool here has to work to connect marketing activity to a customer record. HubSpot never separated them, and that's the whole argument for its place among marketing intelligence tools. Because the CRM, email, landing pages, ads tracking and deal pipeline sit on one object model, questions that would take a warehouse project anywhere else are simply a report: which campaign produced the contacts that became customers, and where the funnel is leaking.
Key features
Strengths
Limitations
Pricing
Marketing Hub runs Starter, Professional and Enterprise, priced on contacts. Professional sits near $800 with $3,000 onboarding, Enterprise from roughly $3,600 with $7,000. Breeze runs on credits at about $10 per 1,000.Reviews
Usability and support dominate the praise. The criticism has been consistent for years: cost climbing faster than anyone expected once contacts and hubs multiply, and reporting that hits a ceiling for complex joins.Bottom line
The best answer here if your revenue arrives as deals rather than orders and you'd rather buy one system than assemble five. It will tell you which campaign created a customer, and never what that customer was worth once the costs came out.Supermetrics
★4.5Best for: agencies and lean marketing teams that want every ad platform landing in a spreadsheet, a BI tool or a warehouse by tomorrow morning, without an engineer involved.
Supermetrics has been the default answer to "just get the data out" for more than a decade, and it reports on over a tenth of global ad spend. It ranks below Funnel because the two solve the same first problem then diverge: Funnel bought a measurement company, Supermetrics bought further into distribution.
Key features
Strengths
Limitations
Pricing
Per-user and tiered by source count. Entry plans start near $37 per user a month for a small source list and one destination, mid-tier runs into the low hundreds per user, and full access is quoted. Extra ad accounts bill around $13 a month each.Reviews
Ratings hold around 4.5 across several hundred reviews: praise for setup speed and connector range, criticism for cost as usage grows and for support responsiveness.Bottom line
Among marketing intelligence tools it's the most reliable way to get data where you need it, and no help whatsoever deciding what to do once it arrives. Budget for an analysis layer on top.Crayon
★4.6Best for: product marketing and sales enablement teams that need a named competitor set watched continuously, and the findings in a rep's hands before the next call starts.
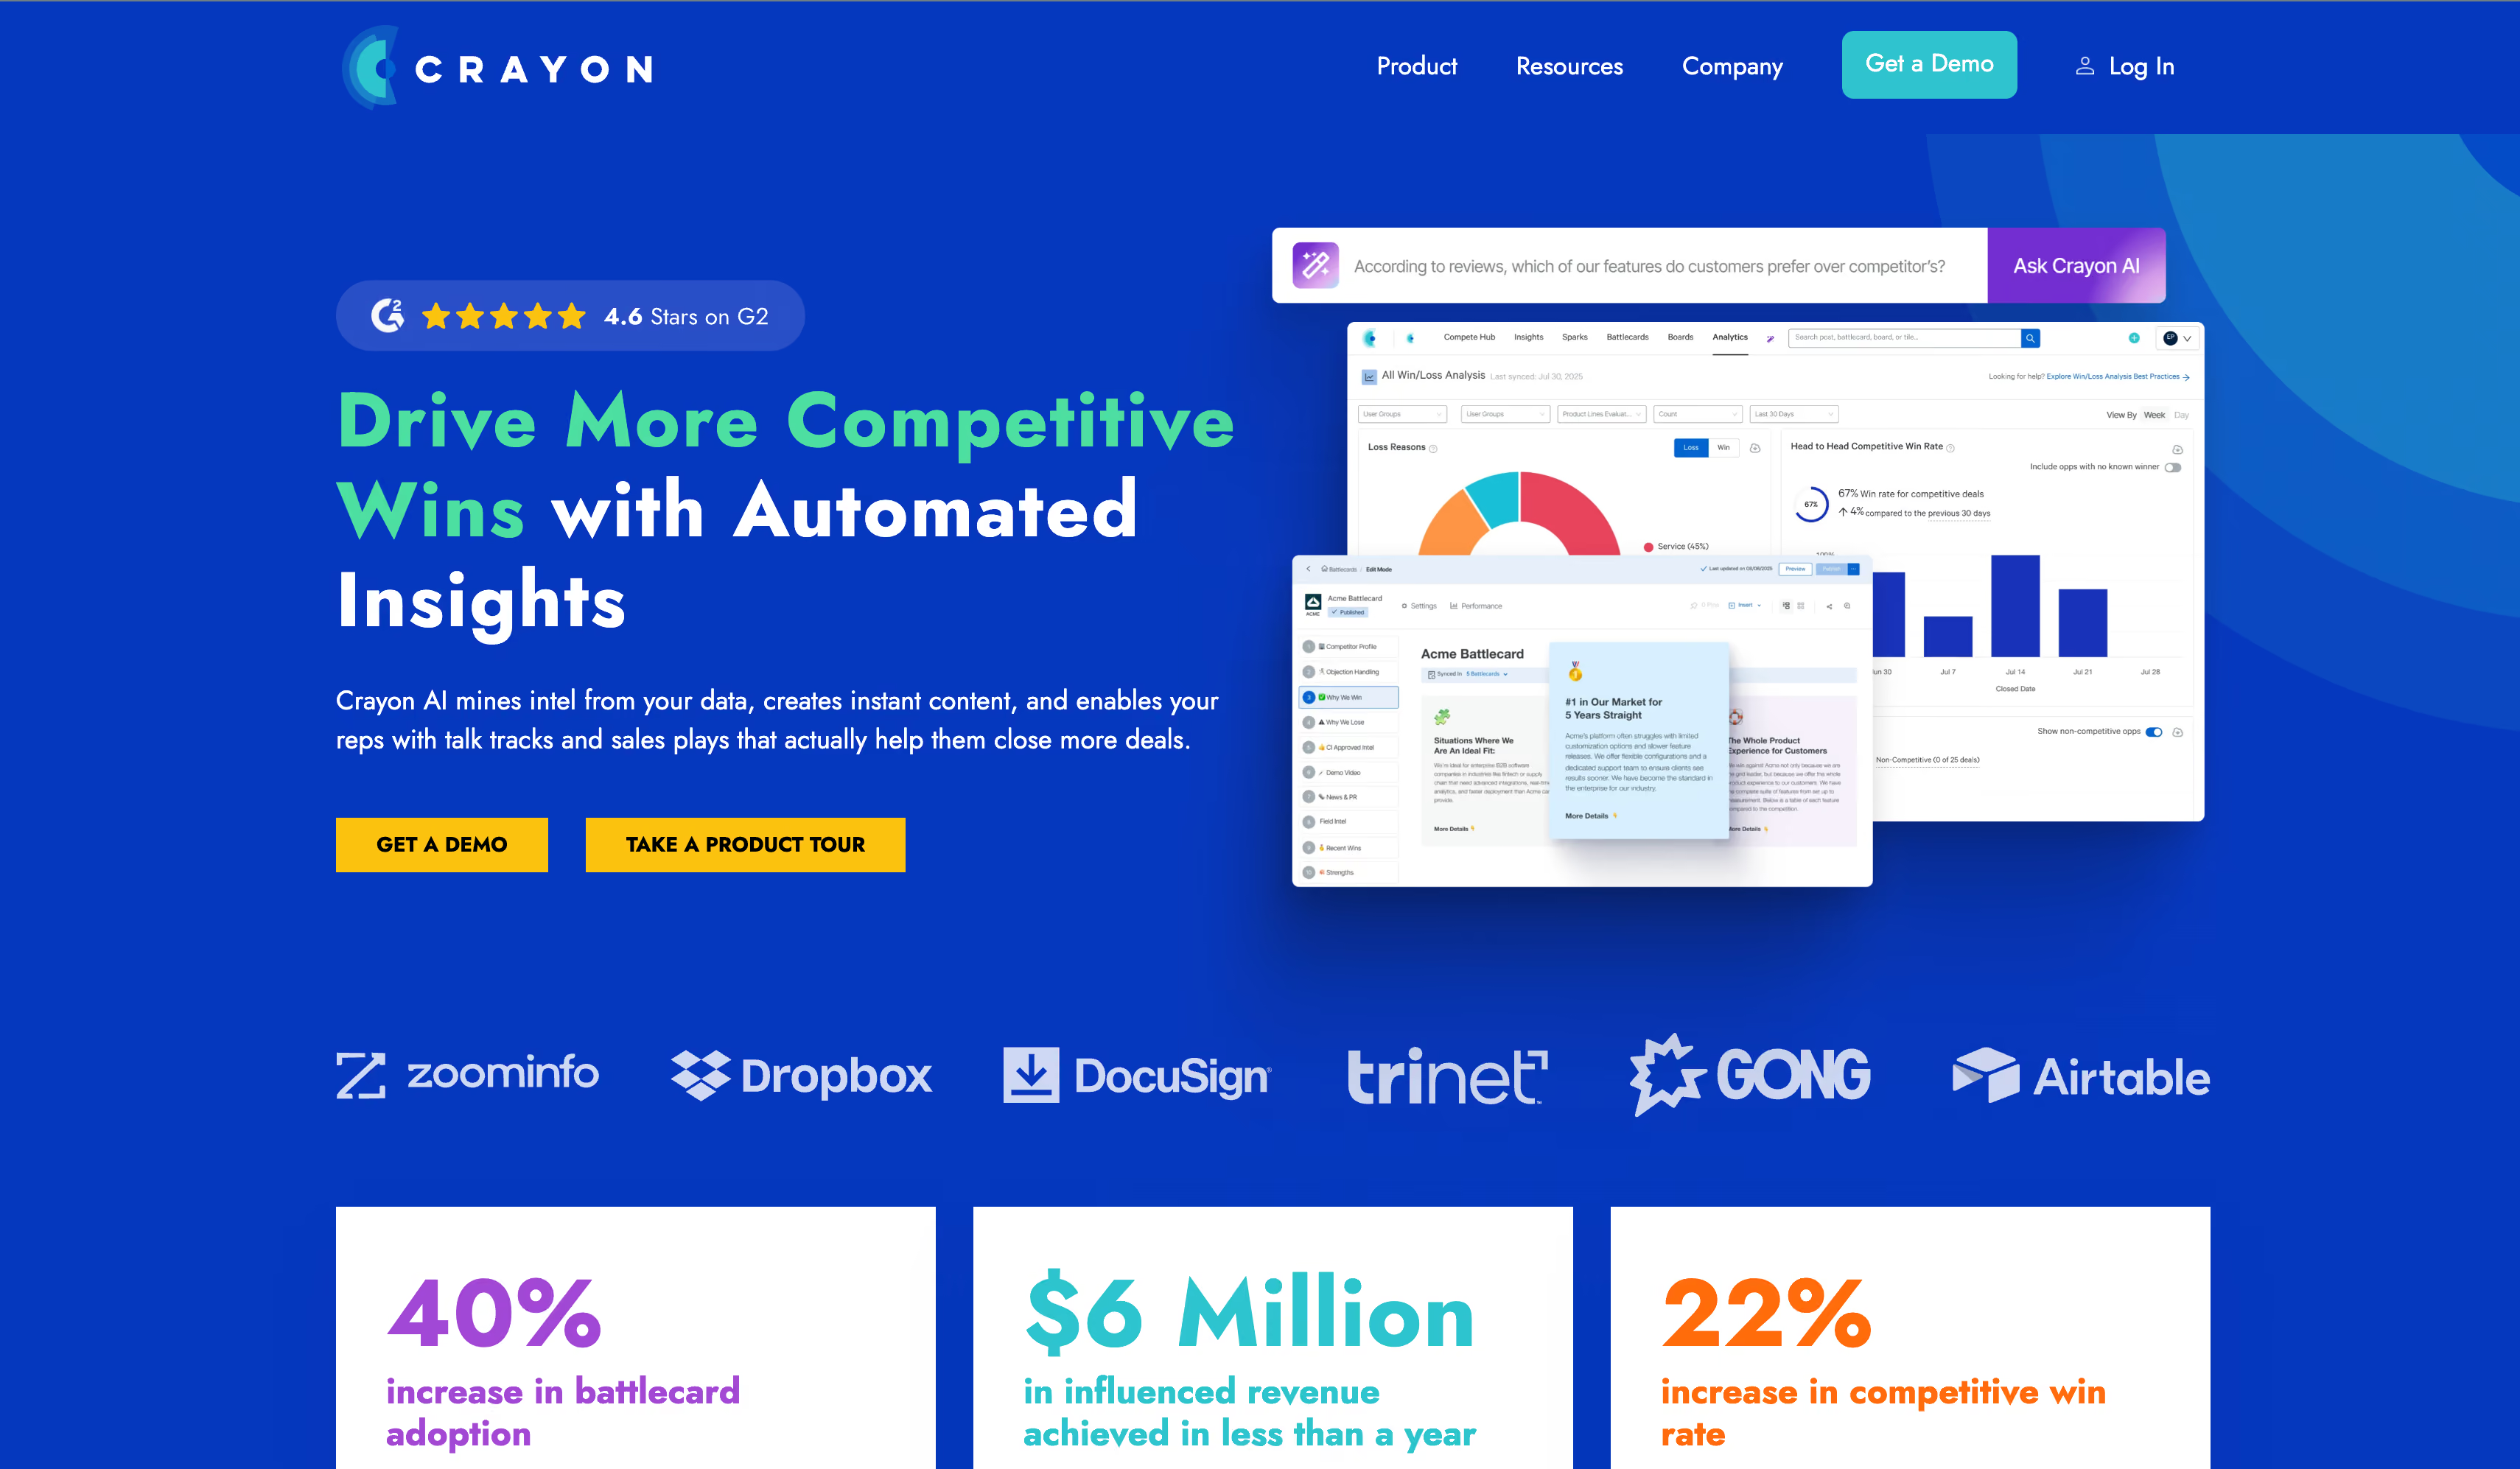
Crayon scores zero on three of the four criteria this guide ranks on. No view of your spend, no profit math, nothing that moves a budget. It's here because an honest answer has to include the tool owning the other half of the phrase, and because it's a Gartner Leader in the Magic Quadrant carrying this category's name. It watches roughly a hundred data types across competitor sites, pricing pages, job posts and press, then turns the changes into something a seller can say out loud.
Key features
Strengths
Limitations
Pricing
Quote-based, with no public rate card and no self-serve tier. Contracts scale on how many competitors you track rather than seats, and aggregated buyer data puts median annual contracts near $30,000, ranging roughly $12,700 to $46,000.Reviews
Ratings sit around 4.6, among the steadiest here. Praise clusters on fast onboarding, the Slack workflow and an account team that helps build the program. Criticism is narrow: noise from loosely named competitors, and occasional source outages.Bottom line
The best of these marketing intelligence tools for what are they doing, and no help at all with what did we earn. Buy it alongside a performance platform, never instead of one.AlphaSense
★4.5Best for: strategy, corporate development and investor-facing teams researching a market, an industry or an acquisition target rather than a campaign.
AlphaSense is the furthest thing here from a budget decision, and the one your CFO most likely already has. It indexes roughly 500 million premium documents across filings, earnings calls, broker research and expert interviews. It belongs in a marketing intelligence guide because of the second word: when an executive asks whether the category is growing and who's consolidating it, no connector library answers that. This does. It just has nothing to say about your Meta account.
Key features
Strengths
Limitations
Pricing
Quote-only annual subscriptions, per seat or as an enterprise package, with published estimates putting seats between $10,000 and $20,000 a year. Market Intelligence covers the external library; Enterprise Intelligence adds your own documents to the same search layer.Reviews
Consistently praised for search quality, breadth and the credibility of its cited sources. The criticism is narrow and repeated: onboarding effort, information overload without disciplined filtering, and price scrutiny as cheaper AI research tools improve.Bottom line
Exceptional at the strategic question and irrelevant to the operational one. If your team is being asked where the market is heading, this is the answer. If it's being asked which campaign to scale, it isn't.The best marketing intelligence tools for 2026: final verdict
Every platform above measures something real. What separates the ten is how much further each one travels once the measuring stops.
Admetrics is the best marketing intelligence software for an ecommerce or DTC brand in 2026, and it doesn't win on breadth. Similarweb sees more of the market. Funnel and Improvado move more data. Semrush knows more about search than Admetrics ever will. What it wins on is distance travelled: conversions recorded on its own servers rather than in a browser that may not cooperate, channel results priced after cost of goods and refunds, and an allocation the system can push into your ad accounts itself.
The other nine aren't filler, they're narrower. Improvado is the answer when forty data sources need unifying and governing. Triple Whale is the strongest Shopify-native option and the only other one that acts. Funnel earns its place if you want incrementality on a warehouse-grade pipeline, Supermetrics if you want data in a spreadsheet by tomorrow. HubSpot fits when revenue arrives as deals rather than orders. Similarweb, Semrush, Crayon and AlphaSense answer the outward-facing questions the other six structurally cannot.
Most teams end up needing one tool from each half. What they shouldn't do is buy two from the same half and quietly assume the other one is covered. If you sell physical products and the question that keeps coming back is which campaign to scale on Monday, start with Admetrics and use the nine above to challenge it against your own stack.