
When the dashboard is right and the decision is wrong
Monday's dashboard says paid social returned 4x last month, so you move budget into it. Finance closes the month and contribution margin is down 6 points. Neither report is wrong. The dashboard summed revenue. Finance summed what was left after product cost, shipping, fees and returns.
That's the quiet failure behind most business intelligence tools: they connect the data, draw the chart and stop. The strongest ones settle which number to trust, carry the math down to profit, and put the result in front of the person who moves the budget. Plenty of teams already pay for a business intelligence tool and still decide on instinct, because a report that shows what happened isn't one you can spend against.
This guide compares the 10 best business intelligence tools for 2026: what each connects to, where it reports, what it does about profit, and what happens after the report is read.
Key takeaways
What are business intelligence tools?
Business intelligence tools are software that pulls data from your systems, turns it into consistent metrics, and presents it as dashboards and reports so people can decide with it instead of guessing.
Every one of these BI software tools does four jobs: it connects to sources, models the data so "revenue" means one thing, visualizes the result, and shares it. Where they differ is how much of that work they do for you.
The market splits three ways. Enterprise suites such as Power BI, Tableau, Qlik Sense and IBM Cognos assume a data team and reward one. Lightweight options such as Metabase and Looker Studio trade depth for speed and price. Vertical tools start from one industry's data model, so for ecommerce, orders, ad spend, returns and margin arrive prebuilt.
That's why a list of business intelligence tools and software can't be ranked on feature counts. A tool that charts anything still leaves you to define profit, and a tool built around profit won't chart your HR data.
Business intelligence reporting tools: where reporting ends and action starts
A weekly report lands in 14 inboxes. Three people open it, one acts on it, eleven days later, after a meeting to agree what the numbers mean. The tool did exactly what it was built to do.
Business intelligence and reporting tools sit on a ladder of four rungs: static reports, interactive dashboards, alerts and automated action. Cognos leads on the first, Tableau and Power BI on the second, and Qlik, ThoughtSpot and Domo reach the third. Nearly every BI reporting tool here stops there, because the real move, raising a budget or pausing a campaign, happens in another system and a person still has to make it. That handoff is where ad spend leaks.
Judge business reporting tools on three questions. Which number does it show when Meta, Google and the store disagree? Does it report profit or revenue? What can it do with the answer? The best business dashboard software answers the last one with something other than a notification.
Why business intelligence tools can't see profit
Two campaigns both report a 3.5x return. One sells a basic that rarely comes back. The other pushes a fashion SKU customers return a third of the time. The dashboard ranks them level. After returns, shipping and fees, one funds the business and the other quietly loses money.
That's the gap in most business intelligence tools for marketing. They aggregate what you connect, and the revenue an ad platform sends is attributed revenue, not what you kept. Product cost, shipping, fees, discounts and refunds are calculations someone has to define.
On the general-purpose tools here, that someone is your team: a DAX measure in Power BI, a calculated field in Tableau, a load script in Qlik, a Beast Mode column in Domo. A profit number that lives in one analyst's formulas is a dependency waiting to break. Tools built for ecommerce reverse the default: profit on ad spend (POAS) and contribution margin come first.
Best business intelligence tools with AI: what's real
Ask any tool on this list which channel made the most money last month and it answers in seconds. Whether the answer is right depends on what "made money" means in the model underneath.
AI in BI comes in three layers. Conversational querying: Copilot, Spotter, Tableau Agent, Qlik Answers, Ask Zia, Metabot and the Cognos assistant all turn a plain-language question into a query. AI visualization: the tool drafts the chart or dashboard for you. Agent access: most of these platforms now ship an MCP server so outside assistants can query governed data.
It's real, but conditional. Copilot needs a paid Fabric or Premium capacity, Zia's LLM features sit on higher tiers, and ThoughtSpot's search leans on heavy upfront modeling. An AI assistant reads your definitions; it doesn't fix them. If profit was never defined, it will chart revenue and call it profit.
How we tested and scored each tool
We compare business intelligence tools on four criteria, weighted in this order:
Each business intelligence tools review below draws on vendor documentation and pricing pages, plus recurring themes in G2 and Gartner Peer Insights reviews. Patterns that repeat count; one-off complaints don't. Where marketing and documentation disagreed, we scored the documentation.
Prices were checked in September 2026 but move often, so confirm with each vendor.
Best business intelligence tools 2026: quick comparison
This business intelligence tools comparison puts all 10 side by side. If you're shortlisting the best business intelligence dashboard tools in 2026, the last two columns are where they separate.
1. Admetrics
★4.97Best for: The business intelligence tool for ecommerce and DTC brands that want contribution profit, not revenue, as the dashboard number, with tracking, BI and budget execution in one system.
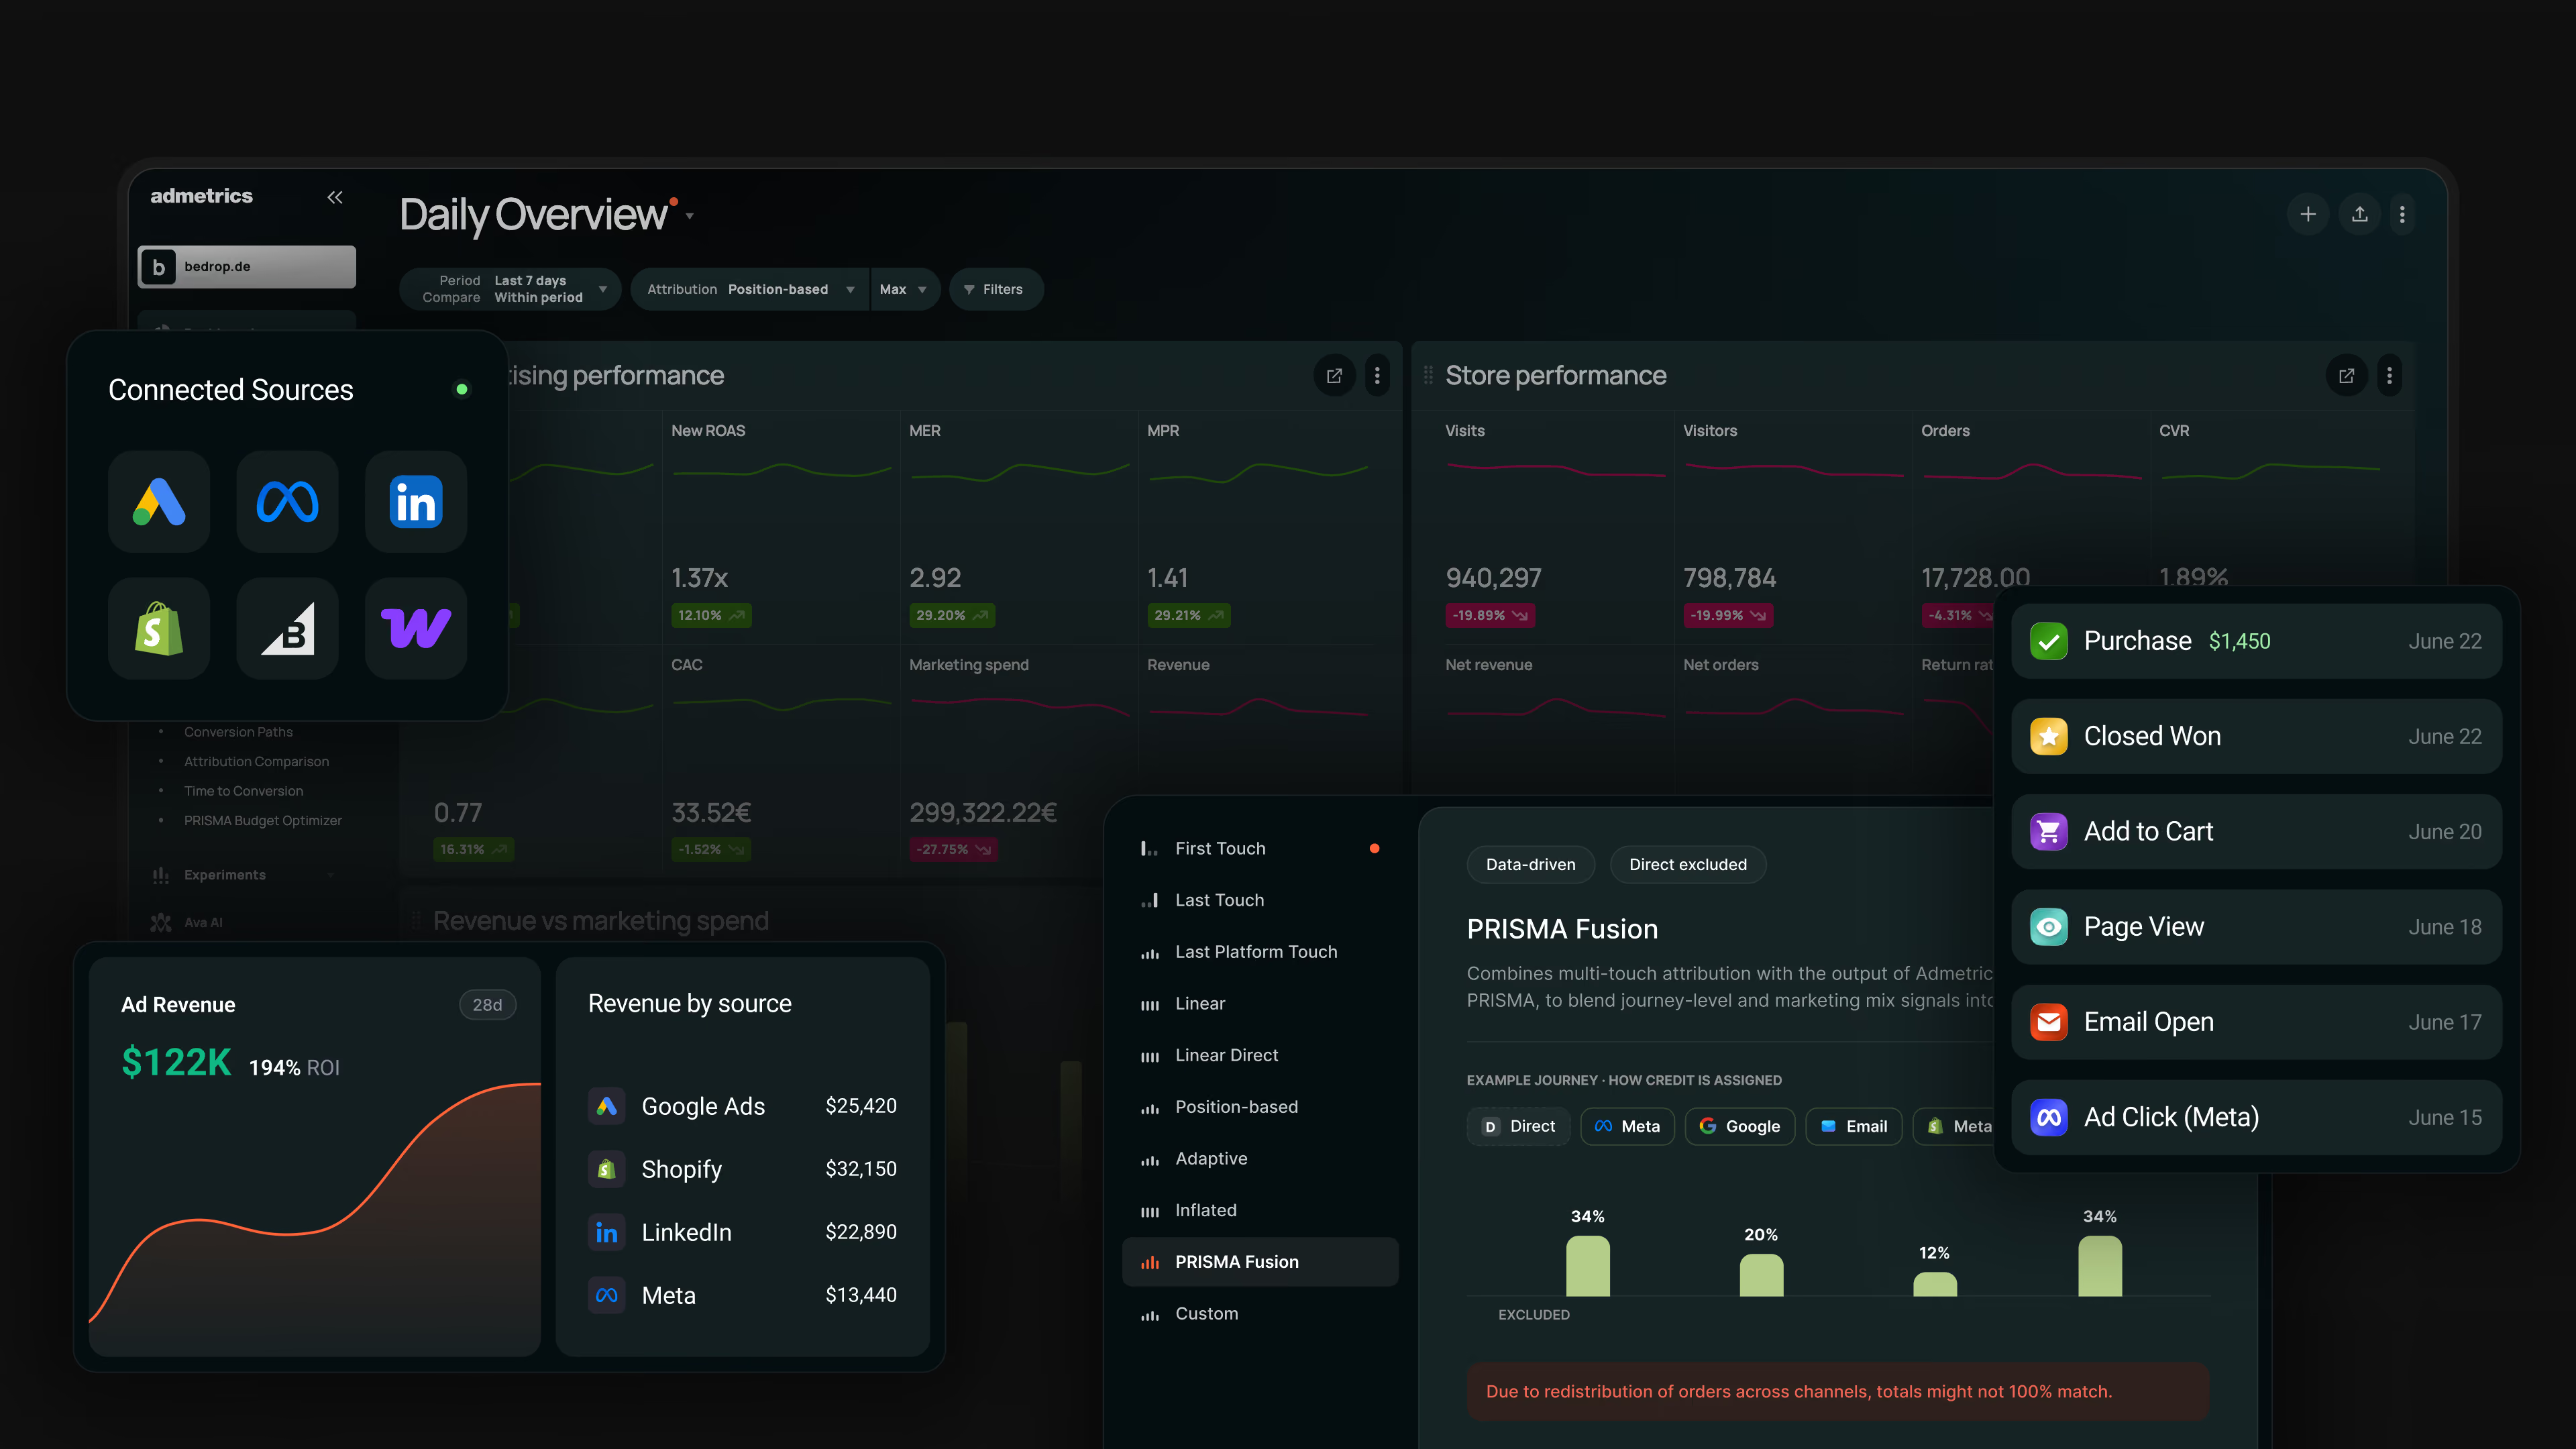
Ask most BI tools what a channel earned and you get revenue. Ask what was left after COGS, shipping, fees and returns, and you get a modeling project someone has to build and keep alive.
Admetrics starts from the other end: a BI layer built around the ecommerce P&L, with a no-code marketing data warehouse, first-party tracking and profit as the default metric. Attribution and mix modeling then turn into budget moves, so the dashboard is the midpoint, not the finish line.
Key features
Strengths
Limitations
Pricing
Admetrics prices against monthly ad spend, not seats. Growth starts at $339/month and covers the first $20,000 of spend, with 1.5% above. Business starts at $764/month, covers up to $70,000 and charges 1% above. Over $100K/month, pricing is custom. Every tier includes a 21 day trial, no card required.Reviews
The G2 profile averages 4.97 out of 5. Reviewers say the numbers hold up under scrutiny and support continues past onboarding. Ehrenkind credited a 60% ROAS increase.Bottom line
Admetrics ships the ecommerce profit model built, then acts on it. For a brand selling physical products with real paid media spend, it's the strongest entry here.2. Power BI
★4.5Best for: A business intelligence tool for Microsoft 365 and Azure shops that want governed, company-wide reporting and have an analyst to model the data.
Power BI is usually the tool a company already owns before anyone asks whether marketing can use it. Microsoft pairs a free desktop authoring app with a cloud service for sharing, now inside Fabric. It connects to almost anything, but it doesn't collect data or decide what profit means: that's whatever your team writes into the model.
Key features
Strengths
Limitations
Pricing
Desktop is free. Pro is $14 per user per month and Premium Per User $24, both since April 2025, when Pro rose from $10. Fabric capacity starts around $263 a month.Reviews
G2 lists Power BI at 4.5 out of 5 across roughly 1,550 reviews. Users praise fast dashboard building and Microsoft integration, and complain about DAX's learning curve and slow large datasets.Bottom line
An affordable, governed reporting layer once your data is modeled. Tracking, attribution, profit logic and budget action come from elsewhere, so pair it with an ecommerce profit tool if paid media is the job.3. Tableau
★4.4Best for: A business intelligence tool for analyst-led teams that need deep visual exploration and polished dashboards, with clean, modeled data to feed it.
Tableau is what analysts reach for when a chart has to do real work. Salesforce owns it now, and it has grown into a stack: Desktop for authoring, Prep for shaping data, Cloud for sharing, Pulse for pushing metric changes to people, and Tableau Next for agentic analytics. The visuals are excellent. The data and the definition of profit stay your job.
Key features
Strengths
Limitations
Pricing
Tableau Cloud Standard runs $75 per user per month for Creator, $42 for Explorer and $15 for Viewer, billed annually. Enterprise is roughly $115, $70 and $35. Tableau+ is quote-based.Reviews
G2 shows Tableau at 4.4 out of 5 across roughly 4,000 reviews. Users rate the visuals highly and complain about a steep curve on advanced features, slow large datasets and license costs that climb with team size.Bottom line
The strongest visual analysis tool on this list, for teams with analysts and clean data. It charts profit only if you build the model, and it never touches the ad account.4. Zoho Analytics
★4.2Best for: A low-cost business intelligence tool for small and mid-size teams, especially Zoho users, that want prebuilt connectors and reports for ecommerce and ad data.
Zoho Analytics is the budget BI option built with marketing and ecommerce in mind. Connectors for Shopify, WooCommerce, BigCommerce, Google Ads and Facebook Ads arrive with prebuilt reports, so a first dashboard exists on day one. What it imports is what each platform reports, refreshed on a schedule, with profit left to formulas you write.
Key features
Strengths
Limitations
Pricing
A free plan covers 2 users, 10K rows and 5 workspaces. Paid plans run from $25 a month (2 users, 500K rows) to $495 (50 users, 50M rows), about 20% less billed annually.Reviews
G2 rates Zoho Analytics 4.2 out of 5 across 288 reviews. Users praise ease of use, integrations and price, and complain about a steep learning curve and limited customization.Bottom line
The best-priced option here for ecommerce and ad reporting out of the box. It reports what the platforms say, on a schedule, and leaves profit, attribution and budget decisions to you.5. Looker Studio (now Data Studio)
★4.4Best for: A free BI reporting tool for marketing and small teams whose data lives mostly in Google products and who need shareable reports without an analyst.
Google reversed its 2022 rebrand in April 2026, so Looker Studio is now officially Data Studio, though buyers still search the old name. It's the free, drag-and-drop reporting tool most marketing teams meet first, and it does one job well: putting Google Analytics, Google Ads and Sheets data on a shareable page. Looker, the enterprise platform, is a separate product.
Key features
Strengths
Limitations
Pricing
Creators and viewers pay nothing. Pro is $9 per user per Google Cloud project per month, with a 30-day trial, and adds team workspaces, more schedules and Gemini features.Reviews
G2 rates it 4.4 out of 5 across 476 reviews. Reviewers like ease of use, Google integrations and sharing, and complain about slow large datasets, limited customization and dropped connectors.Bottom line
The best free way to put Google data on a page. Reconciling platforms, profit logic and budget decisions are left to you.6. Qlik Sense (Qlik Cloud Analytics)
★4.4Best for: An enterprise business intelligence tool for mid-size and large teams exploring complex, multi-source data, with BI developers to model it.
Qlik doesn't query your data so much as index every relationship in it. Click a value and related data lights up while excluded values stay visible in gray, which surfaces gaps filter-first tools bury. Qlik Sense is the client-managed product, and Qlik Cloud Analytics the SaaS edition most new buyers get; this entry covers both. Nothing in it is specific to ecommerce or profit.
Key features
Strengths
Limitations
Pricing
Qlik Cloud Analytics is capacity-priced. Starter is $300 a month for 10 users and 10 GB, Standard $825 for 25 GB with unlimited users, and Premium $2,750 for 50 GB. Enterprise is quoted; on-premises Sense has no public price.Reviews
G2 rates Qlik Sense 4.4 out of 5 across 929 reviews. Users praise ease of use, visualization and quick app building, and complain about limited features, cost and the learning curve.Bottom line
The deepest data exploration and most complete data foundation on this list, for teams with developers. Ecommerce profit, attribution and ad-spend action are still yours to build.7. ThoughtSpot
★4.4Best for: A business intelligence tool for companies with a cloud data warehouse and a data team that want business users to ask questions in plain language.
ThoughtSpot replaced the dashboard request queue with a search bar. A business user types a question, and the platform writes the query against live warehouse data and returns a chart. The catch is upstream: answers are only as good as the semantic model your data team builds first, and that model knows nothing about ecommerce.
Key features
Strengths
Limitations
Pricing
Essentials is $25 per user per month for 5 to 50 users and 25M rows. Pro is $50 per user per month for up to 1,000 users and 250M rows, with metered AI usage. Enterprise is quoted.Reviews
G2 rates ThoughtSpot 4.4 out of 5 across roughly 320 reviews. Users praise ease of use, support and quick answers, and complain about missing features, bugs and limited customization.Bottom line
The best conversational front end on this list, for teams with a warehouse and a modeler. Tracking, profit logic and ad-spend action must be supplied.8. Domo
★4.3Best for: A business intelligence platform for mid-size and large organizations that want connectors, ETL, dashboards and alerts under one roof.
Domo is what a company buys when it wants the whole pipeline in one cloud: connectors to pull data in, visual ETL to reshape it, and dashboards, low-code apps and alerts to push it out. One fact changes the buying conversation: Progress Software completed its $400 million purchase of Domo's AI and data platform business on September 22, 2026.
Key features
Strengths
Limitations
Pricing
Domo publishes no price. It offers a 30-day trial with unlimited users, then a credit-based contract. Third-party trackers estimate roughly $50K a year for small teams and $200K or more for large deployments.Reviews
G2 rates Domo 4.3 out of 5 across 1,092 reviews. Users praise ease of use, visualization and integrations, and complain about the learning curve, missing features, connector reliability and cost.Bottom line
The broadest connector-and-ETL platform on this list, for operations teams that want dashboards, alerts and apps in one place. Profit logic, attribution and ad-spend action are yours to build, and the owner just changed.9. Metabase
★4.4Best for: A low-cost business intelligence tool for startups and lean analytics teams with a SQL-ready database who want simple dashboards non-analysts can use.
Metabase is the BI tool people install on a Friday and use by Monday. It's open source, connects to the database you already have, and gives non-technical users a point-and-click question builder while analysts keep a SQL editor. The trade is scope: it queries data but doesn't collect it, model it for marketing or act on it, so ad data has to land in your database first.
Key features
Strengths
Limitations
Pricing
Open source is free to self-host under AGPL. Starter is $100 a month with 5 users, then $6 per extra user. Pro is $575 a month with 10 users, then $12 per extra, and adds SSO and row-level security. Enterprise starts at $20,000 a year.Reviews
G2 rates Metabase 4.4 out of 5 across 147 reviews. Users praise simplicity, quick setup and value, and complain about limited advanced features and slower performance on big data.Bottom line
The simplest, cheapest BI reporting tool for putting a database on a dashboard. Ad data, tracking, profit logic and budget action are all yours to bring.10. IBM Cognos Analytics
★4.1Best for: An enterprise business intelligence tool for finance-led teams that need governed, pixel-perfect reporting alongside self-service dashboards.
Cognos is the BI platform of record at a lot of big companies, and it shows in what it does best: governed reports that finance and compliance teams can sign off on, with dashboards and an AI assistant layered on top. It's in the 12.1 release line, sold as cloud or on-premises software. None of it is aimed at paid media.
Key features
Strengths
Limitations
Pricing
Cloud on-demand plans list at roughly $10 to $11 per user per month for Standard and $40 to $45 for Premium, depending on source and date. A 30-day trial covers up to 5 users. Hosted and on-premises deployments are quoted.Reviews
G2 rates Cognos Analytics 4.1 out of 5 across 460 reviews, mostly from enterprises. Users credit reporting and governance, and complain about a steep learning curve, slow large datasets, an outdated interface and scheduled rather than real-time data.Bottom line
The strongest governed reporting on this list, for large organizations with IT support behind them. Ecommerce profit, attribution and ad-spend action all have to be built, and that takes a project.The top business intelligence tools for 2026: final verdict
Every business intelligence tool here measures something real. What decides a budget is what happens after the measurement: whether the number turns into a move, or sits in a dashboard someone interprets by hand every week.
Admetrics wins on that line. For an ecommerce brand it runs the whole chain: server-side tracking that survives cookie loss, profit carried through COGS and returns down to SKU, and budget changes that execute with approvals and rollback. The other nine stop earlier.
They still earn a place for narrower jobs. Power BI suits Microsoft shops, Tableau visual analysis, Zoho Analytics cheap store and ad reports, Looker Studio free Google reporting, and Cognos governed enterprise reporting. Qlik Sense and ThoughtSpot suit teams with developers, Domo operations teams, Metabase lean SQL teams. Among the best business intelligence software tools, only a few change which campaign you scale.
If you sell physical products and spend real money on paid media, start with Admetrics and use the other best business intelligence tools here to challenge it. Book a demo, or run a 14 to 21 day trial on your live data and see which campaigns the profit view changes.