Your best-performing creative today will become your biggest budget killer next week. This brutal reality separates profitable DTC brands from those drowning in rising customer acquisition costs, yet most marketing teams remain blind to the problem until their CAC has already doubled. The culprit isn't your targeting, your product-market fit, or even your budget—it's creative fatigue, and the only defense is systematic measurement of creative velocity.
Creative velocity represents the rate at which you produce and deploy new ad creatives relative to your advertising spend, typically measured as new creatives per $10,000 in ad spend per week. While metrics like ROAS, CAC, and conversion rate dominate marketing dashboards, creative velocity operates as the hidden variable controlling all of them. When your creative velocity drops, your costs inevitably rise—not gradually, but exponentially as creative fatigue compounds across campaigns.
The best-performing ecommerce teams don't just track creative velocity; they engineer entire systems around maintaining it at optimal levels. These creative pipelines function like assembly lines, continuously producing concepts, hooks, variations, and formats across awareness stages and creative archetypes. For brands scaling past $50,000 monthly ad spend, creative velocity transitions from nice-to-have insight to operational necessity—the difference between sustainable growth and catastrophic CAC inflation.
Understanding the Brutal Reality of Creative Fatigue
Before diving into creative velocity measurement, you need to understand the enemy it's designed to combat: creative fatigue, the inevitable decay of ad creative performance over time as audiences become desensitized to repeated messaging.
The Creative Fatigue Timeline: 5-7 Days to Decay
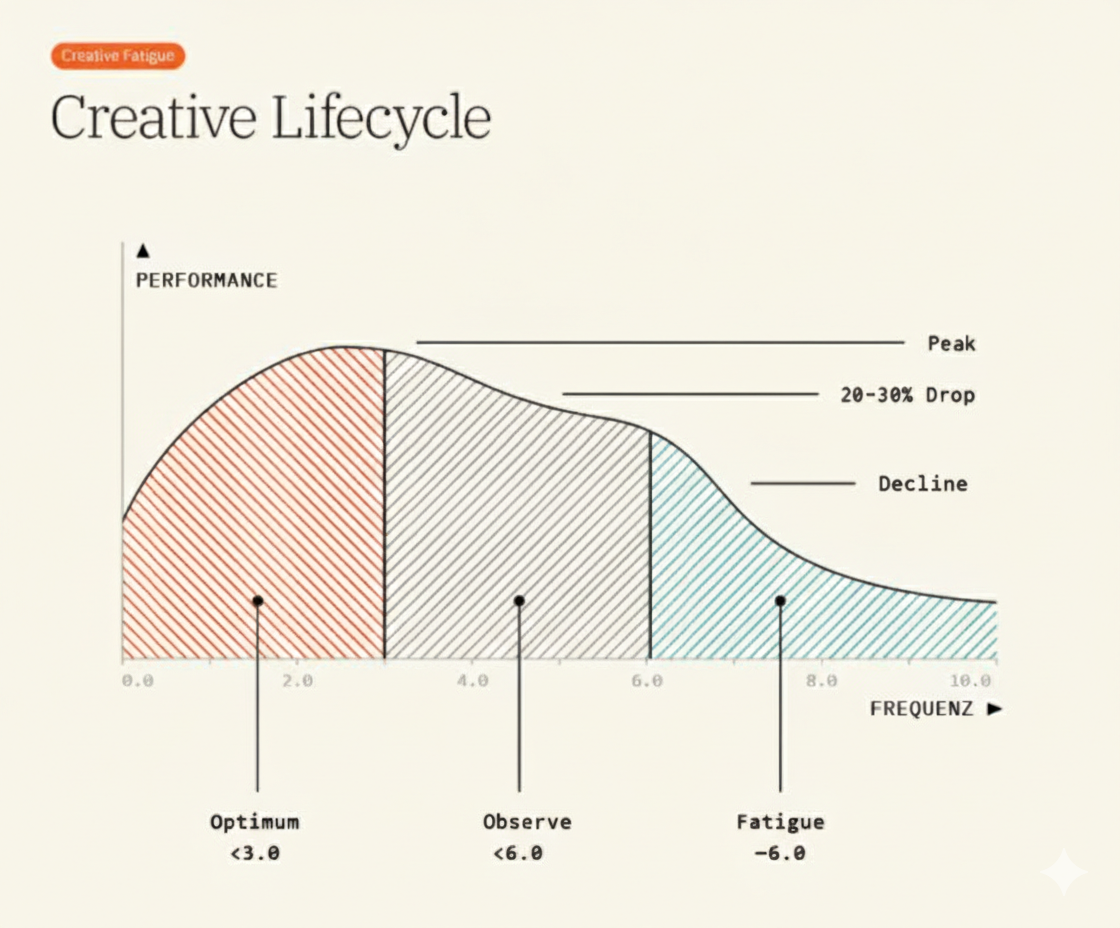
Creative fatigue doesn't gradually erode performance over months—it strikes fast, typically within five to seven days of launching a creative, though the exact timeline varies by platform and audience size. Facebook and Instagram creatives often fatigue faster due to higher frequency and smaller targetable audiences, while Google Display and YouTube can maintain performance slightly longer given broader reach. Learn more about Meta's creative fatigue and similarity score.
The decay follows a predictable pattern that every performance marketer eventually learns to recognize. In the first two to three days, a new creative performs at peak efficiency—high click-through rates, strong conversion rates, and optimal cost per acquisition. Days four through seven show subtle warning signs: frequency begins climbing, CTR starts declining, and CPC edges upward. By day eight through ten, the creative has entered clear fatigue territory: CTR has dropped 30-50%, CPC has increased proportionally, and CAC follows immediately behind.
This timeline creates an urgent operational challenge. If your creative production pipeline can't replace fatiguing creatives within this seven-day window, you're forced to choose between pausing campaigns (losing momentum and volume) or continuing to run deteriorating creatives (accepting rising costs and declining efficiency).
The Cascading Metrics of Creative Decay
Creative fatigue manifests through a specific sequence of deteriorating metrics that savvy marketers learn to identify before CAC spirals:
Frequency increases first: As the same users see your creative repeatedly, ad platforms increase frequency to maintain delivery. This is your earliest warning signal—rising frequency while reach plateaus indicates audience saturation with the current creative.
CTR falls next: Desensitized audiences scroll past your now-familiar creative without clicking. CTR decline typically begins 15-20% below peak performance before accelerating as fatigue worsens.
CPC rises in response: As CTR declines, platforms charge more per click to maintain their revenue targets. CPC increases mirror CTR decreases—a 30% CTR drop typically drives a 30-40% CPC increase.
CAC follows inevitably: Higher CPC combined with potentially declining conversion rates (as the most engaged users already converted) drives CAC upward. This final metric is what finance and executive teams see, but by the time CAC rises visibly, you've already wasted significant budget.
Understanding this cascade is critical because it explains why creative velocity matters economically, not just operationally. The time between creative fatigue onset and CAC impact provides a narrow window for intervention—but only if you're measuring the right leading indicators.
Platform-Specific Fatigue Patterns
While the overall pattern remains consistent, creative fatigue manifests differently across advertising platforms, requiring platform-specific creative velocity strategies:
Meta (Facebook/Instagram): Fastest fatigue cycle due to highly targeted audiences and aggressive frequency. Broad audiences fatigue slower than narrow retargeting segments. Expect five to seven days for cold traffic creatives, three to five days for warm audiences, and as little as two to three days for hot retargeting.
TikTok: Moderate fatigue for native-feeling content, rapid fatigue for obvious ads. The platform's discovery algorithm surfaces creatives to new users longer than Meta, but "ad-like" creatives fatigue quickly. Expect seven to ten days for high-quality native content, four to six days for standard ads.
Google Performance Max: Slower fatigue due to broader reach across properties, but less creative control makes systematic testing harder. Expect ten to fourteen days before visible performance decline, though asset group rotation can extend this.
YouTube: Longest fatigue timeline for video ads due to massive reach, but higher production costs make replacement harder. Expect fourteen to twenty-one days for skippable ads, seven to ten days for non-skippable formats in smaller audience segments.
Pinterest: Extended fatigue timeline due to evergreen content discovery patterns. Creatives can perform consistently for three to four weeks before declining, but the platform requires specific aesthetics that don't always translate from other channels.
These platform differences mean optimal creative velocity varies by channel mix—brands heavy on Meta need higher velocity than those primarily scaling through YouTube.
What is Creative Velocity and Why It Matters
Creative velocity provides the systematic framework for measuring and optimizing your creative production output relative to advertising spend, transforming creative development from reactive scrambling to proactive pipeline management.
The Creative Velocity Formula
Creative Velocity = New Creatives Deployed / $10,000 Ad Spend
This metric is typically reported weekly, though daily tracking provides earlier warning signals for high-spend accounts. The formula's elegance lies in scaling creative output expectations to budget size—a brand spending $20,000 weekly needs twice the creative velocity of a brand spending $10,000 weekly to maintain the same refresh rate.
Minimum threshold: Most successful DTC brands maintain creative velocity of at least 1.0 (one new creative per $10,000 weekly spend). Brands falling below 0.8 consistently show rising CAC within two to three weeks.
Optimal range: Top-performing brands typically operate at 1.5-3.0 creative velocity, deploying 15-30 new creatives weekly per $100,000 in ad spend. This higher velocity enables aggressive testing while maintaining fresh creative rotation.
Excellence threshold: Elite performance marketing teams achieve 3.0+ creative velocity through systematic production pipelines, creator networks, and AI-assisted creation tools. These teams can scale spend aggressively without CAC degradation because fresh creative supply grows proportionally.
Why Creative Velocity Controls CAC
The relationship between creative velocity and CAC isn't correlative—it's causal. Here's the economic logic:
Fresh creatives maintain optimal CPM and CPC: Ad platforms reward novel, engaging content with lower costs. When you consistently introduce new creatives, you access these preferential rates continuously rather than watching costs inflate as fatigue sets in.
Higher velocity enables more aggressive testing: Brands producing twenty new creatives weekly can test ten different concepts simultaneously, quickly identifying winners to scale. Low-velocity competitors testing three creatives monthly spend weeks scaling underperformers before discovering the issue.
Volume creates compounding advantage: As creative velocity increases, your library of proven concepts, hooks, and formats grows. This historical testing data informs future creative briefs, increasing your hit rate on new creatives—a compounding advantage low-velocity competitors can't match.
Velocity prevents emergency scrambling: When creative fatigue hits without fresh replacements ready, you're forced to either accept rising costs or pause campaigns. Both options destroy momentum and profitability. High velocity means you always have tested backups ready to deploy.
The data proves this relationship conclusively. Brands that increased creative velocity from 0.8 to 2.0 while maintaining ad spend constant typically see CAC decrease 20-35% within four to six weeks as fresh creatives consistently outperform fatigued predecessors.
Measuring Creative Velocity Across Dimensions
While overall creative velocity provides a useful benchmark, sophisticated teams measure velocity across multiple dimensions to identify specific bottlenecks:
Channel-specific velocity: Track creative velocity separately for Meta, Google, TikTok, and other channels. Platform-specific fatigue patterns mean optimal velocity varies—Meta might need 2.5 while YouTube operates efficiently at 1.2.
Awareness stage velocity: Measure creative output for cold (awareness), warm (consideration), and hot (conversion) audiences separately. Most brands over-invest in cold creative production while starving retargeting campaigns of fresh content, creating CAC inflation in the most profitable segments.
Format velocity: Track static images, videos, carousels, and other formats independently. Video production bottlenecks often constrain overall velocity even when image production runs smoothly, highlighting where to invest in production capacity.
Concept archetype velocity: Monitor creative velocity across different messaging approaches—problem-solution, product demonstration, social proof, founder perspective, creator content, and competitive comparison. Balanced velocity across archetypes prevents over-reliance on single messaging angles that fatigue simultaneously.
This dimensional analysis transforms creative velocity from a single number into a diagnostic tool revealing exactly where your creative pipeline underperforms.
Building Creative Systems: The Production Pipeline
Achieving high creative velocity isn't about working harder or increasing freelancer budgets—it's about engineering systematic creative production pipelines that generate consistent output regardless of individual inspiration or availability.
The Creative Assembly Line Philosophy
The best-performing teams approach creative production like manufacturing, not art projects. This doesn't mean sacrificing quality for quantity; it means systematizing the process so quality output happens predictably and scalably.
Concept development stage: Generate twenty to thirty creative concepts weekly through structured brainstorming sessions, competitor analysis, customer interview insights, and platform trend monitoring. Concepts should span multiple archetypes and awareness stages to ensure balanced pipeline feeding.
Hook creation stage: Develop three to five hook variations per concept—different opening lines, visual treatments, or value propositions testing the same underlying idea. This multiplication factor (thirty concepts × four hooks = 120 potential creatives) creates the volume needed for high velocity.
Production stage: Execute hooks across formats efficiently through batch production, creator partnerships, UGC programs, and AI-assisted tools. Batch filming ten product demonstration variations in one session costs marginally more than filming one while creating ten times the creative inventory.
Testing stage: Deploy all produced creatives into structured tests with sufficient budget to reach statistical significance quickly. Fast testing cycles (three to five days) enable rapid iteration and prevent tying up creative budget in inconclusive tests.
Scaling stage: Promote winning creatives to larger budgets while archiving underperformers. Maintain active creative rotation even for winning ads to prevent fatigue, gradually introducing fresh alternatives before performance declines.
This pipeline approach means creative production happens continuously and predictably rather than in emergency bursts when current creatives fatigue.
The Six Creative Archetypes for Balanced Velocity
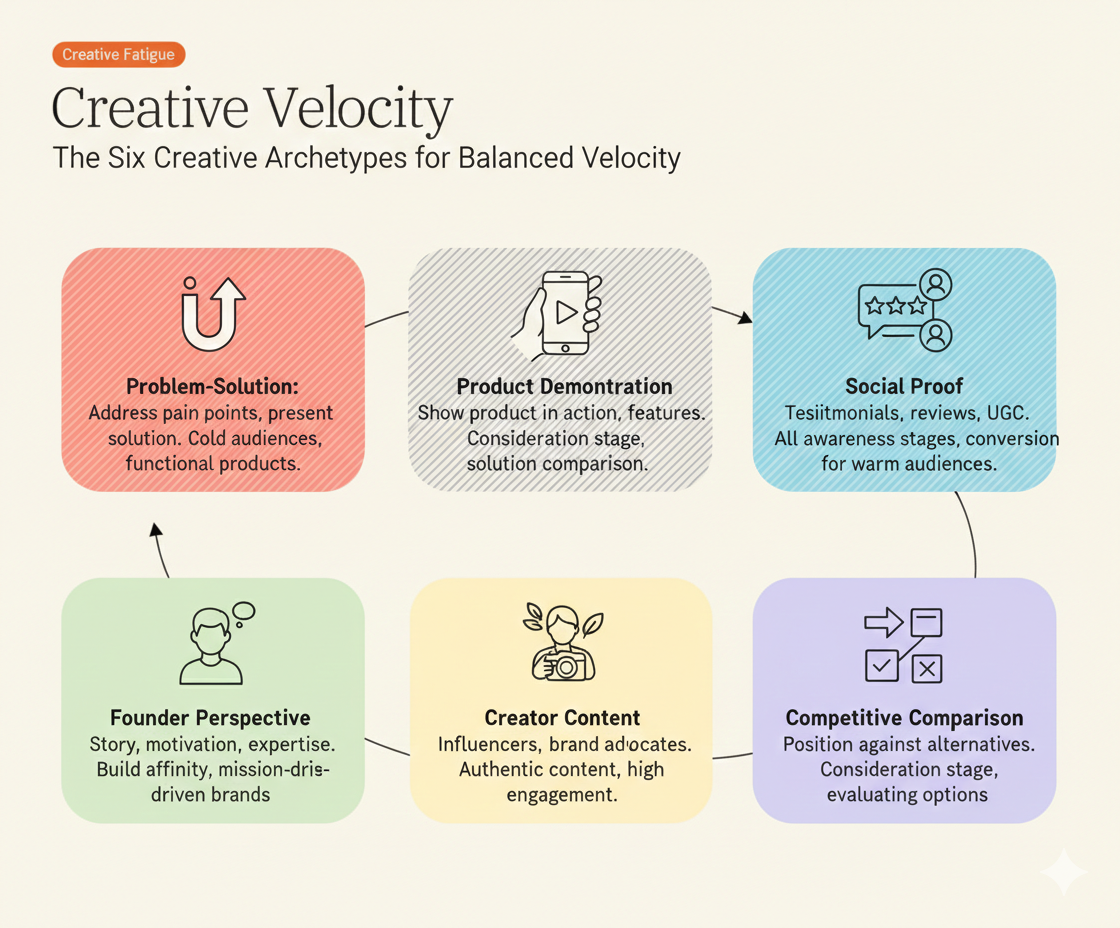
High creative velocity requires structured variety, not random creative spam. The six core creative archetypes provide the framework for systematic concept development:
Problem-Solution creatives: Address customer pain points directly, presenting your product as the solution. These creatives work best for cold audiences discovering problems they didn't realize could be solved and for highly functional product categories where benefits are clear.
Product Demonstration creatives: Show the product in action, emphasizing features, use cases, and results. These creatives excel in consideration stages when audiences understand the problem category but need convincing on your specific solution versus alternatives.
Social Proof creatives: Feature customer testimonials, reviews, user-generated content, and results. These work across awareness stages but particularly drive conversion for warm and hot audiences seeking validation before purchase.
Founder Perspective creatives: Showcase the founder's story, motivation, or expertise. These build brand affinity and trust, particularly effective for mission-driven brands or categories where founder credibility matters (supplements, beauty, certain DTC categories).
Creator Content creatives: Partner with creators, influencers, or brand advocates to produce authentic content. These creatives often achieve superior engagement rates by feeling native to social platforms rather than obviously promotional.
Competitive Comparison creatives: Position your product against alternatives (direct competitors or substitute solutions), highlighting differentiation. These work best for consideration-stage audiences actively evaluating options in your category.
Tracking creative velocity across these archetypes reveals dangerous over-reliance on specific angles. Brands producing 80% social proof creatives with minimal product demonstration or problem-solution content risk simultaneous fatigue across their entire creative library when that archetype loses effectiveness.
Scaling Creative Production Without Proportional Cost Increases
The creative velocity formula's challenge is economic: doubling ad spend theoretically requires doubling creative production, but doubling creative budgets destroys unit economics. High-velocity teams solve this through leverage:
User-Generated Content (UGC) programs: Customers create authentic content at minimal cost. Incentivized UGC programs (contests, affiliate commissions, product seeding) can generate twenty to fifty creatives monthly for $2,000-5,000 investment—a fraction of equivalent professional production costs.
Creator partnership networks: Rather than one-off influencer collaborations, build ongoing relationships with five to fifteen micro-creators who produce regular content. Monthly retainers ($500-1,500 per creator) generate consistent creative volume while creators develop deeper product expertise that improves content quality.
Modular production approach: Film one high-quality base video, then create fifteen to twenty variations through different hooks, outros, captions, music, or cuts. This modular approach generates high creative velocity from single production sessions.
AI-assisted creation tools: Tools for background removal, image variation generation, copy testing, and video editing reduce production time and costs dramatically. What once required designer time can now happen in minutes, freeing creative talent for higher-value concept development.
Systematic repurposing frameworks: Transform long-form content into multiple short-form creatives. A single customer interview becomes ten social proof creatives. One founder story video becomes eight different hook variations. Systematic repurposing multiplies creative output without proportional production increases.
Template-based production systems: Develop creative templates for each archetype that maintain brand consistency while enabling rapid variation. Templates reduce production decisions, accelerating output without sacrificing quality.
These leverage strategies mean creative velocity can scale faster than ad spend, enabling aggressive growth without CAC degradation.
Measuring Creative Velocity with Analytics Platforms
Creative velocity measurement requires tracking capabilities beyond standard ad platform analytics, particularly for brands running campaigns across multiple channels and creative archetypes.
Essential Tracking Infrastructure
To measure creative velocity accurately, your analytics stack must capture:
Creative-level performance data: Individual creative IDs with associated metrics (impressions, clicks, conversions, spend) enable precise fatigue identification and replacement timing. Most ad platforms provide this natively, but centralized tracking across platforms requires integration.
Launch date tracking: Knowing exactly when each creative launched enables accurate fatigue timeline analysis. This metadata often requires manual tracking or custom fields in analytics platforms unless your creative management system automatically timestamps deployments.
Creative archetype and format tagging: Categorizing creatives by archetype (problem-solution, social proof, etc.) and format (video, static, carousel) enables dimensional velocity analysis revealing specific pipeline bottlenecks.
Concept lineage tracking: Understanding which creatives are variations of the same concept versus entirely new ideas separates true velocity (new concepts) from variation velocity (iterations on existing concepts). Both matter, but differently.
Production cost attribution: Tracking creation costs per creative enables efficiency analysis—creative velocity means nothing if each creative costs $5,000 to produce. Cost per creative reveals whether velocity is sustainable or economically irrational.
How Admetrics Enables Creative Velocity Tracking
While many attribution platforms track creative performance, few provide the specific infrastructure required for systematic creative velocity measurement and optimization. Admetrics stands apart by offering creative-centric analytics designed specifically for high-velocity performance marketing teams.
Creative-level attribution: Admetrics tracks performance down to individual creative assets, connecting specific images, videos, headlines, and copy variations to customer acquisition cost, conversion rate, and critically, lifetime value. This granularity enables precise fatigue identification and replacement decisions based on both short-term performance and long-term customer quality.
Fatigue detection algorithms: Rather than manually monitoring frequency, CTR, and CPC trends, Admetrics' AI identifies creative fatigue patterns automatically, alerting teams when specific creatives show early fatigue signals before CAC rises visibly. These proactive alerts enable replacement scheduling before budget waste occurs.
Velocity dashboards: Pre-built reports show creative velocity across overall spend, individual channels, awareness stages, and creative archetypes. These dashboards eliminate manual calculation, making velocity monitoring as simple as checking ROAS or CAC.
Concept performance clustering: Admetrics groups creative variations by underlying concept, revealing which core ideas perform best regardless of specific execution. This insight informs concept development for the next velocity cycle, compounding creative effectiveness over time.
Production efficiency metrics: By tracking creative costs alongside performance, Admetrics reveals cost-per-creative and efficiency-adjusted velocity (new creatives per $10,000 spend normalized by creative production costs), ensuring velocity increases drive profitable scaling rather than just activity.
Cross-platform creative intelligence: Brands running campaigns across Meta, Google, TikTok, and other platforms need unified creative analytics. Admetrics centralizes creative performance data across channels, enabling comparative analysis (which platforms fatigue fastest) and cross-platform learning (successful Meta concepts translated to TikTok).
For teams serious about creative velocity, Admetrics transforms it from a manually calculated metric requiring spreadsheet gymnastics into an always-visible dashboard metric that informs daily optimization decisions.
Implementing Creative Velocity: Operational Frameworks
Understanding creative velocity conceptually differs dramatically from implementing systematic measurement and optimization operationally. Here's how top teams structure their creative operations around velocity.
Weekly Creative Velocity Rituals
High-velocity teams don't measure creative velocity monthly or quarterly—they review it weekly (or daily for very high spend accounts) as part of structured optimization rituals:
Monday velocity review: Start the week reviewing last week's creative velocity across overall account, channels, and archetypes. Identify any dimensions falling below target velocity and diagnose bottlenecks (concept development, production, testing budget allocation).
Tuesday creative planning: Based on velocity gaps and upcoming fatigue (creatives approaching seven-day thresholds), plan this week's creative production priorities. Which archetypes need attention? Which awareness stages are under-served? Which channels need fresh content urgently?
Wednesday production execution: Batch film, design, or coordinate creator content for the week's planned creatives. Batching production into dedicated sessions creates efficiency and ensures weekly velocity targets are achievable.
Thursday testing deployment: Launch new creatives into structured tests with sufficient budget to reach statistical significance by Monday's review. Fast testing cycles (three to five days) enable weekly iteration rather than monthly experimentation.
Friday performance analysis: Review early performance signals from Thursday launches and week-to-date results from Monday launches. Flag fatiguing creatives for replacement next week and identify unexpected winners worthy of accelerated scaling.
This weekly cadence ensures creative velocity never slips unnoticed, with intervention happening before CAC impact becomes severe.
Setting Channel-Specific Velocity Targets
Optimal creative velocity varies by channel based on platform-specific fatigue patterns, creative production costs, and audience dynamics. Here's how to establish realistic targets:
Meta (Facebook/Instagram): Target 2.0-3.0 velocity given rapid fatigue (five to seven days). This means twenty to thirty new creatives weekly per $100,000 spend. High velocity is achievable given relatively low production costs for static images and short-form video.
TikTok: Target 1.5-2.5 velocity, slightly lower than Meta given moderately slower fatigue for native content. Prioritize creator partnerships and UGC to achieve velocity at sustainable costs.
Google Performance Max: Target 1.0-1.5 velocity given slower fatigue but less creative control. Focus on asset group rotation and periodic complete creative refreshes rather than continuous deployment.
YouTube: Target 0.8-1.2 velocity, recognizing higher production costs and longer fatigue timelines. Invest in modular production enabling multiple variations from single filming sessions to achieve velocity economically.
Overall account velocity: Target weighted average of channel-specific velocities based on budget allocation. A brand spending 60% on Meta, 25% on TikTok, and 15% on Google might target overall velocity of 2.2 (60% × 2.5 + 25% × 2.0 + 15% × 1.2).
These targets provide accountability benchmarks, transforming creative velocity from interesting metric to operational imperative.
Diagnosing Low Velocity Root Causes
When creative velocity falls below targets, the problem typically stems from one of several bottlenecks. Systematic diagnosis reveals where to intervene:
Concept development bottleneck: If you're producing all planned creatives but still achieving low velocity, insufficient concept development is the issue. Solution: Implement structured brainstorming sessions, competitor creative analysis, customer insight mining, and trend monitoring to generate more concepts weekly.
Production capacity bottleneck: If you have abundant concepts but can't execute them fast enough, production is the constraint. Solution: Expand creator networks, invest in UGC programs, implement modular production frameworks, or leverage AI-assisted creation tools to increase throughput.
Budget allocation bottleneck: If you have creatives ready but insufficient testing budget to deploy them meaningfully, budget structure is the issue. Solution: Reallocate budget from scaling proven winners to testing new creatives, recognizing that winners eventually fatigue and only fresh testing creates tomorrow's champions.
Testing velocity bottleneck: If creatives launch but testing cycles take weeks to conclude, preventing pipeline flow, testing velocity is the constraint. Solution: Increase testing budgets to reach statistical significance faster (three to five days instead of fourteen to twenty-one days) or accept lower statistical thresholds with larger creative volume.
Creative debt accumulation: If focusing exclusively on new creative production while ignoring archetype balance or awareness stage coverage, you're creating creative debt. Solution: Implement dimensional velocity tracking ensuring balanced production across archetypes, formats, and funnel stages.
Identifying the specific bottleneck enables targeted intervention rather than generically "working harder" on creative production.
The Economic Case for Creative Velocity Investment
Creative velocity requires investment—in production capacity, creator partnerships, analytics infrastructure, and team time. Skeptical finance teams and founders often question whether this investment justifies returns. The economic case is overwhelming.
The Opportunity Cost of Low Velocity
Consider a brand spending $100,000 monthly on ads with current CAC of $50. Creative fatigue drives CAC to $75 over four weeks (a conservative 50% increase), reducing monthly customer acquisition from 2,000 to 1,333 customers—a loss of 667 customers monthly.
If those customers deliver $200 lifetime value (a modest 4x LTV:CAC ratio), the brand loses $133,400 in future LTV monthly due to low creative velocity preventing fatigue management. Annualized, that's $1.6 million in lost customer value from inadequate creative systems.
Now consider the investment required to prevent this: hiring a creative operations manager ($75,000 annually), building a creator network ($30,000 annually), investing in creative analytics like Admetrics ($12,000-20,000 annually), and increasing creative production budget ($50,000 annually). Total investment: approximately $165,000-175,000 annually.
The ROI calculation is straightforward: spend $175,000 to preserve $1.6 million in customer LTV. That's 9.1x ROI before considering that high velocity enables spend scaling (acquiring even more customers at stable CAC) rather than just protecting existing acquisition rates.
Creative Velocity as Competitive Moat
Beyond direct ROI, creative velocity creates sustainable competitive advantage that compounds over time. Competitors can copy your product, match your pricing, and target the same audiences—but they can't instantly replicate your creative systems, historical testing data, and proven concept library.
High-velocity brands accumulate this creative intellectual property continuously. After running 2,000 creative tests over two years while low-velocity competitors run 200, your understanding of what resonates with customers, which concepts work across channels, and how to systematize winning creative production becomes impossible to match. Learn more about ad creative testing.
This knowledge moat enables progressively higher creative hit rates (percentage of new creatives that outperform existing controls), meaning velocity doesn't just maintain performance—it compounds effectiveness. Your twentieth variation on social proof concepts informed by nineteen previous tests dramatically outperforms a competitor's first attempt.
The Cost of Emergency Creative Production
Low velocity forces emergency creative production when fatigue hits unexpectedly. Emergency production costs 2-3x normal production costs through rush fees, premium creator rates for fast turnaround, and suboptimal testing (launching creatives without proper strategy due to urgency).
A brand spending $100,000 monthly on ads experiencing creative fatigue might spend $15,000 on emergency creative production to rescue performance. If this happens quarterly (realistic for low-velocity operations), that's $60,000 annually in premium emergency costs.
Conclusion: Creative Velocity as Operational Imperative
Creative velocity isn't a vanity metric or interesting sidebar—it's the operational imperative controlling customer acquisition costs, enabling sustainable growth, and determining which DTC brands scale profitably versus which burn capital fighting rising CAC. Your best-performing creative today will fatigue within five to seven days, and without systematic creative velocity measurement and management, you're leaving one of marketing's most powerful efficiency drivers to chance.
The best-performing ecommerce teams recognize creative velocity as foundational to their operations, measuring it weekly alongside ROAS and CAC, investing in production pipelines that deliver consistent creative output, and leveraging analytics platforms like Admetrics that make velocity tracking accessible rather than requiring spreadsheet gymnastics. These teams don't just react to creative fatigue—they prevent it through systematic velocity management.
For DTC brands and ecommerce leaders serious about sustainable growth at stable CAC, implementing creative velocity measurement and optimization represents one of the highest-ROI investments available. The frameworks are proven, the tools are accessible, and the economic case is overwhelming: spend $175,000 annually building creative systems or lose $1.6 million in customer LTV to preventable creative fatigue.
Ready to measure and optimize your creative velocity with purpose-built analytics? Start your free Admetrics trial today and access creative-level multi-touch attribution, automated fatigue detection, and dimensional velocity dashboards that transform creative operations from reactive scrambling to systematic pipeline management—no credit card required, full platform access from day one, with white-glove onboarding ensuring you're tracking velocity within days.
Frequently Asked Questions
What is creative velocity and why does it matter?
Creative velocity measures the rate at which you produce and deploy new ad creatives relative to advertising spend, calculated as new creatives per $10,000 in ad spend per week. It matters because creative fatigue inevitably degrades ad performance within five to seven days, driving CAC upward. Without systematic creative velocity measurement and management, brands either scale into rising costs or pause campaigns when creatives fatigue, both destroying profitability and growth.
How is creative velocity calculated for advertising campaigns?
Creative velocity is calculated using the formula: Creative Velocity = New Creatives Deployed / $10,000 Ad Spend, typically reported weekly. For example, a brand spending $50,000 weekly that launches 10 new creatives has creative velocity of 2.0 (10 creatives / 5 units of $10,000). The metric can be calculated for overall accounts or broken down by channel, awareness stage, creative format, or concept archetype to identify specific bottlenecks.
What is the minimum creative velocity needed to prevent CAC inflation?
The minimum creative velocity to prevent CAC inflation is 1.0 (one new creative per $10,000 weekly ad spend), though optimal performance typically requires 1.5-3.0 depending on platform mix and fatigue patterns. Brands consistently falling below 0.8 creative velocity show rising CAC within two to three weeks as creative fatigue compounds across campaigns without fresh replacements. Meta-heavy channel mixes need higher velocity (2.0-3.0) than YouTube-focused strategies (0.8-1.2) due to platform-specific fatigue timelines. Learn more about the best marketing analytics platforms for DTC ecommerce.
How does creative fatigue impact CAC and other performance metrics?
Creative fatigue impacts performance through a cascading sequence: frequency increases first as platforms show the same creative repeatedly, then CTR falls 30-50% as audiences become desensitized, followed by CPC rising proportionally to CTR decline, and finally CAC increasing as higher costs per click combine with potentially lower conversion rates. This sequence typically unfolds over five to seven days on Meta, seven to ten days on TikTok, and ten to fourteen days on Google, making creative replacement urgency platform-dependent.
What tools measure creative velocity for ecommerce brands?
Tools that measure creative velocity for ecommerce brands include Admetrics which specifically offers creative-centric analytics designed for velocity measurement, tracking individual creative performance, automatically detecting fatigue patterns, and providing dimensional velocity analysis across channels, archetypes, and awareness stages—capabilities missing from generic analytics platforms. Discover the best Shopify apps for ad scaling over $50k/month.
How do top DTC brands achieve high creative velocity sustainably?
Top DTC brands achieve high creative velocity sustainably through systematic production pipelines combining user-generated content programs, creator partnership networks, modular production approaches (one base video → fifteen variations), AI-assisted creation tools, template-based production systems, and structured repurposing frameworks. These leverage strategies enable creative velocity scaling faster than ad spend growth, with leading brands producing twenty to thirty new creatives weekly per $100,000 in ad spend at sustainable costs rather than proportionally increasing creative budgets.

