Open & Click Rate Benchmarks help DTC teams make lifecycle performance measurable, comparable, and defensible. That matters because growth reporting gets noisy fast, especially when paid media results swing week to week.
If you lead growth for a €1M+ brand, you need more than dashboards. You need decision clarity. Open & Click Rate Benchmarks give you context, so you can tell the difference between a normal promo dip and a real issue—like inbox placement problems or list dilution. Email and SMS can feel free until they stop working. Then you pay through higher CAC, weaker contribution margin, and more dependence on Meta, TikTok, and Google.
What Open & Click Rate Benchmarks Mean for DTC Growth
Open & Click Rate Benchmarks are reference ranges for engagement. They help you judge whether your emails or texts perform as expected for your list health, deliverability, and offer strength.
To benchmark accurately, you must separate your data by channel and intent. Here is what "good" looks like based on recent ecommerce averages (factoring in the inflation caused by Apple's Mail Privacy Protection):
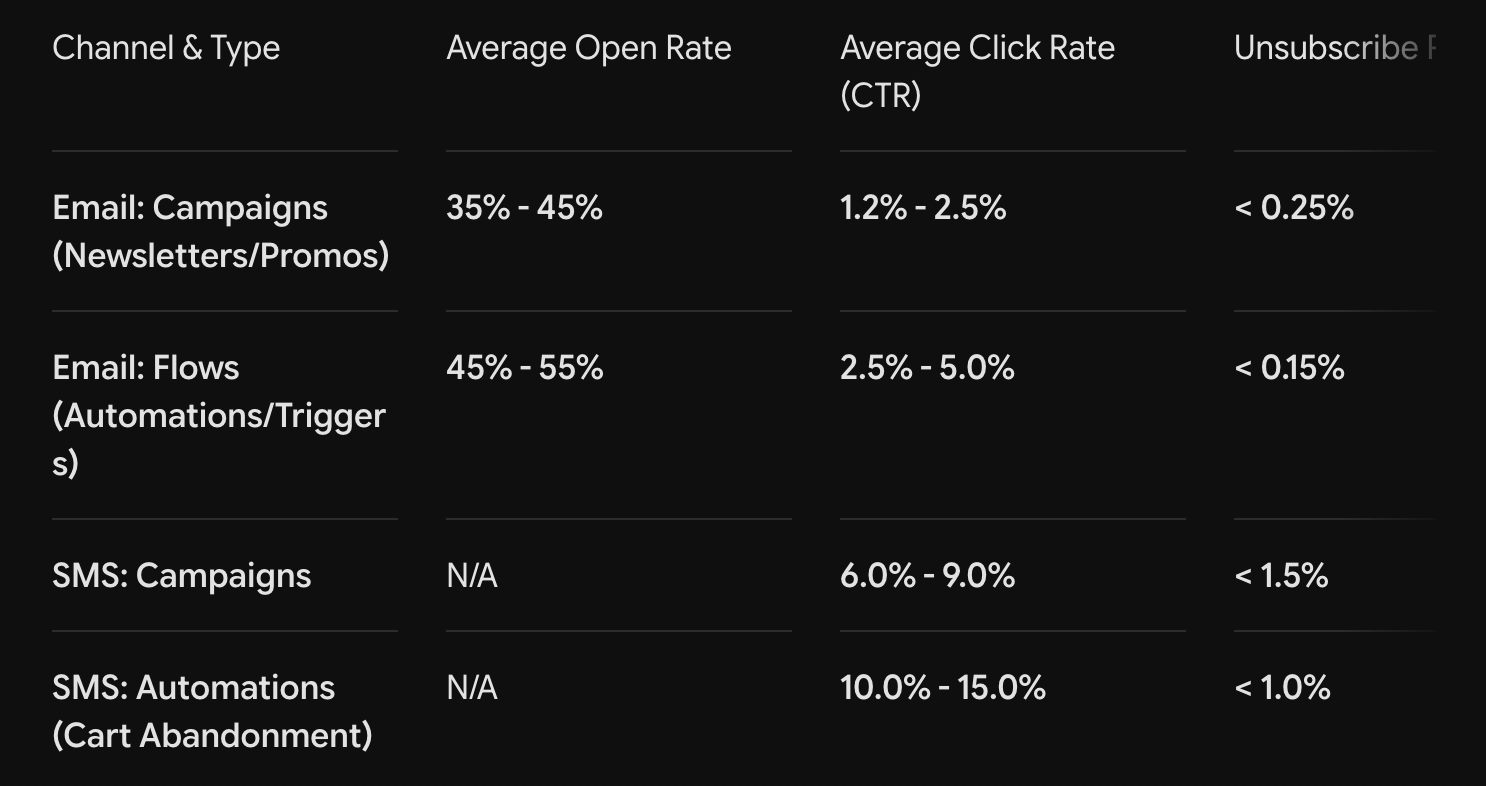
Use these reference ranges to answer two high-value questions:
- Is customer attention stable or slipping?
- Where is the bottleneck in the funnel?
When you pair these benchmarks with revenue per recipient (typically $0.08 - $0.15 for campaigns and $1.00+ for flows), conversion rate, and unsubscribe rate, you can spot risk early and protect your LTV.
Opens vs Clicks: What Each Metric is Really Telling You
Opens mainly signal reach and subject line interest. However, modern inbox features (like Apple MPP) can inflate opens artificially, so treat any open rate above 45% on campaigns as directional rather than absolute.
Clicks signal true intent. Therefore, click rate often correlates better with onsite conversion rate and revenue per recipient. A strong Click-to-Open Rate (CTOR)—the percentage of people who clicked out of those who opened—should sit between 8% and 12%.
A simple diagnostic rule:
- Opens below 30%: Often point to inbox placement issues (spam filtering), weak subject lines, or list fatigue.
- Opens stable but CTR below 1%: Usually points to a message-to-offer mismatch, unclear creative, or a buried call-to-action (CTA).
How to Use Benchmarks to Reduce Wasted Budget
Lifecycle issues rarely stay in lifecycle. If your campaign click rates drop below 1%, you will often see downstream effects within weeks:
- Higher blended CAC because paid ads must work harder to acquire new buyers.
- Lower ROAS due to weaker repeat purchase support from your owned channels.
- Lower LTV because cohorts stop reordering at the expected historical rate.
Benchmarks let you intervene before you compensate with more ad spend.
Improving Experimentation Quality
Instead of random best practices, target the constraint:
- If opens fall below 35%: Test deliverability and relevance.
- Implement list hygiene and sunset unengaged subscribers (e.g., no opens/clicks in 120 days).
- A/B test subject line and preheader strategy.
- Enforce recency and frequency caps.
- If clicks fall below 1.5%: Test offer clarity and conversion path.
- Ensure the message is clear "above the fold."
- Use exactly one primary CTA button.
- Optimize landing page speed and mobile UX.
Getting Started: Build Your Own Benchmarks
Benchmarks work best when they reflect your specific business. Start with a clean baseline, then add segmentation.
Step 1: Define the goal and the KPI stack
Map engagement to business KPIs to stay focused on profit:
- Click rate $\rightarrow$ Onsite conversion rate $\rightarrow$ Revenue per recipient
- Engagement trends $\rightarrow$ Repeat purchase rate $\rightarrow$ LTV
- Lifecycle revenue $\rightarrow$ Blended ROAS and MER (Marketing Efficiency Ratio)
Step 2: Pull a baseline from the last 60 to 90 days
Use recent data. Separate your data so you do not average away the truth (Flows vs. Campaigns, Email vs. SMS, Prospect vs. Customer). Calculate medians, not just averages, to reduce the impact of massive outlier promos (like Black Friday).
Step 3: Normalize measurement so trends stay comparable
- Keep attribution windows consistent (e.g., 5-day click).
- Tag each send by intent, offer type, and segment.
Step 4: Set action thresholds and a response playbook
Set hard guardrails. For example, trigger a team review if:
- Click rate drops below 1.2% for two consecutive weeks.
- Unsub rate spikes above 0.5% after a cadence change.
- Revenue per recipient drops below $0.08 while send volume remains flat.
When to Use Open & Click Rate Benchmarks
Use benchmarks whenever you plan to change spend, creative, or cadence. They are most valuable as a decision tool, not just a reporting ritual.
Quarterly Planning and Channel Mix Decisions
If your core email engagement metrics weaken, scaling paid spend can backfire because CAC rises and payback slows. Conversely, if engagement metrics remain strong (e.g., Flow CTRs holding at 3%+) while paid ROAS fluctuates, demand is likely stable, allowing you to troubleshoot platform tactics without panic.
After Meaningful Operational Changes
Benchmarks shine right after changes like a deliverability warmup, a new segmentation model, or a creative refresh. You can see the impact in days, protecting LTV before cohorts degrade.
Conclusion
Open & Click Rate Benchmarks help you turn engagement into business clarity. By knowing that a 1.5% CTR is standard while a 0.5% CTR is a red flag, you give your team an early warning system for list health, deliverability, and creative fatigue.
Use these benchmarks alongside revenue per recipient, conversion rate, CAC, and LTV to waste less budget and scale with predictable margins.
How Admetrics Can Help
Admetrics connects lifecycle engagement to paid media and revenue outcomes. Instead of celebrating a 50% open rate that never converts, you can see which segments and messages actually lift incremental purchases and improve blended ROAS.
Learn more or book a demo.
FAQ
1. What are Open & Click Rate Benchmarks, and why are they vital for a €1M+ brand?
Open and click rate benchmarks are structured reference ranges that measure user engagement across email and SMS. For a scaling brand, these benchmarks act as an early warning system for your retention funnel. Growth reporting can become heavily skewed by erratic, week-to-week paid media swings. Having strict reference ranges allows growth leads to instantly differentiate between a normal promotional dip and a severe operational threat, such as inbox placement errors or list dilution.
2. How has Apple’s Mail Privacy Protection (MPP) shifted how marketers read open rates?
Apple’s MPP automatically downloads email images in the background for iOS users, which tricks email service providers into tracking a "view" even if the user never opened the message. Because of this artificial inflation, open rates are no longer an absolute source of truth. Treat any campaign open rate above 45% as directional rather than a definitive metric of customer attention, and shift your primary focus downstream to click metrics.
3. What is Click-to-Open Rate (CTOR), and what does it tell me that standard click rate doesn't?
While the standard click-through rate (CTR) measures clicks against your total send volume, the Click-to-Open Rate (CTOR) measures clicks strictly against the subset of users who actually opened the email. A healthy e-commerce CTOR should sit comfortably between 8% and 12%. This metric isolates your content's performance: it tells you if the message, creative layout, and offer successfully matched the expectation set by your subject line.
4. If my email open rates suddenly drop below 30%, what is the underlying issue?
An open rate dropping below the 30% threshold rarely points to a poor subject line alone. It is typically a technical diagnostic signal highlighting inbox placement issues (your emails are being routed directly to the spam folder by Gmail or Yahoo), list fatigue, or an inadequate domain reputation. To resolve this constraint, you must execute immediate list hygiene and sunset unengaged subscribers who haven't opened or clicked an email in 120+ days.
5. What does it mean if my open rates are highly stable, but my CTR drops below 1%?
This pattern indicates that your deliverability and subject lines are successfully getting users through the door, but the post-open experience is failing. A sub-1% CTR typically points to a distinct message-to-offer mismatch. The creative assets inside the email might be cluttered, the primary call-to-action (CTA) may be buried below the mobile fold, or the landing page link path might be causing friction. Ensure your layout features exactly one prominent, clear primary CTA button.
6. How does a decline in lifecycle engagement actively damage my paid ad performance?
Lifecycle marketing problems never stay isolated within email or SMS tools. When your owned channel engagement drops below baseline benchmarks, a negative domino effect ripples through your entire marketing stack:
- Higher Blended CAC: Paid media must work twice as hard (and cost twice as much) to acquire entirely new buyers to hit revenue targets.
- Lower ROAS: Meta and Google campaigns suffer because there is weaker repeat-purchase velocity to support your overall ad spend.
- Decaying LTV: Customer cohorts stop reordering at expected historical intervals, threatening your contribution margins and making your business hyper-dependent on costly ad auctions.
7. What is the step-by-step framework for building our brand's internal benchmarks?
- Step 1: Map the KPI Stack. Connect your email engagement directly to revenue targets to protect profitability ($Click\ Rate \rightarrow Onsite\ Conversion\ Rate \rightarrow Revenue\ Per\ Recipient$).
- Step 2: Pull a 60-to-90-Day Baseline. Extract recent data, separating flows from campaigns. Calculate medians, not averages, to prevent outlier events like Black Friday from distorting your everyday truth.
- Step 3: Normalize the Windows. Keep tracking parameters identical across channels (e.g., utilizing a strict 5-day click attribution window) and tag every send by its strategic intent.
- Step 4: Establish Action Thresholds. Build a clear playbook for your team. Define hard guardrails that automatically trigger a structural review (e.g., a notification if campaign CTR falls below 1.2% for two consecutive weeks).
8. When are these lifecycle benchmarks most valuable to a growth marketer?
Benchmarks should be used as a dynamic decision tool rather than a static reporting ritual. They are most critical during Quarterly Planning and Channel Mix Decisions. If your email benchmarks are weakening, scaling up paid ad budgets will backfire because your conversion funnel is leaking. Conversely, if your flow CTRs are holding strong at 3% or higher while your Meta ROAS fluctuates, you can confidently deduce that consumer demand is stable—allowing you to troubleshoot ad creative without panicking over your product market fit.
9. How do advanced platforms like Admetrics optimize lifecycle marketing data?
Native email marketing dashboards excel at tracking isolated vanity metrics, but they cannot tell you how an email open impacts your cross-channel performance. Admetrics solves this problem by directly connecting your lifecycle engagement data with paid media spend and actual revenue outcomes. Instead of celebrating an inflated open rate that results in zero economic lift, it tracks exact purchase behaviors across Meta, TikTok, and Google to show you which email messages and SMS flows are driving true, incremental revenue and boosting your blended Marketing Efficiency Ratio (MER).