Sporting goods marketing teams live in a high pressure reality. You see performance daily in Meta, Google, TikTok, retail media, affiliates, and lifecycle channels. Yet profit shows up later and often across multiple touches.
A Marketing ROI Calculator for Sporting Goods Manufacturers closes that gap. It connects spend to the KPIs leadership cares about, including incremental revenue, contribution margin, CAC, LTV, and payback period.
Most boardroom conversations do not focus on blended ROAS alone. Instead, they focus on whether growth is profitable, whether payback fits your cash cycle, and whether you are creating incremental demand. A Marketing ROI Calculator for Sporting Goods Manufacturers gives you one consistent model to answer those questions.
What a Marketing ROI Calculator for Sporting Goods Manufacturers actually measures
A Marketing ROI Calculator for Sporting Goods Manufacturers is a practical financial model, not another dashboard. It translates channel activity into business outcomes that drive decisions.
It typically estimates:
* Incremental revenue by channel or program
* Contribution margin after key costs
* CAC and payback period by customer cohort
* LTV and repeat purchase impact over time
Because sporting goods has real operational constraints, the calculator should also reflect the cost of fulfilling demand. For example, expedited shipping, higher return rates on apparel, and warranty costs on equipment can change ROI fast.
Why ROAS is not enough for sporting goods brands
ROAS tells you revenue divided by ad spend. However, revenue does not equal profit.
For many sporting goods brands, gross margin can swing 10 to 30 points across product lines, promo periods, and channels. Therefore, a 3.0 ROAS can look great in a platform dashboard and still fail a contribution margin test.
A good calculator reframes the question from "Did we get sales" to "Did we get profitable, incremental sales within our payback window".
Key KPIs the model should include
If you want a model your CFO trusts, anchor it in shared KPIs.
Include at least:
* Contribution margin: gross profit minus variable costs (shipping, returns, payment fees, pick and pack)
* CAC: new customer acquisition cost, ideally on an incremental basis
* LTV: expected margin over time, not just revenue
* Payback period: days to recover acquisition spend from contribution margin
* Conversion rate: by channel and landing page, since small lifts compound
Who should use this calculator and when
If you lead a brand doing €1M plus in annual revenue, you need a repeatable way to defend and deploy budget. A Marketing ROI Calculator for Sporting Goods Manufacturers makes that easier.
Teams that get the most value
This model helps different roles make faster, clearer calls.
* CMOs and Heads of Growth use it to align budget with contribution margin and payback targets
* Growth marketers and channel leads use it to compare marginal returns across Meta, Google, TikTok, and retail media
* Ecommerce performance leads use it to spot when conversion rate, AOV, or returns are driving the profit gap
The best moments to run the model
Run the calculator before you commit budget, not after results land.
It is most valuable:
- During annual planning and quarterly reforecasts
- Before major seasonal pushes like back to school and holiday
- Ahead of product drops where demand and inventory risk spike together
- After tracking changes or major creative refreshes, since attribution often shifts
Additionally, use it when you launch a new channel or retail partnership. You can set CAC guardrails early, which prevents spend from becoming a habit.
How to build a Marketing ROI Calculator for Sporting Goods Manufacturers (step by step)
You can start simple and improve accuracy over time. The goal is speed with discipline.
Step 1: Use business reality inputs, not platform totals
Start with the last 90 to 180 days, then match spend to net economics.
Gather:
* Channel spend across Meta, Google, TikTok, affiliates, retail media
* Net revenue, not gross revenue
* COGS and gross margin by category
* Shipping and fulfillment costs
* Returns and warranty rates
* Discount depth and promo leakage
Then set a KPI hierarchy. For example, prioritize contribution margin and payback period first, then use ROAS as a supporting signal.
Step 2: Separate attribution from incrementality
Platform reported ROAS often over credits retargeting and branded search. Meanwhile, prospecting can look weak even when it drives net new demand.
So, split your model into two layers:
* Measured performance: what platforms report
* Incremental performance: what lift tests, holdouts, or geo splits suggest
If you do not have lift tests yet, start with blended CAC and MER as baseline checks. Next, improve the model as you run experiments.
Step 3: Model scenarios you can actually execute
A calculator only helps if it changes actions. Therefore, focus scenarios on levers your team controls weekly.
Common levers include:
* Prospecting versus retargeting mix
* Creative volume and refresh cadence
* Bid strategy shifts
* Landing page conversion rate improvements
* Budget reallocation across platforms
Finally, create a weekly update cadence for spend and outcomes. Pair that with a monthly strategic review so you can reset assumptions with real data.
Turning channel data into board level profit clarity
A Marketing ROI Calculator for Sporting Goods Manufacturers becomes your shared language across marketing and finance. It removes single metric arguments and replaces them with a structured view of profit and risk.
When measurement fragments across channels, teams can chase local maxima inside each platform. However, leadership needs a blended answer: incremental contribution margin within an acceptable payback window.
This matters even more in sporting goods because:
* Seasonality changes conversion rate and CAC quickly
* Product mix shifts margins dramatically
* Promotions can inflate revenue while shrinking profit
* Stockouts and expedited shipping can erase gains
As a result, the calculator keeps planning grounded. You can scale when marginal profit supports it, and you can pull back early when payback breaks.
Conclusion
A Marketing ROI Calculator for Sporting Goods Manufacturers helps you run marketing like a profit center. It connects Meta, Google, TikTok, retail media, and lifecycle activity to incremental revenue, contribution margin, CAC, LTV, and payback.
If you want fewer wasted budgets and more confident scaling, make ROI a planning constraint. Then, update the model weekly and refine assumptions with incrementality tests over time.
How Admetrics can help
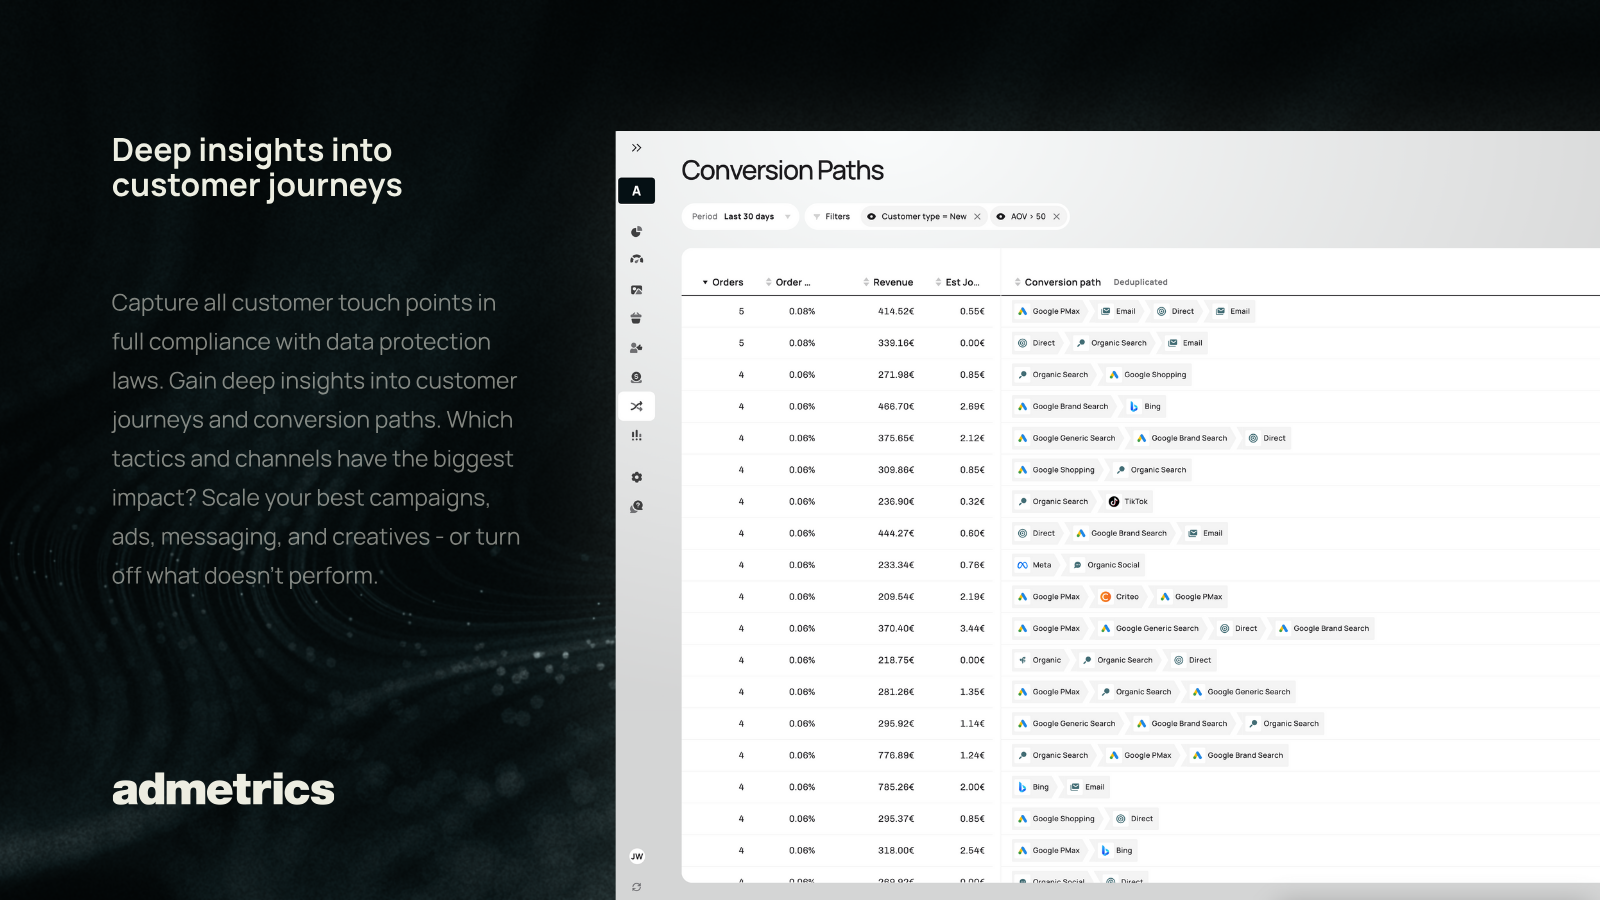
Admetrics strengthens a Marketing ROI Calculator for Sporting Goods Manufacturers by improving the quality of your inputs. Instead of relying on last click bias, you get multi touch attribution and incrementality insights that reflect how channels work together.
That means you can:
* Quantify marginal revenue by channel
* Understand when branded search captures demand versus creates it
* Forecast budget shifts with more CFO ready logic
FAQ
What is a Marketing ROI Calculator for Sporting Goods Manufacturers?
It is a decision model that links marketing spend to incremental revenue, contribution margin, CAC, LTV, and payback period. It helps teams judge profitable growth, not just reported ROAS.
Which inputs matter most in the calculator?
Media spend, conversion rate, AOV, gross margin, variable costs (shipping, returns), new versus returning customer mix, and repeat rate. Additionally, attribution and incrementality assumptions heavily shape outputs.
How does it handle multi touch attribution across channels?
It uses blended performance by channel mix and allows credit splits based on your MTA view. However, the best approach pairs MTA with incrementality testing to avoid over crediting lower funnel touchpoints.
Can it account for incrementality, not just platform ROAS?
Yes. You can override reported ROAS using lift test results, holdouts, or geo experiments to estimate iROAS. Then the model ties that incremental revenue to margin and payback.
What is the difference between ROAS and ROI in this calculator?
ROAS measures revenue divided by ad spend. ROI reflects profit impact by incorporating margin, variable costs, and timing, which makes payback and cash efficiency visible.
How should sporting goods brands treat seasonality?
Use monthly cohorts and separate peak periods from baseline months. Otherwise, seasonal CAC spikes and promo driven AOV changes can blur what really drives LTV and payback.
Does it work for ecommerce and DTC sporting goods hybrids?
Yes. Model DTC contribution margin and wholesale contribution separately. That prevents false payback assumptions when channel margins and payment terms differ.
How does the calculator support budget allocation decisions?
It compares marginal profit and payback across channels and scenarios. As a result, you can scale the highest incremental contribution margin first instead of chasing the best reported ROAS.
What payback window should we use?
Match your cash cycle and inventory risk. Many DTC teams target 30 to 90 days, while brands with strong repeat purchase behavior can justify longer windows.
How do we include promotions and discounting?
Adjust AOV and gross margin to reflect promo depth, and include higher return risk if applicable. Then your ROI reflects real profit, not inflated topline revenue.
How often should we update the Marketing ROI Calculator for Sporting Goods Manufacturers?
Update weekly for pacing and guardrails, then reset assumptions monthly. Also update after major changes like tracking shifts, new offers, or large creative refreshes.