Email vs. Social Media ROI Statistics 2026 matters because DTC teams no longer get rewarded for activity. You get rewarded for profitable growth you can explain. In 2026, platform reporting still helps, but it rarely meets finance grade standards.
That gap creates real tension. Your dashboards may say ROAS looks strong, while your CFO sees CAC rising and cash payback slowing. Email vs. Social Media ROI Statistics 2026 gives you a shared language to translate channel choices into contribution margin, payback windows, and risk.
Just as important, it reduces channel politics. Email and social can both look like heroes in last click. However, they often share credit for the same customer journey.
Email vs. Social Media ROI Statistics 2026: the decision grade definition
Email vs. Social Media ROI Statistics 2026 is a practical set of measures that helps you compare profit impact across owned email and paid or organic social under 2026 measurement constraints.
Instead of debating clicks, followers, or platform conversions, you compare outcomes that map to the P and L:
- Incremental revenue per euro invested
- Incremental contribution margin, not just topline revenue
- Payback speed by cohort
- Impact on blended CAC and LTV
- New customer rate versus returning customer capture
Most teams get better decisions when they anchor these stats to incrementality. Otherwise, both channels can “win” while simply reallocating credit for demand that would have converted anyway.
Who should use these ROI statistics and why
Email vs. Social Media ROI Statistics 2026 helps anyone who must defend budget shifts with evidence.
DTC founders and finance leaders
You need clarity on cash flow timing, not vanity metrics. Therefore, you care about payback windows, contribution margin, and whether growth comes from new demand or demand capture.
CMOs and growth leads
You need a narrative that holds up in a board meeting. That means tying channel bets to blended CAC, LTV quality, and risk concentration across platforms.
Performance and lifecycle marketers
You make weekly trade offs on creative, audiences, and automation. As a result, you need marginal ROI, not just historical averages.
The real world trade offs: email versus social in 2026
Both channels work. They just win in different conditions.
Email strengths and constraints
Email usually shines on efficiency because you own the reach and marginal costs stay low. However, email performance depends on list quality and deliverability.
Email tends to perform best when:
- You trigger messages from high intent behavior such as browse, add to cart, or replenishment
- You protect inbox placement and sender reputation
- You segment by intent and predicted LTV
Key email KPIs to track:
- Revenue per recipient
- Conversion rate by segment
- Incremental lift via holdouts
- Repeat purchase rate and LTV by cohort
Social strengths and constraints
Paid social drives scale and learning. It also creates demand you can later monetize through owned channels. Still, CPM volatility, creative fatigue, and attribution noise can distort true ROI.
Social tends to perform best when:
- You need reach for a launch or category expansion
- Creative iteration is your main lever
- You want to grow your prospecting pool and subscriber base
Key social KPIs to track:
- CAC and payback window by cohort
- Incremental ROAS from lift tests
- New customer rate and first order margin
- Creative level CVR and cost per acquisition
How to measure ROI without getting trapped by attribution
Most DTC teams do not have a data problem. They have a decision problem. They compare numbers that were calculated with different rules.
Use this workflow to make Email vs. Social Media ROI Statistics 2026 comparable.
Step 1: pick one financial goal for the quarter
Start with the decision you need to make. For example, “Should we move 15 percent of budget from prospecting to lifecycle?”
Then choose one primary outcome:
- Incremental contribution margin
- Blended CAC reduction
- Faster payback window
- Higher LTV, not just higher AOV
Step 2: standardize conversion windows and definitions
If one channel uses 7 day click and another uses modeled view through, you will argue forever. Therefore, align on:
- Conversion windows
- New customer definitions
- Refund and cancellation handling
- Margin assumptions
Step 3: use MTA for direction, then prove causality
Multi touch attribution helps you spot patterns. However, it cannot prove incrementality on its own.
Validate with:
- Geo holdouts
- Audience holdouts for email flows
- Platform lift tests where available
Step 4: report marginal ROI, not just blended averages
Blended ROAS can look healthy while marginal ROAS collapses. So build a weekly view that highlights:
- Spend and reach
- Incremental lift estimates
- Marginal ROAS and marginal CAC
- Payback trend by cohort
When to lean into email vs. when to lean into social
Timing often drives ROI more than channel preference.
When email usually wins
Email tends to win when intent is high and the path to purchase is short. In addition, it becomes easier to test incrementality with holdouts.
Prioritize email when you can trigger messages from:
- Cart and checkout abandonment
- Back in stock and price drop events
- Post purchase cross sell and replenishment
- VIP and loyalty milestones
When social usually wins
Social tends to win when you need volume and learning. It also performs well when creative testing drives differentiation.
Prioritize social during:
- New product launches
- Expansion into new audiences or geos
- Prospecting pushes to grow your subscriber base
If CPMs rise or tracking degrades, shift emphasis toward email capture and conversion. Then use social to refill the funnel.
A budgeting framework DTC teams can defend
Email vs. Social Media ROI Statistics 2026 becomes useful when it turns into a repeatable allocation rule.
Use this simple framework:
- Fund the growth engine: allocate enough paid social to hit new customer volume targets at acceptable CAC.
- Capture and compound: invest in email flows that convert paid traffic and improve payback.
- Reallocate based on marginal returns: move spend only when marginal ROAS or marginal CAC clearly improves.
- Protect long term value: optimize for LTV and contribution margin, not just short term ROAS.
This approach keeps your team aligned. It also reduces the risk of over indexing into one platform when conditions change.
Conclusion
Email vs. Social Media ROI Statistics 2026 is not about proving one channel is “better.” It is about making budget choices you can defend with incrementality, CAC, LTV, and payback.
When you compare channels on contribution margin and causal lift, you stop debating dashboards. Instead, you start scaling what actually grows profit.
How Admetrics can help
Email vs. Social Media ROI Statistics 2026 only becomes decision grade when you can separate correlation from incrementality across journeys that start on Meta or TikTok and convert later via email.
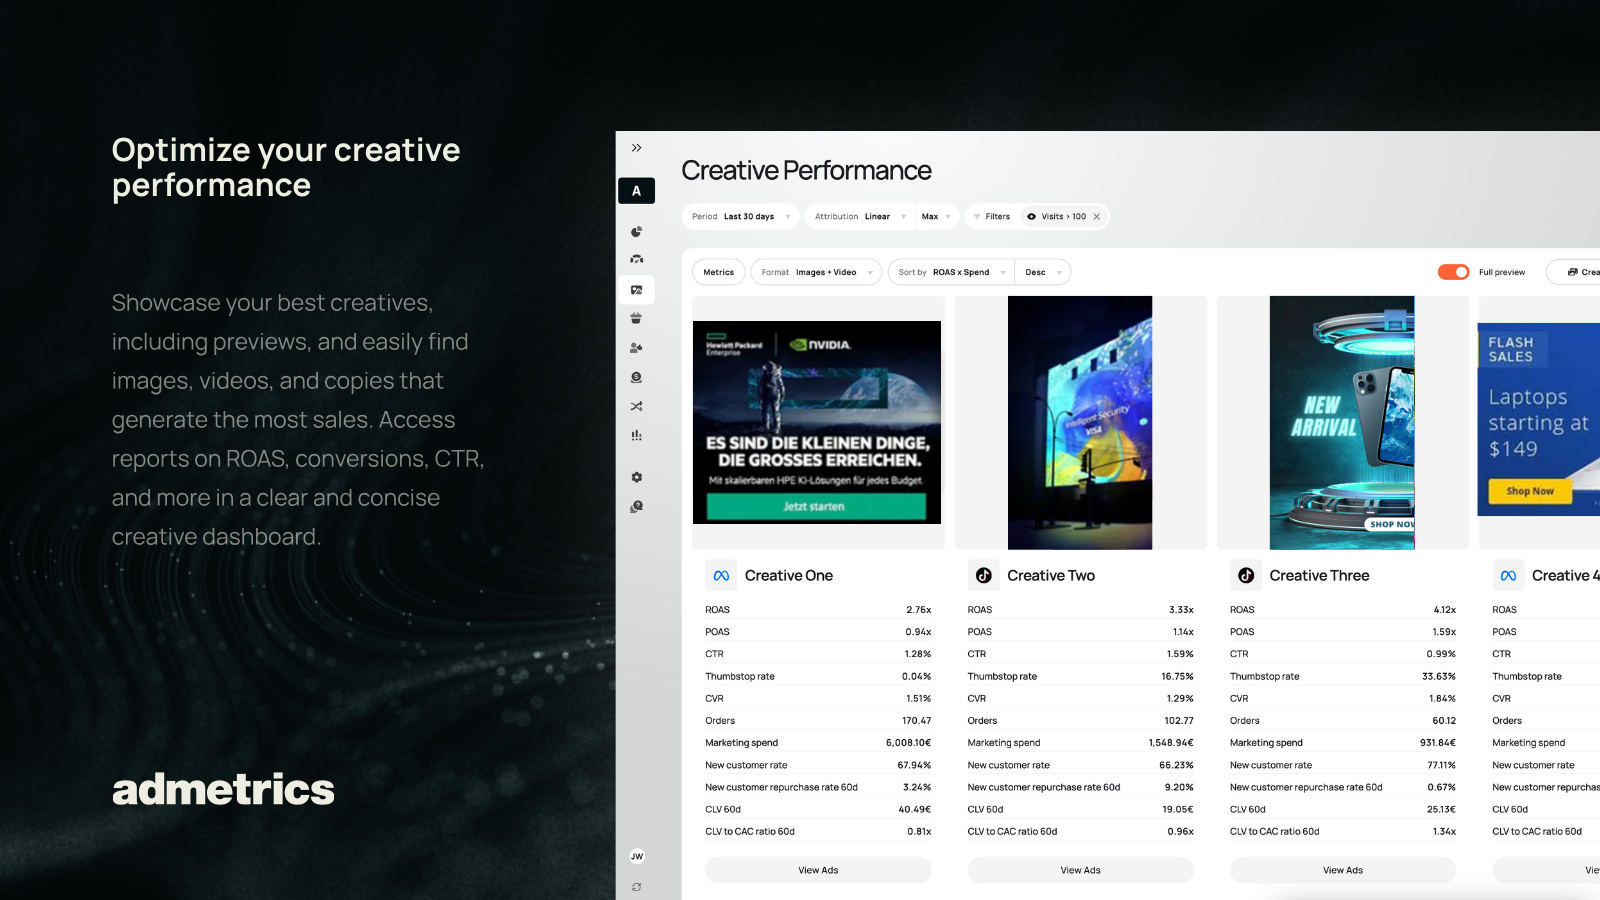
Admetrics helps DTC teams unify measurement across paid social, Google, and lifecycle. You can quantify true lift with incrementality testing and align reporting with finance outcomes like blended CAC, ROAS, and payback.
If you want channel level answers you can act on, book a demo.
FAQ
What does ROI mean in Email vs. Social Media ROI Statistics 2026?
ROI means incremental profit from a channel divided by its total cost. For DTC, that usually means contribution margin, not just revenue, compared against media spend and operating costs.
Which channel wins in Email vs. Social Media ROI Statistics 2026?
Email often wins on efficiency and payback speed. Social often wins on scale and new customer discovery. The right answer depends on incrementality and marginal returns.
Why does email often look stronger in Email vs. Social Media ROI Statistics 2026?
Email has owned reach and low marginal costs, so reported ROI can look high. However, it can over claim credit if it captures demand created by paid social.
Why can social look weaker in Email vs. Social Media ROI Statistics 2026?
Social journeys often start earlier in the funnel, so last click undercounts its impact. Higher CPMs and creative fatigue can also compress short term ROAS.
How should CMOs compare email and social ROI in 2026?
Use a blended view such as MER for pacing, then validate channel impact with incrementality tests. Also track CAC, LTV, and payback by cohort so you optimize for profit.
What attribution model fits Email vs. Social Media ROI Statistics 2026?
Use multi touch attribution for directional insight. Then confirm causality with holdouts, geo tests, or platform lift studies.
How do I avoid double counting conversions across email and social?
Set consistent channel rules, deduplicate conversions, and prioritize incrementality over credit splits. Holdouts help you quantify true lift when channels overlap.
Which metrics matter most for email and social in 2026?
For email, focus on incremental lift, revenue per recipient, conversion rate by segment, and LTV. For social, focus on CAC, incremental ROAS, new customer rate, and payback window.
What should teams do next after reviewing Email vs. Social Media ROI Statistics 2026?
Align on one source of truth, standardize measurement rules, and run at least one incrementality test per quarter. Then reallocate budget based on marginal profit, not platform reported ROAS.