Budget conversations in ecommerce have fundamentally shifted from channel preference to hard financial proof. Meta CPMs are volatile, Google demand capture is increasingly expensive, and TikTok performance swings wildly with every new creative trend. Consequently, relying on last-click ROAS no longer provides leadership with the confidence required to scale.
This is exactly why CLV Email Marketing Statistics 2026 matter. This framework transforms email marketing from a tactical debate about open rates and click-throughs into a robust financial model. It allows you to answer the questions that genuinely drive business growth: Are we increasing customer lifetime value (CLV)? Are we improving contribution margins? Are we shortening our CAC payback periods?
For Direct-to-Consumer (DTC) operators, adopting this mindset allows you to scale without burning out your list. Instead of blasting campaigns and praying deliverability holds, you can prioritize the automated flows and segments proven to lift 90-day, 180-day, and 365-day CLV.
What "CLV Email Marketing Statistics 2026" Actually Means
In practice, this approach is a collection of metrics and benchmarks that tie your lifecycle email strategy to durable business outcomes. It treats email as an owned growth engine that actively shapes:
- Repeat purchase rates
- Time elapsed between purchases
- Average Order Value (AOV)
- Refund rates and margin mix
Simply put, it helps you evaluate your email program the exact same way a CFO evaluates a capital investment: focusing on incremental lift and payback, not just platform-reported revenue.
Real-World Stats Driving the Retention Shift
To understand why CLV and email are deeply intertwined in 2026, consider these foundational industry statistics:
- The Baseline ROI: According to continuous tracking, email marketing consistently delivers an ROI of roughly $36 to $40 for every $1 spent, making it the highest-leverage retention channel available.
- The Power of Retention: Classic data from Bain & Company and Harvard Business School shows that increasing customer retention rates by just 5% increases profits by 25% to 95%.
- The Revenue Imbalance: Smile.io reports that while repeat customers often make up only 8% of a store's site traffic, they can account for 40% or more of total revenue.
- The First 30 Days: Klaviyo's benchmark data consistently highlights that welcome series and cart abandonment flows convert at 3x to 5x higher rates than standard promotional campaigns, proving that the earliest lifecycle interventions drive the highest CLV improvements.
The CFO-Approved KPI Framework
If you want your email reporting to survive a rigorous budget review, anchor your dashboards to these specific KPIs:
1. Core Financial Metrics
- Cohort CLV: Measured strictly at 90, 180, and 365 days.
- Incremental Revenue Lift: Validated using control/holdout groups.
- Gross Profit Attribution: Tracking the actual profit generated by lifecycle cohorts, not just top-line revenue.
- CAC Payback Period: Sliced by acquisition source and email engagement tier.
- LTV:CAC Ratio: Measured by specific customer cohorts.
- Conversion & Repeat Purchase Rates: Tracked by lifecycle exposure.
2. Predictive Deliverability Metrics
Deliverability inputs are the leading indicators of future financial performance:
- Complaint and unsubscribe rates
- Inbox placement vs. spam folder rates
- Click-to-open rate (CTOR) trends by segment
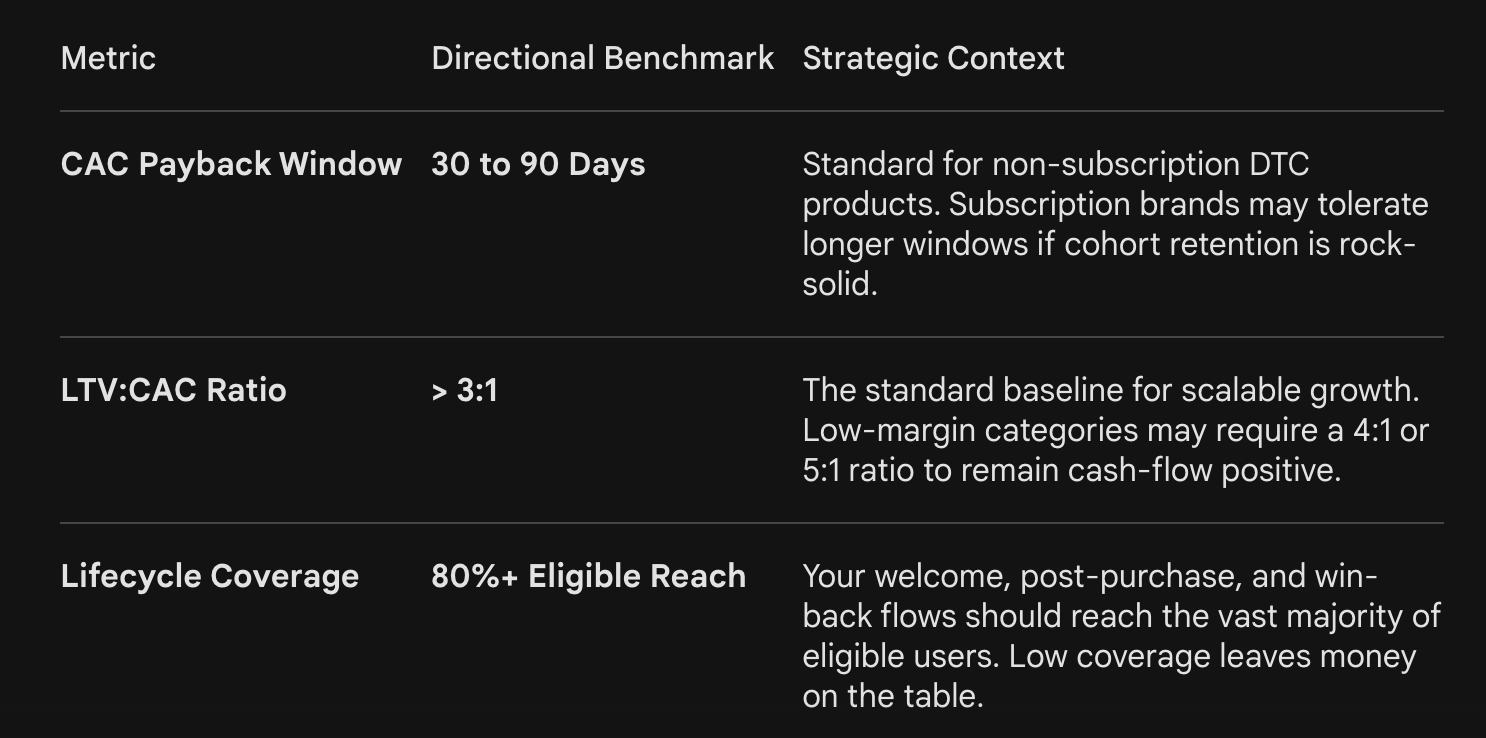
DTC Benchmarks: What Does "Good" Look Like?
Benchmarks naturally vary based on your category, margin profile, and repurchase cycle. However, you can use these directional guardrails to spot gaps in your strategy:
A 3-Step Plan to Implement CLV-Driven Email
Start by mapping your metrics directly to business decisions; otherwise, you're just building dashboards that look impressive but change nothing.
Step 1: Define the Business Decisions to Unlock
Use this data to answer critical questions:
- How much CAC can we actually afford by channel and creative theme?
- Which lifecycle programs deserve increased budget and resourcing?
- Where can we cut ad spend without shrinking future profits?
Step 2: Standardize Your Customer Event Data
Email CLV measurement breaks down when systems disagree. Ensure absolute consistency across your ESP, ecommerce platform (e.g., Shopify), and analytics tools for:
- First purchase date and acquisition source.
- Order margin inputs (COGS, shipping, discounts, refunds).
- Subscription events (pause, skip, cancel).
- Universal customer identifiers unifying web, email, and ad clicks.
Step 3: Build a Measurement Spine for Incrementality
Establish a repeatable method that avoids "attribution turf wars" between departments:
- Run holdout tests for all major flows and campaign programs.
- Track cohort CLV by acquisition source and first-order product.
- Use fixed windows (30, 60, 90, and 180 days) perfectly aligned with your product's natural repurchase cycle.
The First 30-Day Playbook: Fix deliverability first. Then, improve the welcome experience to set expectations, strengthen post-purchase education to reduce refunds, and build win-back flows that protect margins (avoiding heavy discount conditioning).
Connecting the Dots with Admetrics
CLV reporting is only valuable if you can definitively trust what caused the lift. Admetrics connects first-party customer events with ad platform data across Meta, Google, TikTok, and your email platforms.
By unifying this data, you can accurately model multi-touch journeys, quantify true incrementality, and identify exactly which cohorts improve payback periods, repeat rates, and margins.
- Align ROAS, CAC, and LTV in one cross-channel view.
- Build LTV tiers to feed back into ad platforms for smarter bidding.
- Reduce wasted spend by identifying channels that look profitable on a last-click basis but fail on long-term payback.
Ready to scale with confidence? Book an Admetrics demo today.
Frequently Asked Questions (FAQ)
What are CLV Email Marketing Statistics 2026 used for?
They link lifecycle email activity directly to customer lifetime value, incremental gross profit, and CAC payback. This helps marketing leaders fund programs based on durable financial outcomes rather than vanity metrics like open rates.
Which metric connects email to CLV the fastest?
90-day cohort CLV is your best leading indicator, especially when optimizing welcome and post-purchase flows. Pair this with holdout-based incremental revenue to measure true lift.
How do I prove CLV impact when cross-channel attribution is messy?
Stop relying on last-click revenue. Instead, use holdout tests for your email flows and run cohort comparisons based on the original acquisition source. Report on incremental gross profit lift and improvements in CAC payback.
What timeframe should I use for CLV measurement?
Rely on 90-to-180-day windows for rapid decision-making, and then validate those trends with 12-month historical cohorts. Let your product's natural repurchase cycle dictate the exact windows.
How should CMOs use this data for budgeting?
Set strict CAC ceilings based on cohort LTV and payback windows. Then, aggressively allocate budget to the acquisition programs and retention flows that improve contribution margin the fastest.
What should marketers prioritize first to improve CLV via email?
Always start with deliverability and list hygiene—poor inbox placement artificially caps the performance of everything else. Next, optimize your welcome and post-purchase flows using structured A/B testing tied directly to 90-day CLV lift.

