
8 best Northbeam alternatives for ecommerce brands in 2026

Discover the Northbeam alternatives worth a demo, ranked on tracking accuracy, data foundation, profit and budget automation.
Denis Domnin
|
Updated August 13, 2026
|
25 min read
Logos of the 8 best Northbeam alternatives for 2026, with Admetrics at the center

Key Takeaways

The best Northbeam alternative for most ecommerce brands is Admetrics, which recovers 20 to 30% more conversions server-side, returns enriched signal to six ad platforms, and reports POAS net of COGS, shipping, fees and returns down to the SKU, from $399 a month.
Northbeam's pixel is browser-based. Conversions lost to Safari, iOS and ad blockers stay lost, and no attribution model fixes a journey it never recorded.
Every tool here measures. Three carry the math past revenue into contribution margin, and two will move a budget rather than write a recommendation for someone else to action.
Price isn't the deciding factor. These Northbeam alternatives run from €200 to five figures a month and solve genuinely different problems, so the cheapest one that fits your job usually beats the most capable one that doesn't.
Northbeam competitors split into three camps: profit-led ecommerce platforms, broad analytics suites, and measurement specialists that go deep on one method.

Why ecommerce brands leave Northbeam

The attribution is rarely the complaint. Read enough Northbeam reviews and a pattern shows up: the numbers get credited, everything around them gets criticized.

The deeper issue is where the reporting stops. Northbeam gives you ROAS. COGS never enters the platform, so there's no contribution margin, no P&L, no cohort or LTV view, and refunds report as a channel metric with no product breakdown and no link to margin. A campaign returning 3.2x on 18% margin and one returning 3.2x on 61% margin look identical on screen. 

Then there's the collection layer. Touchpoints get recorded by a browser pixel, which means a visit counts only if the script fires and the UTMs survive. Apex sends order-level results back to Meta through CAPI and stops there, so TikTok, Snapchat and the native networks never receive enriched signal. Data sits in the US with no EU residency option, which for a European brand is a legitimate blocker.

Northbeam pricing is the other half of the story

Northbeam pricing starts at $1,500 a month for Starter, billed against your data volume, with Professional and Enterprise quoted on request and no free trial. Two things about the Northbeam pricing plans catch buyers out. Shopify is the only direct ecommerce connection on the entry tier, so other store integrations mean an upgrade. And MMM+ isn't on Starter either, which leaves the entry plan as multi-touch attribution at enterprise money. Most Northbeam alternatives in this comparison open between €200 and $500, and several publish their rates instead of gating them behind a call.

How we ranked Northbeam alternatives

Four criteria, ordered by how much each one changes a budget decision.

Attribution and tracking accuracy. Model count, whether you can define your own credit rules, and how conversions get captured. Server-side collection beats a browser pixel, and what happens to the recovered data matters as much as recovering it. 

Data foundation. Connector depth, where the data physically sits, who owns it, and whether you can get it out.

Profit tracking. Whether COGS, shipping, fees and returns reach the report, and how far down they go. Gross margin is a start. POAS at SKU level with returns attributed by campaign is the standard.

Action. What happens once the number lands. Most tools stop at a dashboard, a few recommend, two execute.

Northbeam competitors fall into three groups against those criteria: profit-led ecommerce platforms, broad analytics suites that trade depth for breadth, and specialists that go deep on one method. Rankings come from public documentation, published pricing and vendor demos, checked in August 2026.

Northbeam alternatives comparison 2026

#
Tool
Profit depth
s2s Pushback
Action
1
Admetrics
POAS to SKU, full P&L
Metaa, Google + 4 more
Allocator + Ava AI
2
Polar Analytics
CM1 to CM3
Meta, Google
Recommends
3
Triple Whale
Gross margin
Meta focus
Yes, Moby
4
Klar
Full P&L
None
No
5
Rockerbox
None
Google only
Plans only
6
Hyros
Net profit only
5 platforms
No
7
Wicked Reports
None
Meta, Google
Recommends
8
Tracify
None
None
No
1.

Admetrics

4.97

Best for: ecommerce and DTC teams who want profit as the metric budget decisions run on, and who want the tool to make the move instead of writing a recommendation.
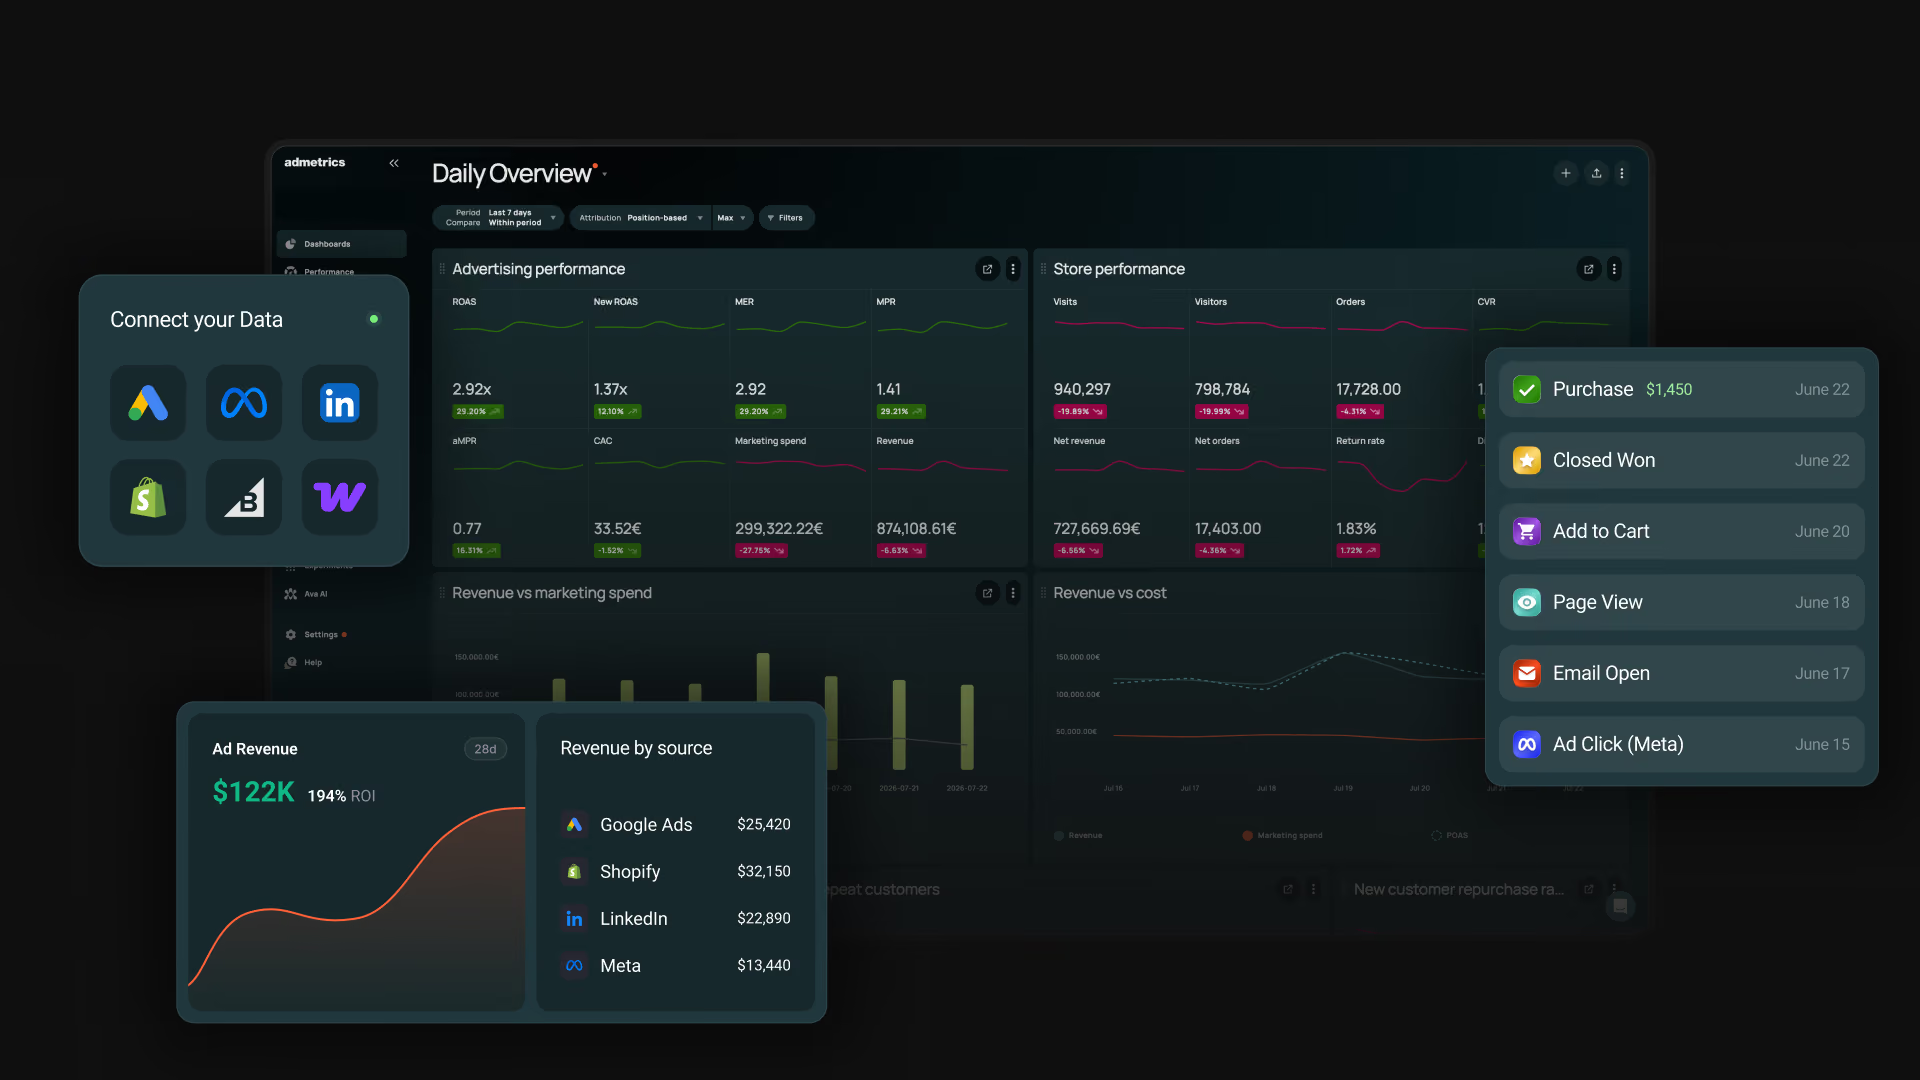
Admetrics dashboard showing server-side tracking, attribution and profit reporting for DTC brands

Admetrics is built around a position most attribution tools step around: the number you optimize against should already have COGS, shipping, fees and returns taken out of it. Tracking runs first-party and server-side, so conversions the browser drops get recovered and sent back to the ad platforms as an enriched signal. Underneath sits the part Northbeam never had, contribution margin through to EBITDA, LTV cohorts, returns split by campaign and product. Then the Allocator moves the budget. 

Key features

  • First-party server-side tracking. Conversions are logged server-side rather than by a script that has to survive Safari, iOS and ad blockers, recovering 20 to 30% more than a pixel records.
  • Conversion enrichment sent back to six platforms. Enriched conversions stream to Meta, Google, TikTok, Snapchat, Outbrain and Taboola, so the bidding engines optimize against buyers who actually converted.
  • Nine attribution models plus custom rules. Nine out of the box, and you can define your own logic for splitting credit. You decide the rules.
  • POAS down to SKU. COGS, shipping, fees and returns net out at product level, and returns break out by campaign so you can see which ads are quietly buying refunds.
  • PRISMA MMM and the Budget Allocator. Machine-learning mix modeling sizes each channel including offline and upper-funnel, and the Allocator turns that into concrete cross-platform moves.
  • Multi-shop cross-matching. One customer identity across your stores and marketplaces, so a marketplace buyer who comes back through your site doesn't count as new twice.
  • Ava and a native MCP. Plain-language profit questions answered from your own data, plus an MCP that lets Claude or ChatGPT query attribution and budgets and act on them, not just read.

Strengths

  • The recovered signal feeds ad platforms. Server-side capture plus enrichment back to six platforms.
  • The profit math runs all the way down. Contribution margin to EBITDA on your own cost data, refreshed intraday, with returns attributed by campaign and product.
  • Cookieless tracking on German servers with GDPR compliance.
  • End-to-end product for e-commerce teams: from attribution to the budget move.

Limitations

  • It starts at $399 a month. Several tools further down this list open under $100. 
  • Not the best fit for SaaS. If revenue closes in a CRM over a six-month cycle, this isn't the shape of tool you need.

Pricing

From $399/month. A free data audit and a free trial come before you commit, and a dedicated success manager is included rather than reserved for enterprise contracts.

Reviews

4.97, the highest rating of any tool in this comparison. Switchers most often mention the same two things: conversion counts that were finally reconciled, and a profit number they could take to a board meeting.

Bottom line

An all-in-one solution for e-commerce brands and the right pick when the question you're stuck on is which campaign made money, and when you want that answer to end in a budget change. It costs more than a dashboard, and it does considerably more than one.

2.

Polar Analytics

4.7

Best for: Shopify and omnichannel brands who want a real data foundation, their own warehouse, their own metrics, without hiring a data team to build it.
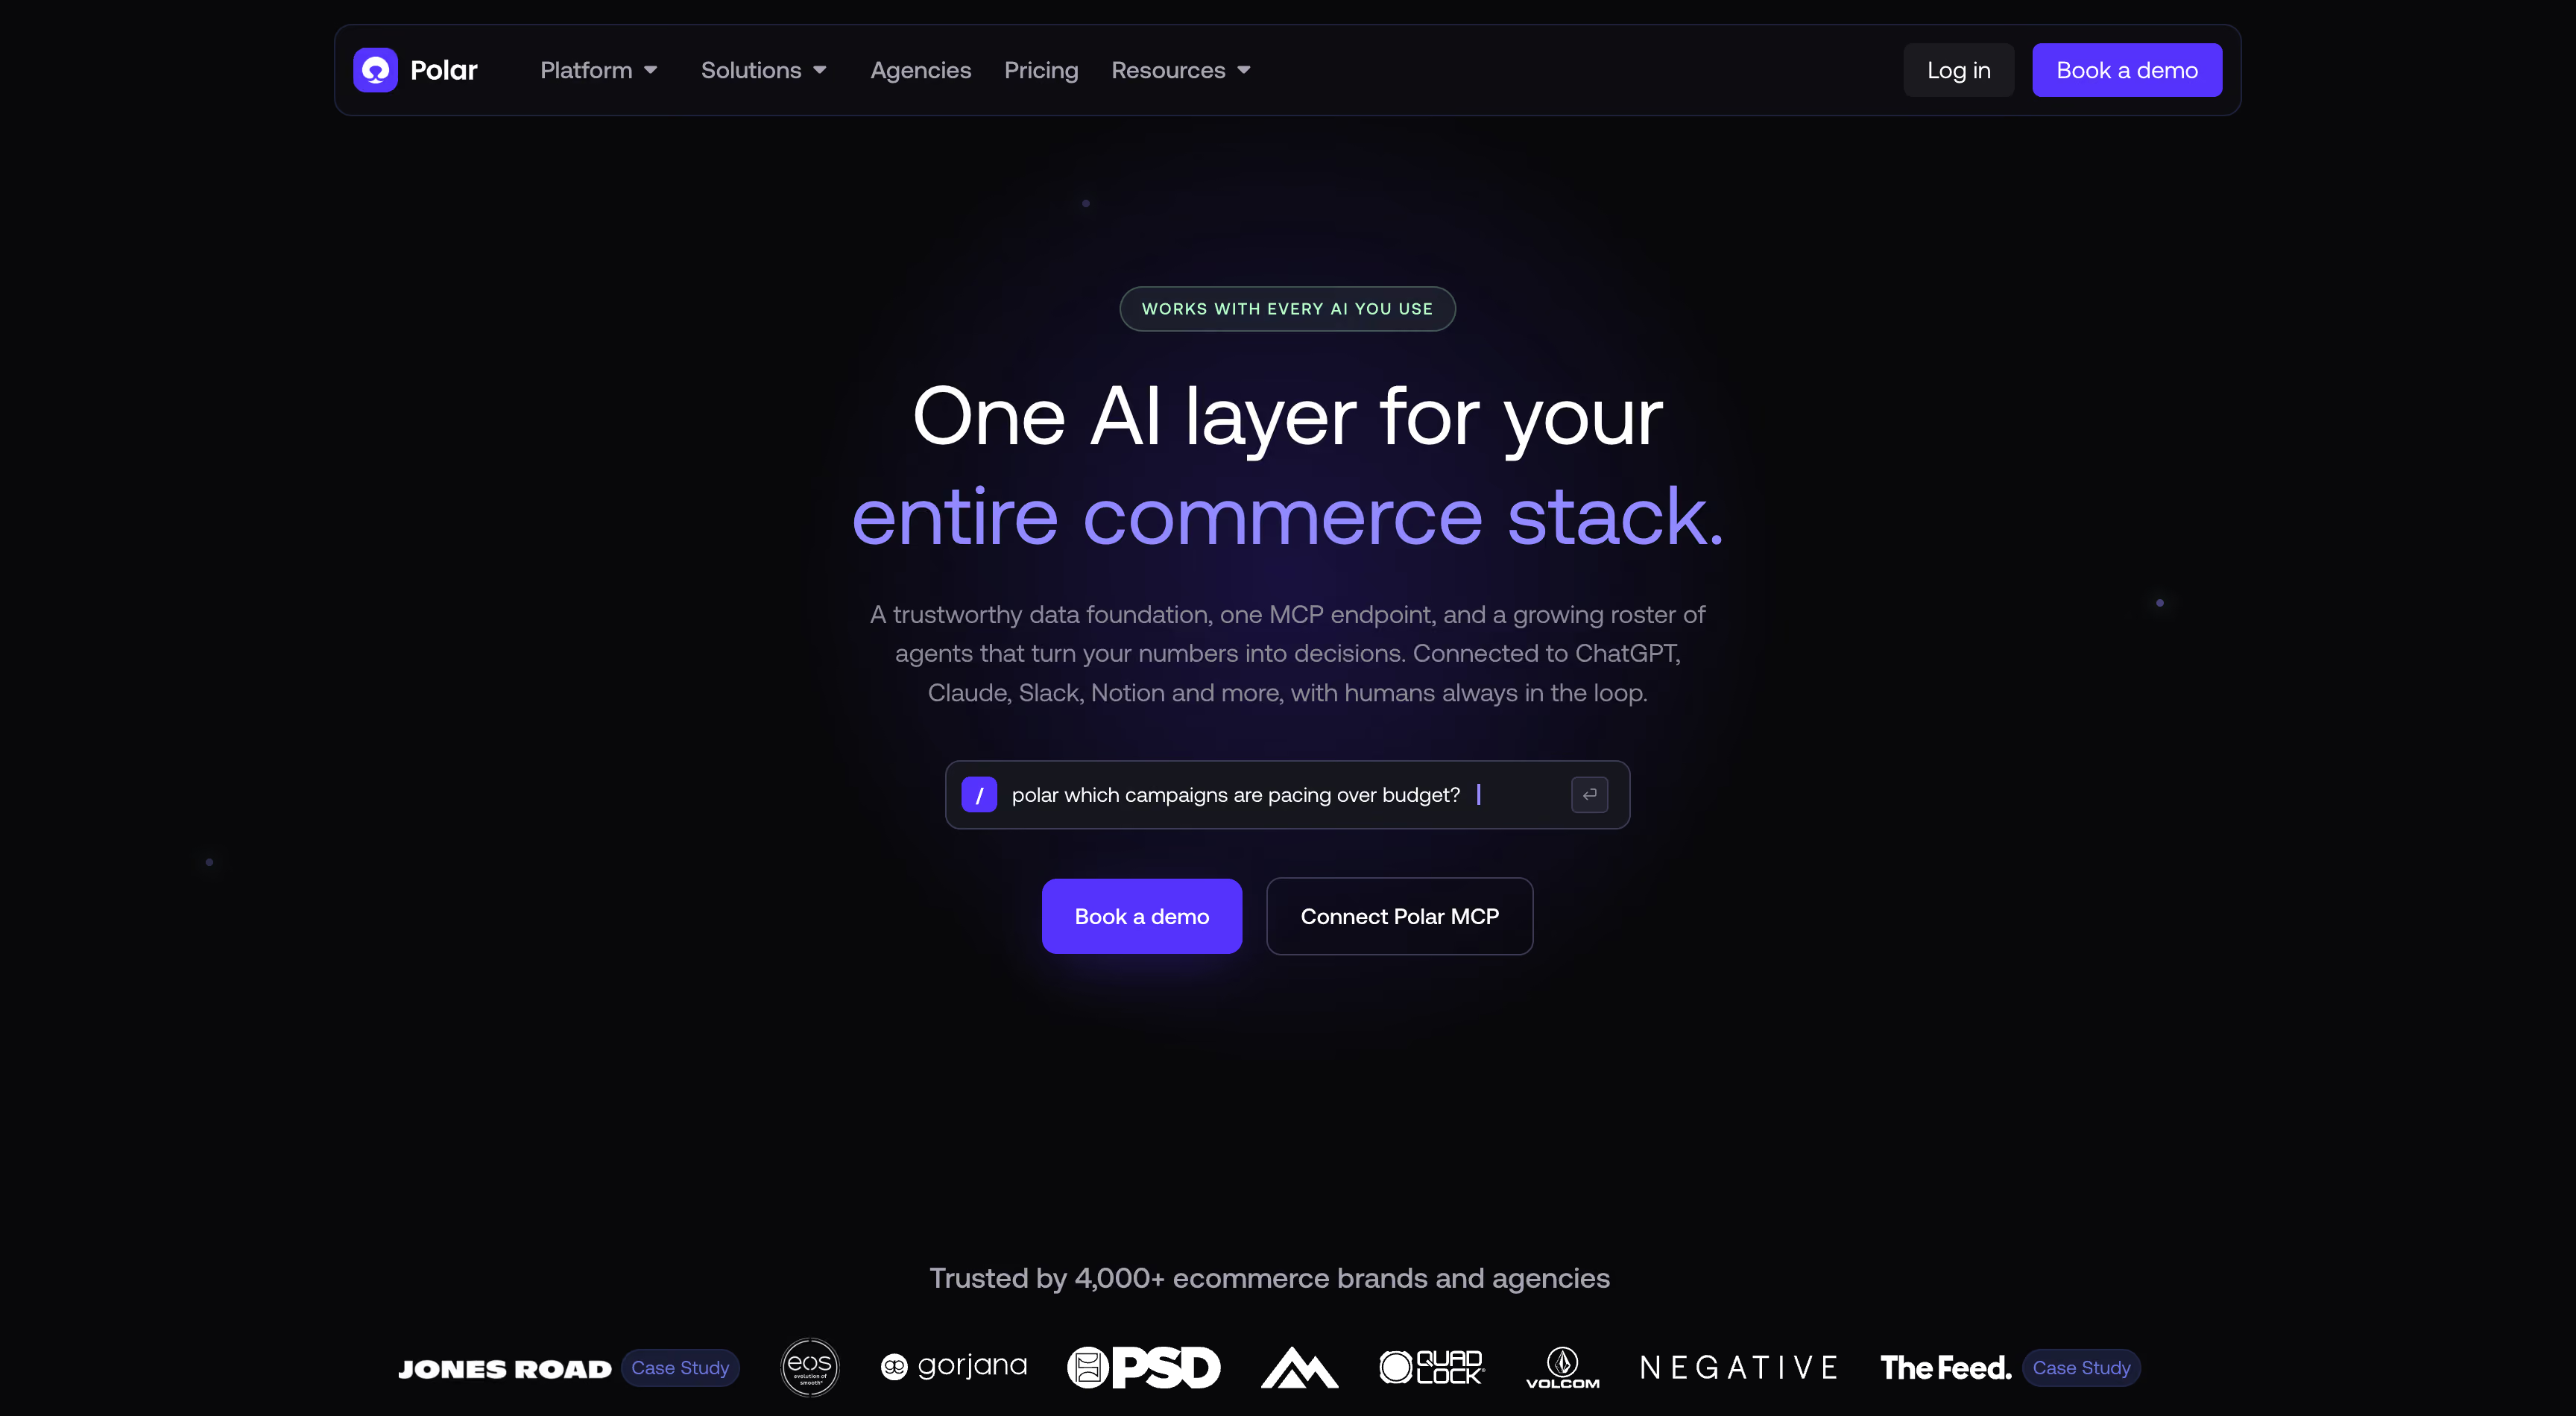
Polar Analytics homepage presenting its Snowflake-backed ecommerce data stack and margin reporting

Polar sells the layer underneath the dashboard. Every plan ships a dedicated Snowflake database and a semantic layer of 400+ pre-built ecommerce metrics, which is a different proposition from a tool that holds your data and rents it back to you in charts. Attribution runs off a first-party pixel served from your own domain, and Lifetime ID stitches sessions and logins into one path across devices. The profit math is real too: COGS, 3PL, shipping, payment fees and returns all feed a contribution margin stack that lands at campaign and SKU. What Polar doesn't do is budget automation.

Key features

  • Dedicated Snowflake warehouse on every plan. You hold the keys to the raw data, with an ecommerce semantic layer of 400+ metrics on top. Direct SQL access is a paid add-on.
  • Polar Pixel and Lifetime ID. First-party server-side collection from your own domain, fingerprint-based visitor recognition, and cross-device stitching that survives logouts and device switches.
  • View-through credit for offline channels. TV, CTV, podcast and direct mail impressions from providers like Tatari and PebblePost get matched to the same Lifetime ID and scored alongside Meta and Google.
  • 10 attribution models side by side. First click through time decay, plus paid overlap and a Shapley-based Full Impact model, with lookback windows and cash-versus-accrual accounting you set yourself.
  • Contribution margin CM1 to CM3. Margin lands at both the campaign and the SKU, with inventory and product-type dimensions attached.
  • Incrementality testing as a service. A Polar data scientist runs holdout tests on Meta, Google, TikTok or TV and returns a report. Priced per test.
  • Agent suite and headless MCP. Ask Polar for analysis, plus agents for media buying, inventory and Klaviyo email, and an AI Data Engineer that writes new connectors on request.

Strengths

  • The data foundation is deeper than most tools in this category. Owning the warehouse means you're not locked out of your own history if you leave.
  • Costs are properly modeled. 3PL and payment fees are in the margin stack, not assumed away.
  • Offline and upper-funnel channels get view-through credit, which matters if you run TV or podcast.
  • The MCP and agent suite are built as products with a governed semantic layer behind them.

Limitations

  • Conversion enrichment reaches two platforms. The CAPI enhancer covers Meta and Google, sold as a separate product. TikTok, Snapchat, Outbrain and Taboola get nothing back.
  • No marketing mix modeling. Incrementality is a service line billed per test with a human in the loop. It’s not a model running continuously in the product.
  • Nothing executes. The Media Buyer Agent monitors hourly and tells you what to scale or pause. You approve it, then go and change the budget yourself in each ad account.
  • No influencer tracking. Creator spend arrives as a UTM only.
  • Returns feed the margin but don't get their own report. Net sales and CM2 net them out, so you see the damage without seeing which campaign caused it.

Polar Analytics pricing

GMV-based and quoted through a demo. G2 lists entry pricing around $300/month for the Analyze tier, and the stack is modular: intraday refresh, SQL access, custom connectors, the CAPI enhancer and each incrementality test are priced on top. Unlimited users and a dedicated Success Manager are included at every level.

Polar Analytics reviews

4.7 on G2 from a small review base, with ease of setup and quality of support scoring highest. The pattern across Shopify App Store reviews is consistent: fast onboarding, responsive team, and reporting that replaced a pile of connectors. Complaints, where they show up, are about the cost of the add-ons stacking.

Bottom line

The pick if your problem is that you need a proper data stack and can't build one. It reports profit accurately and it hands you the warehouse. It just stops at the point where the media buyer would still need to do a lot of stuff manually.

3.

Triple Whale

4.3

Best for: Shopify brands who want a real-time dashboard and an AI layer that will push changes into the ad accounts.
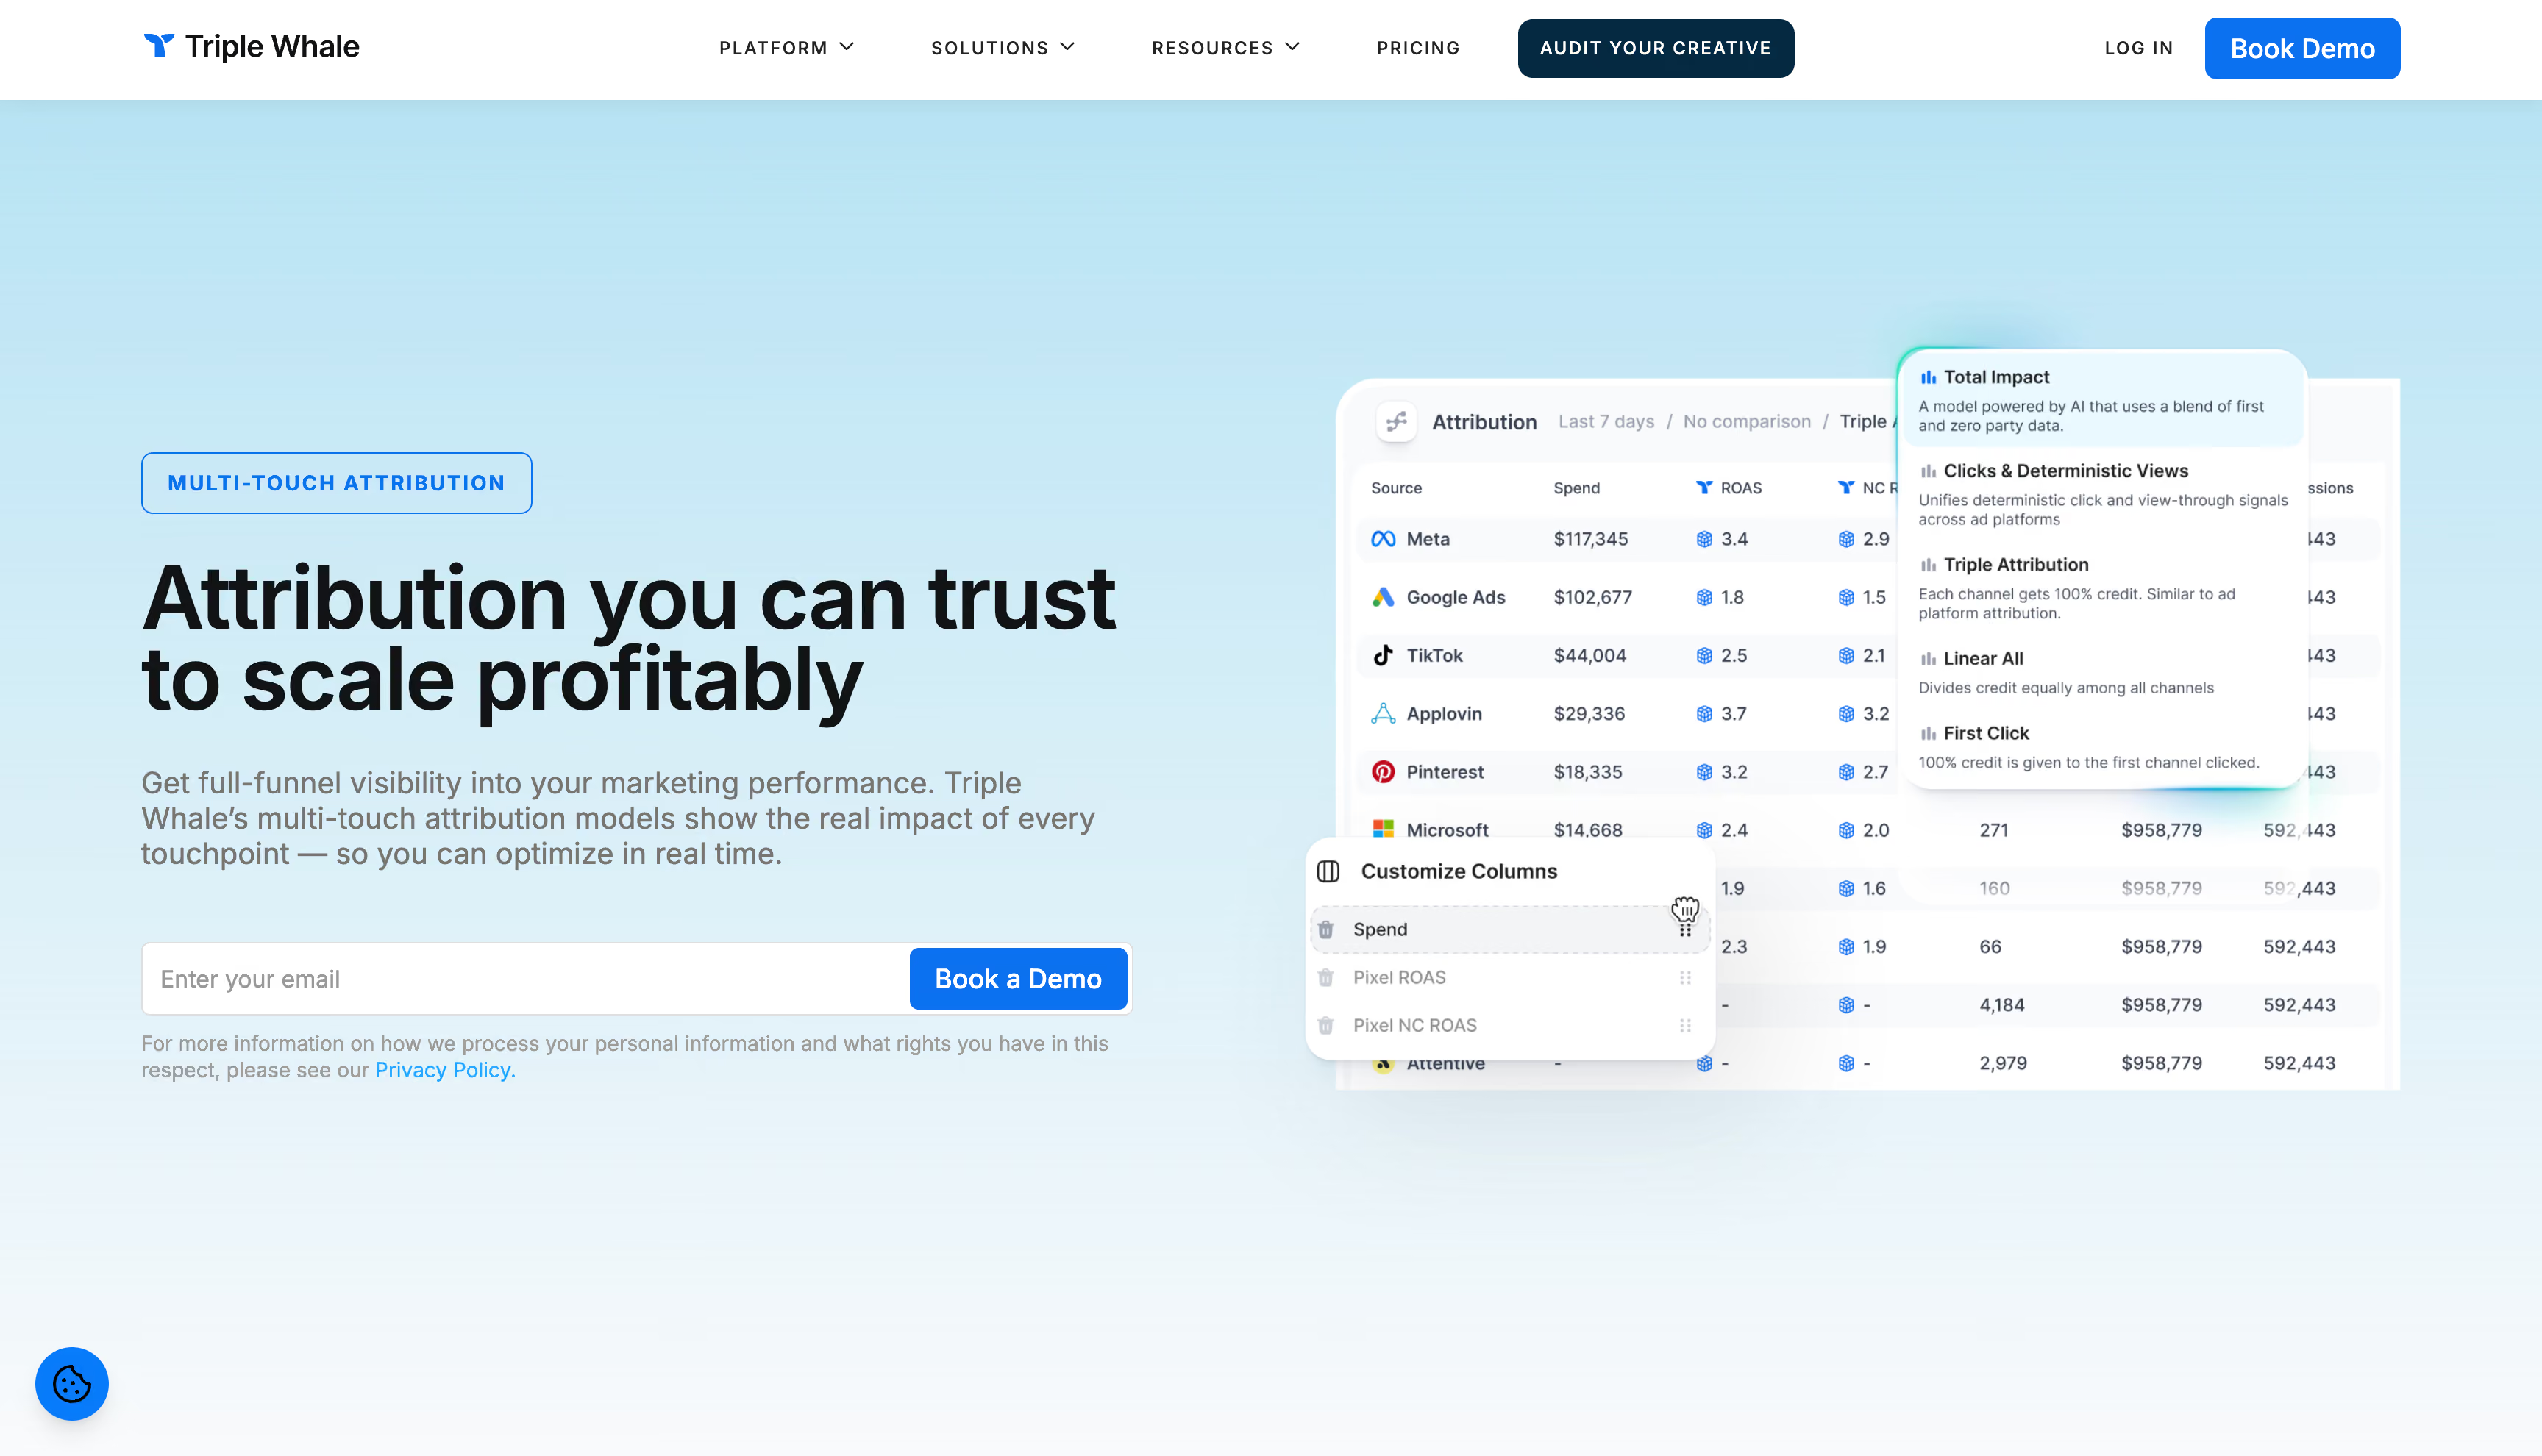
Triple Whale homepage presenting its ecommerce dashboard and Moby AI agents for Shopify brands

Triple Whale has spent the last two years turning itself from a dashboard into what it calls an AI operating system, and Moby is the whole pitch now. It reads your data, answers questions in Slack, and on the higher tier it queues and executes campaign changes inside guardrails you set. The measurement underneath is solid enough: the Triple Pixel captures cross-device, a post-purchase survey feeds a proprietary attribution model, and Sonar pushes conversions back to Meta. The catch is what happens to the profit number. Triple Whale calculates margin from COGS and stops at gross. Nothing below that line, no full P&L, and returns never get attributed to the campaign that caused them.

Key features

  • Triple Pixel with a mobile SDK. First-party cross-device, cross-platform capture, now extending into your mobile app for journeys that start on a phone and finish on desktop.
  • Total Impact attribution. A proprietary model that blends pixel data with post-purchase survey answers, so channels that never get a click still register. Seven models total with five lookback windows.
  • Sonar Send and Sonar Optimize, included on every paid plan. Send recovers abandonment flow revenue standard pixels miss; Optimize returns enriched conversion data to Meta through the Conversions API.
  • Moby with actions. On Automate, Moby pauses underperformers and scales winners inside thresholds you define, runs scheduled automations, and routes work across frontier models from OpenAI, Anthropic and Google.
  • Compass. MTA, MMM and incrementality testing calibrated against each other in one system, with GeoLift and conversion lift studies.
  • 60+ integrations and a full BI layer. No-code dashboard builder, segment builder, SQL editor, 50+ dashboard templates, plus data-in and data-out APIs.
  • AI visibility tracking. Mentions, citations and sentiment for your brand across ChatGPT and other LLMs, which no other tool in this list reports on.

Strengths

  • The action layer is real. Moby executes budget and status changes in connected platforms rather than filing a recommendation for someone to action later.
  • Sonar comes standard now. Server-side pushback used to sit behind a paywall and doesn't anymore.
  • Setup is genuinely fast, and the free tier lets you see the data before you commit to anything.
  • The breadth of the BI layer means most teams stop paying for a second reporting tool.

Limitations

  • Profit stops at gross margin. No contribution margin, no operating costs, no path to EBITDA. Scale decisions still run on ROAS and it can be a misleading metric.
  • Conversion enrichment is Meta-centric. Sonar Optimize is documented around Meta's CAPI. TikTok, Snapchat, Outbrain and Taboola don't get enriched signal back.
  • MMM and incrementality live behind Compass, which is an Enterprise inclusion or a paid add-on. On Foundation you're buying MTA and nothing that models saturation.
  • US-hosted, no EU data residency. 
  • Seven models, no custom. You rotate between their models; you can't define your own credit rules.

Triple Whale pricing

Free plan, Foundation from $219/month, Automate from $749/month, Enterprise quoted. All prices scale with annual GMV, all paid tiers are 12-month subscriptions, and annual prepay saves two months. Retention ($19/mo), Conversion ($79/mo), Compass, data warehouse sync and white-glove data science are add-ons. A dedicated CSM only kicks in around $10M GMV.

Triple Whale reviews

4.3 on G2, and the reviews split rather than cluster. The daily dashboard and speed of setup get consistent credit; attribution numbers people stopped trusting, billing friction and cancellation difficulty come up often enough to take seriously.

Bottom line

One of the most complete AI-powered tools here, sitting on a profit view that ends too early. If your decisions run on ROAS and you want an agent that acts, it fits. If you need to know what a campaign earned after COGS, shipping and returns, you'll be doing that math somewhere else.

4.

Klar

n/a

Best for: DACH and EU brands that want attribution with every byte hosted in Germany, and don't need any automation.
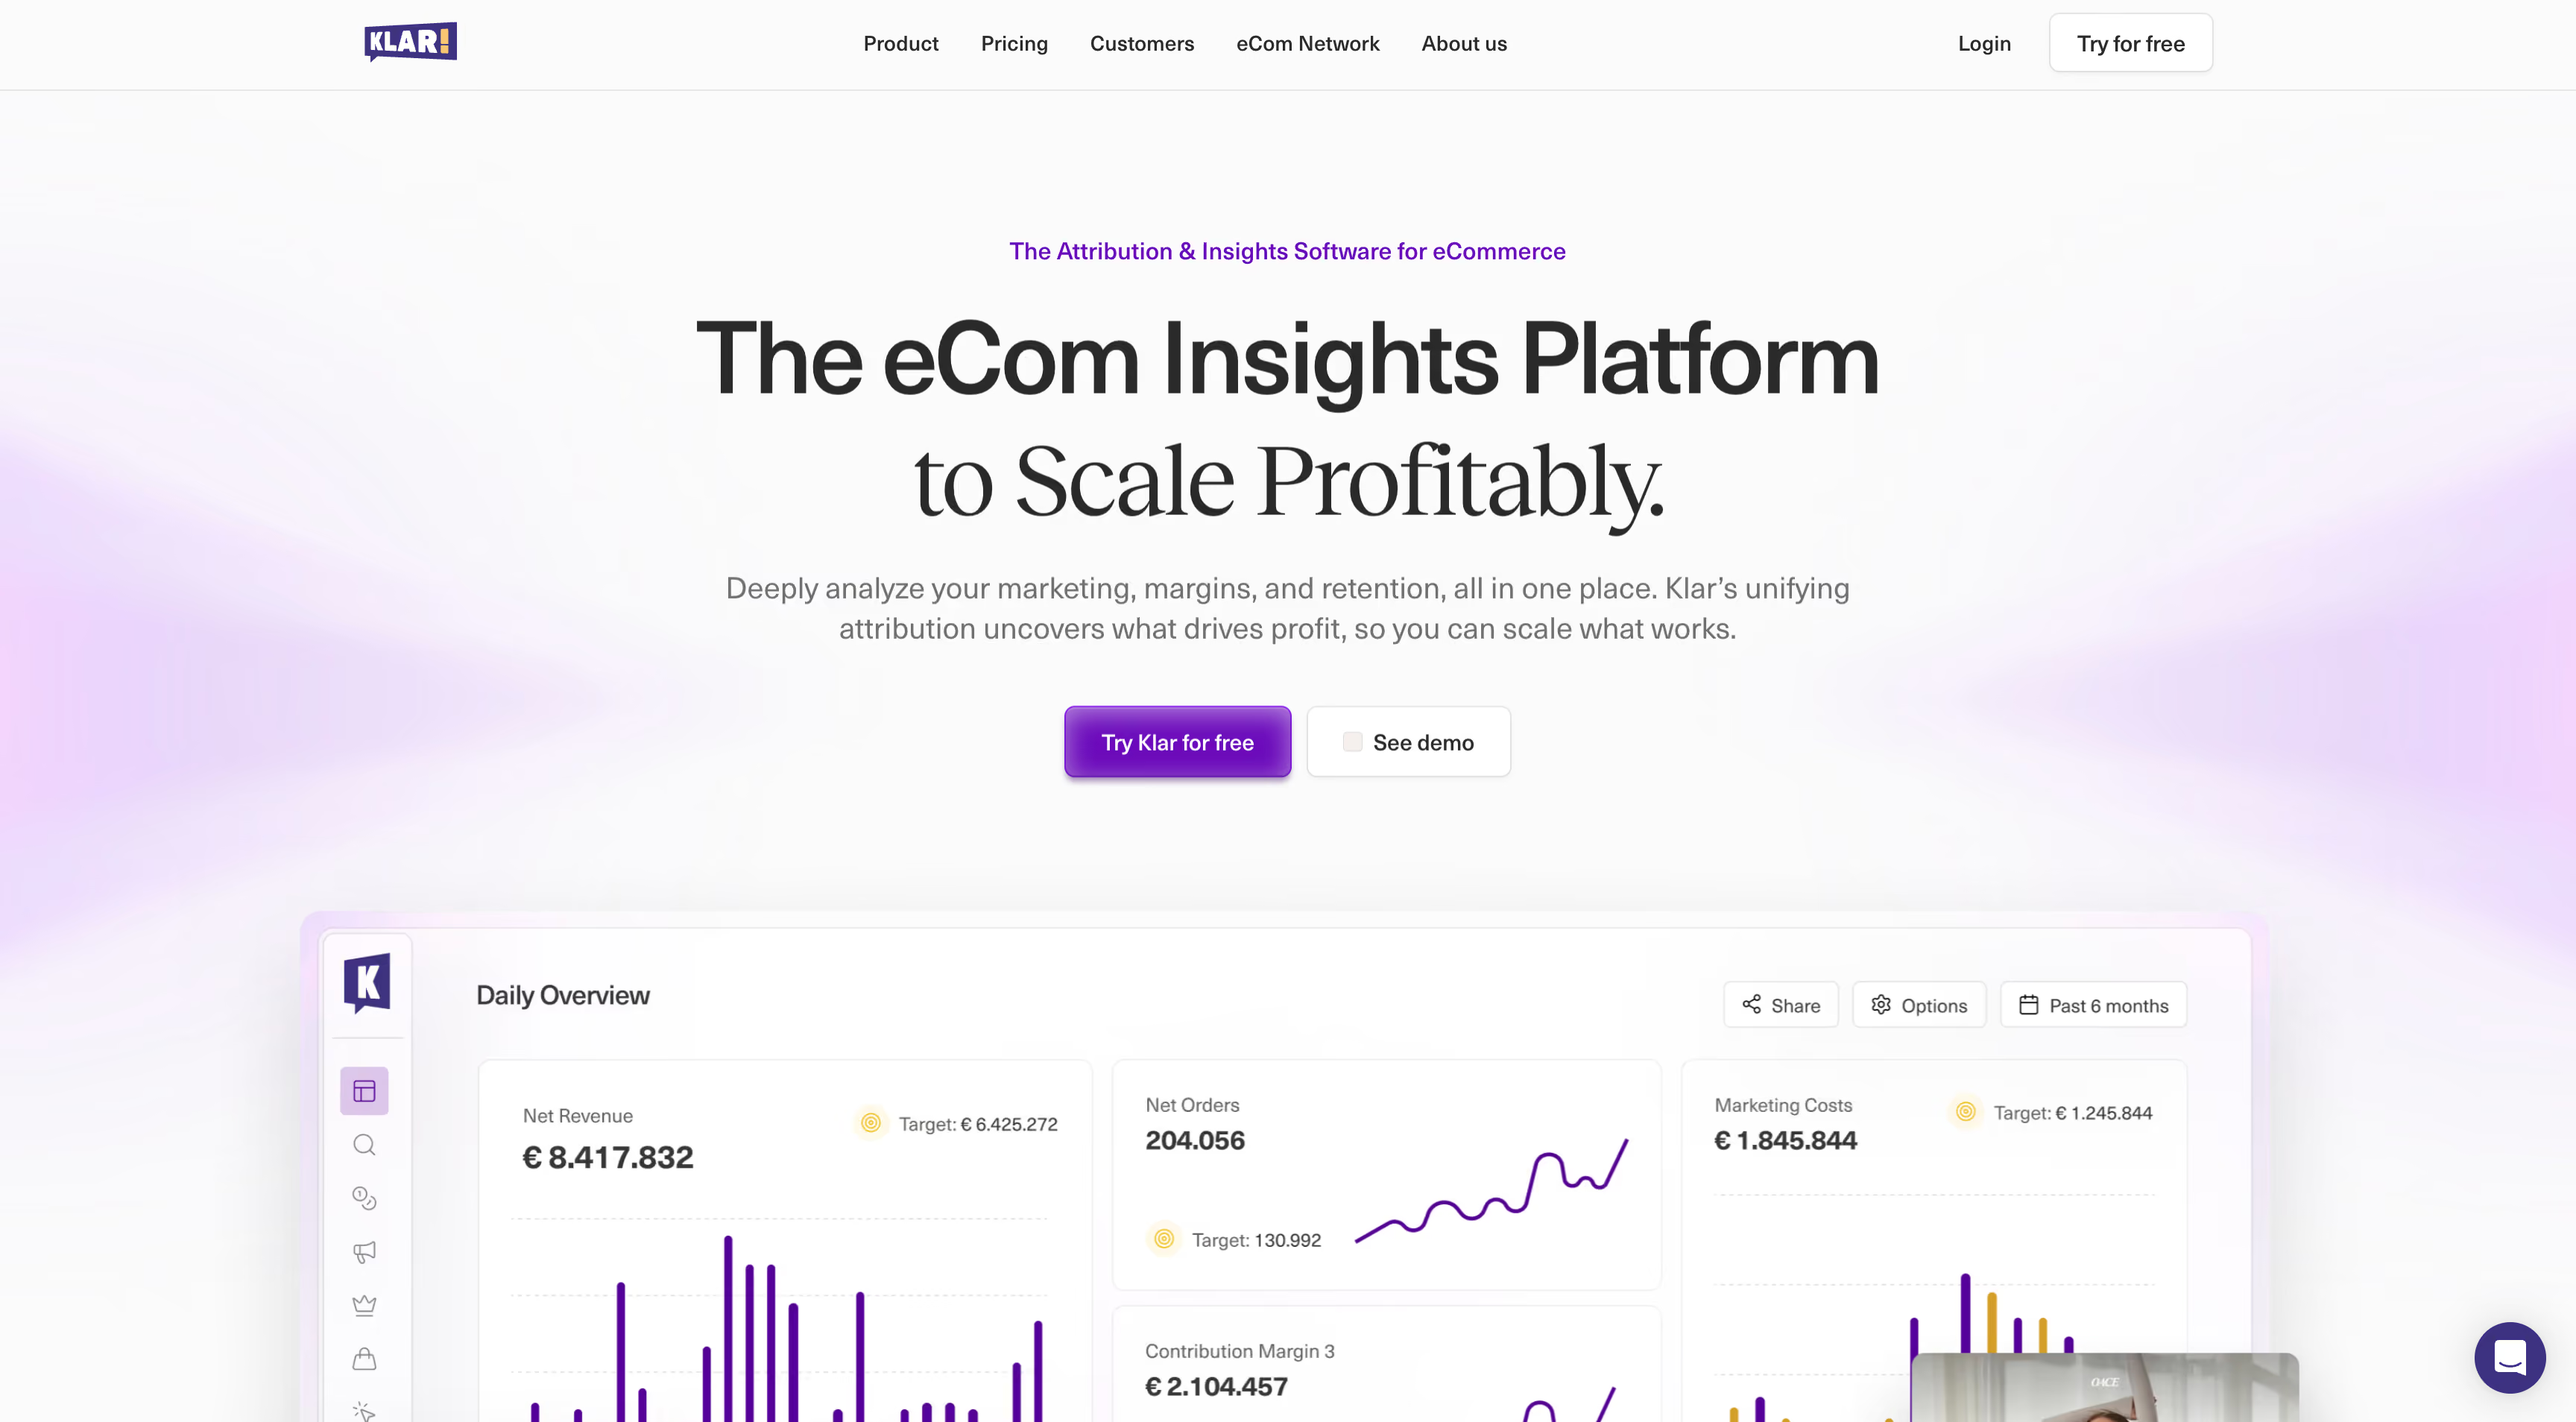
Klar homepage presenting its German-hosted ecommerce BI and attribution platform

Klar is a Munich company that built the thing most attribution tools bolt on last: the profit layer. COGS, fulfillment, transaction fees and overheads all load into a real P&L, and then attribution reports carry that margin through, so a channel report shows contribution rather than ROAS. The tracking is first-party and cookieless, the data sits in Germany under ISO 27001, and there's a data-driven model that reweights touchpoints by intent, order and time lag. It's a well-built measurement and reporting product. It's also a product that ends at the report.

Key features

  • Profitability reporting with a full P&L. Detailed COGS and fulfillment costs, custom marketing cost uploads, overhead uploads, unbundling of products, multi-currency conversion.
  • Profit carried onto attribution data. Channel, creative and retention reports all run on contribution margin rather than platform-reported revenue, which is the point of the whole product.
  • Five static models plus a data-driven one. First click, last click, linear, U-shape and unique, then a dynamic model, then MMM sitting on top of it to reassign direct and branded traffic to whatever actually created the demand.
  • Zero-party enrichment. Discount codes and post-purchase survey answers from Fairing and KnoCommerce get injected into the journey as touchpoints the script never saw.
  • Influencer reporting with a built-in CRM. Creators are managed and measured in-platform, and their fees flow into contribution margin through the custom cost sheet.
  • Chrome extension for three ad managers. Klar's attributed numbers are integrated into Meta, Google and TikTok, and you pick which model the overlay uses.
  • Cohorts, CLV, retention and product relationship reports on the entry plan, plus inventory and Klaviyo reporting.

Strengths

  • German hosting with ISO 27001 certification.
  • Profit tracking is uncommon in this list. Most tools give you one or the other and let you reconcile them in a spreadsheet.
  • Post-purchase survey data feeding the journey covers the channels no pixel can see.

Limitations

  • Attribution costs double. The €200 Core plan is reporting only. The first-party pixel and the entire attribution suite start at €400, so the headline price isn't the price for what you came for.
  • No conversion enrichment, at all. Nothing goes back to Meta, Google or TikTok. Your cleaner data never improves ad delivery, which is where a large part of the return on this kind of tool comes from.
  • Nothing acts on the output. MMM and targets tell you where the budget should move. Relocating the budget stays a manual job in each ad account.
  • No AI assistant. Klar publishes a guide for building your own MCP server against their API,
  • 15+ integrations. The shortest connector list in this comparison. Solid on the European stack (Shopware, Centra, Magento), but that’s it.
  • Hard to vet from the outside. No G2 presence; the review footprint is on OMR and a handful of Shopify entries, which is a small base to judge from.

Klar pricing

Core from €200/month, Core + Attribution from €400/month, both scaling with your net revenue over the trailing 12 months and recalculated quarterly. No setup costs, no minimum term on monthly billing, 14-day trial after onboarding.

Klar reviews

Klar has no G2 rating, so there's no large public sample to read. What exists sits mostly on OMR, the German review platform, where it holds attribution and ecommerce analytics category badges for 2026. Customers skew heavily DACH, with names like Junglück, BLACKROLL and yfood on the site.

Bottom line

Solid measurement for a European brand that wants profit and privacy in the same tool, priced fairly if you accept that the real plan is €400. What you don't get is the closed loop: no signal pushed back to the platforms, no budget moved, no assistant.

5.

Rockerbox

4.6

Best for: brands with real offline and upper-funnel spend - linear TV, OTT, podcasts, direct mail - that need one deduplicated number across a hundred channels.
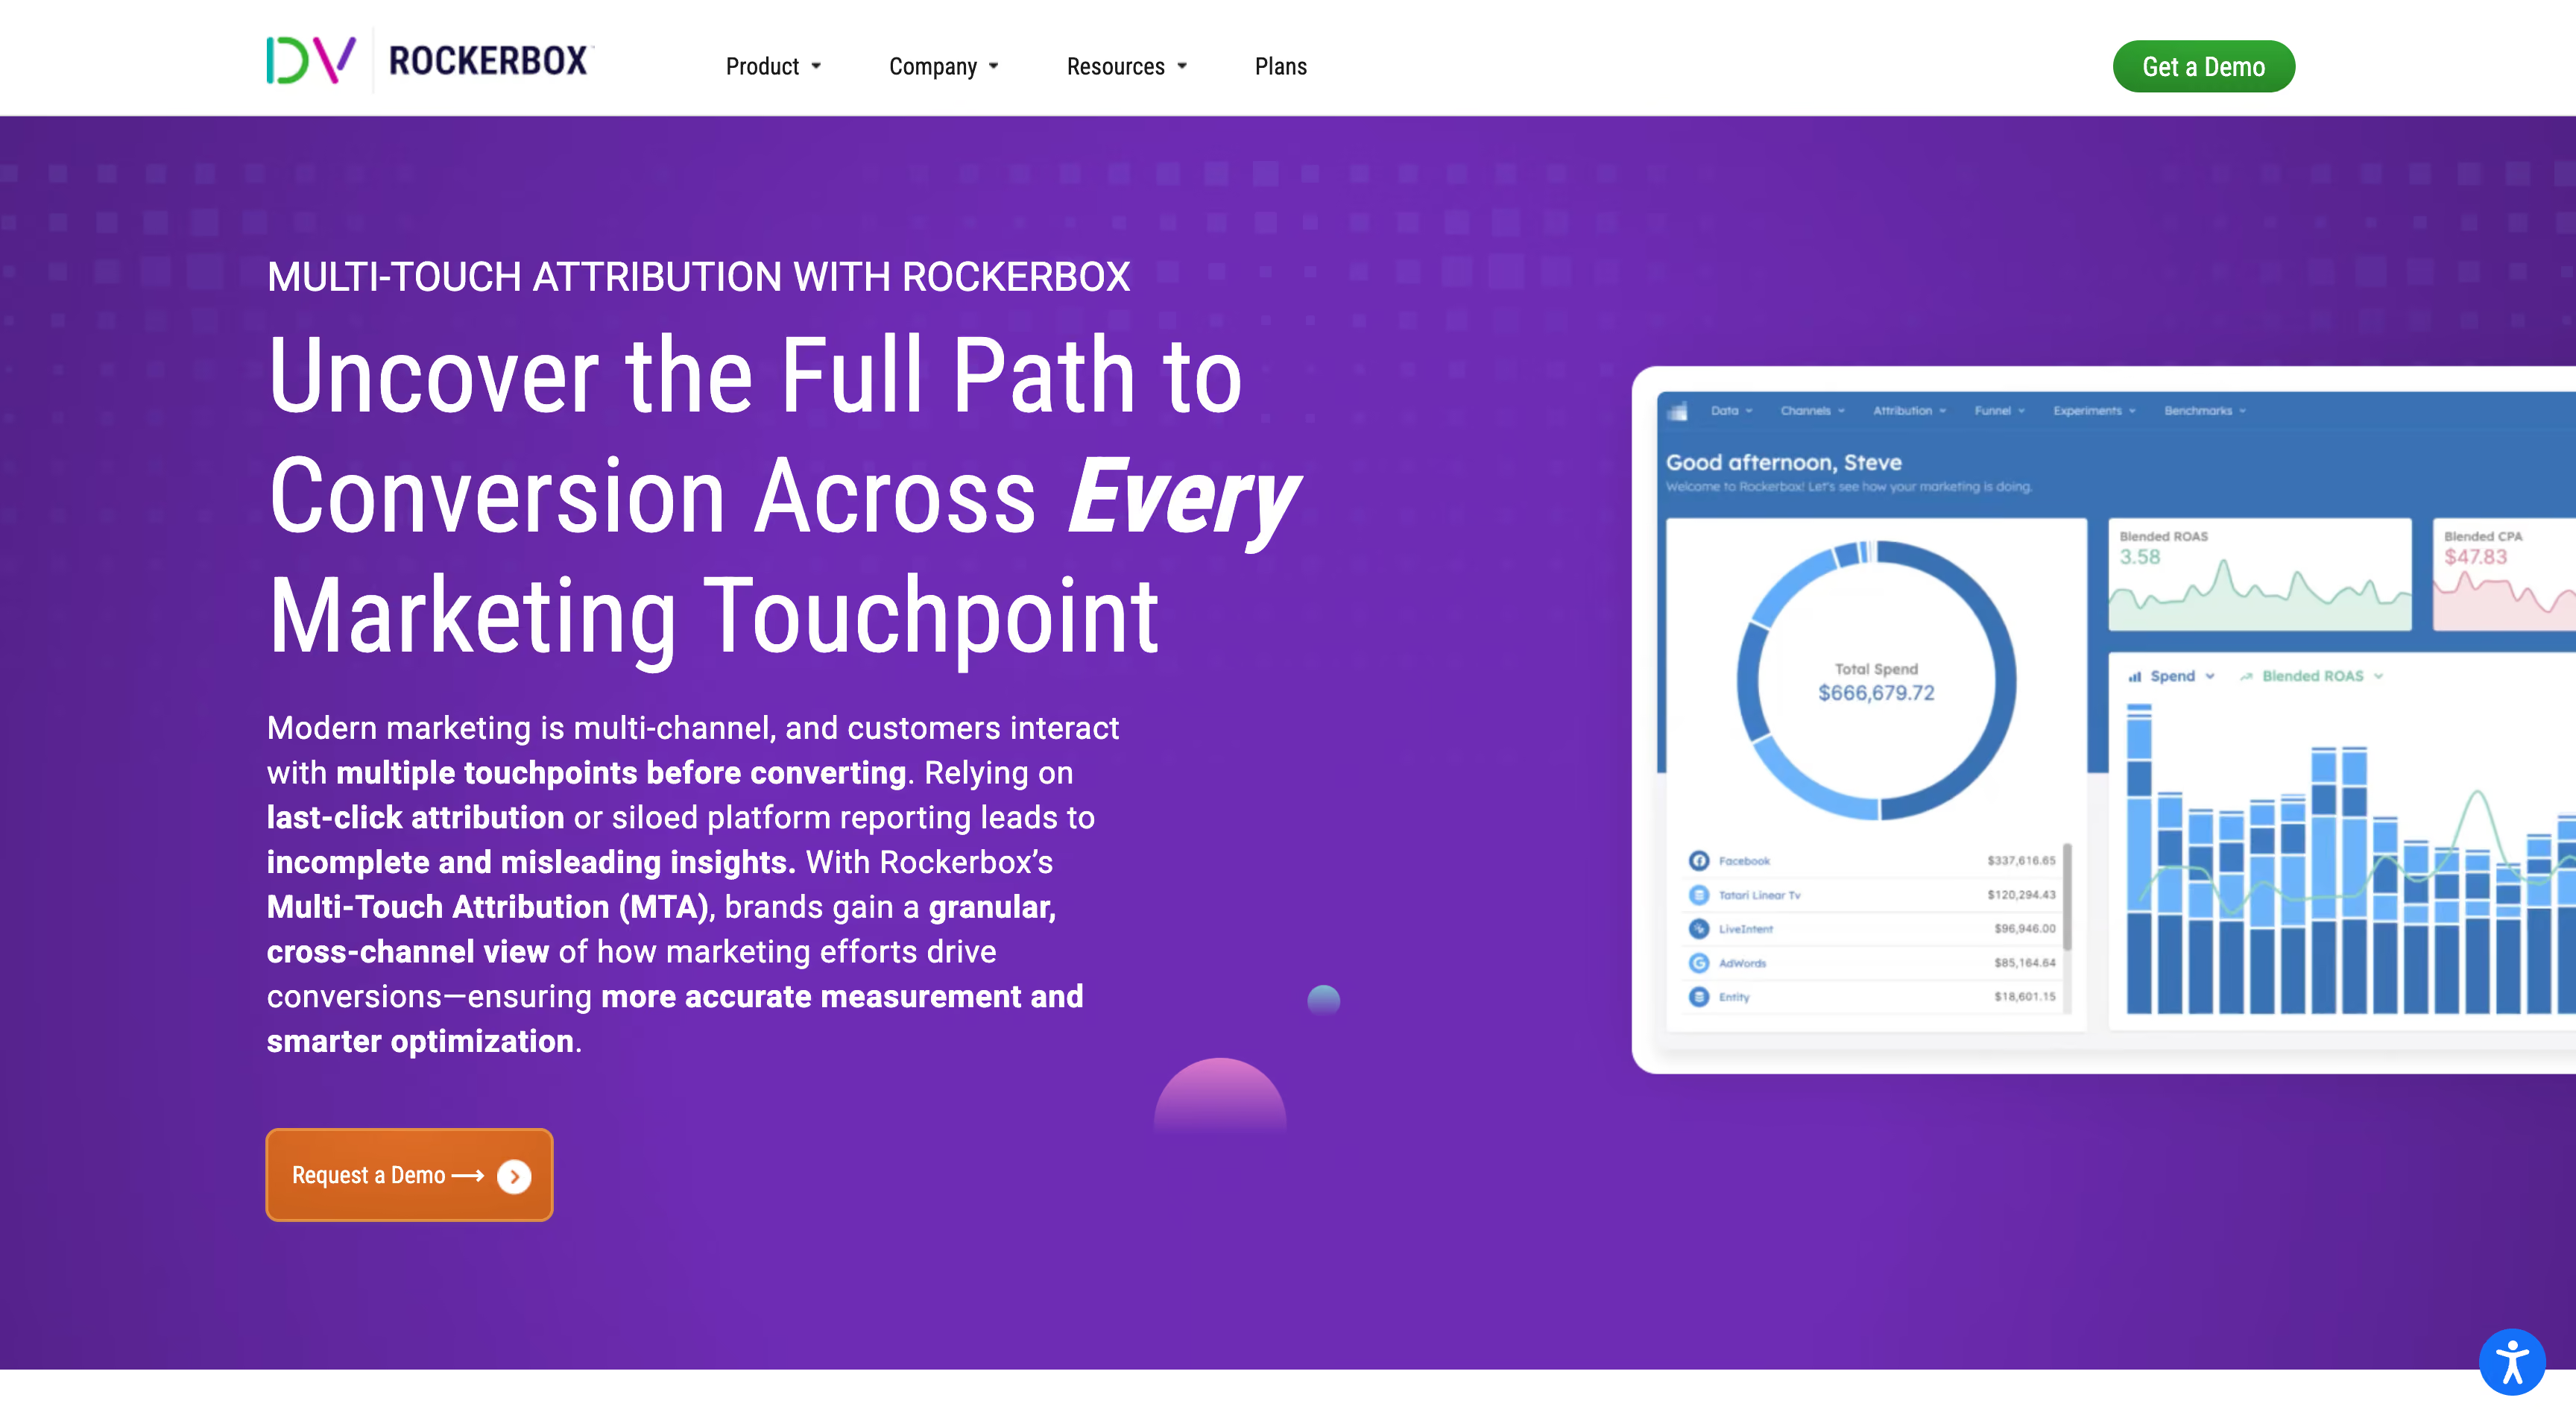
Rockerbox homepage presenting its multi-touch attribution, MMM and incrementality measurement platform

Rockerbox is the enterprise end of this list and it doesn't pretend otherwise. The premise is that no single method is trustworthy alone, so it runs three: multi-touch attribution for daily granularity, Bayesian MMM for long-run channel contribution, and managed incrementality tests to prove causality. The tests calibrate the models, and the interface shows you where the three methods agree and where they diverge instead of blending them into one comfortable number. That's methodologically honest and rare. It's also a measurement company, not a commerce company. DoubleVerify bought it in March 2025 for $85 million and folded it into a broader ad-verification suite, which is worth knowing if you're betting on the roadmap.

Key features

  • 100+ integrations weighted toward offline. Linear TV, OTT, podcasts, direct mail and affiliate networks, all landing in the same deduplicated dataset as your Meta and Google spend.
  • Three calibrated methodologies. MTA, Bayesian MMM with model comparison, and geo-holdout or PSA tests run by their services team, each feeding back into the others.
  • MMM scenario planner. Model shifting 20% of budget from Meta into affiliate and see the projected revenue impact before you commit.
  • Log-level paths. Every touchpoint on every path, with channel overlap and funnel position, down to individual rows per order.
  • Four model types plus custom credit. First touch, last touch, even weight and a modeled multi-touch built from your own data, with your own credit allocation over the top.
  • A managed data foundation you can export. Rockerbox hosts the dataset, then pushes it into your Snowflake, BigQuery or Redshift with one click.

Strengths

  • Offline coverage runs deeper here than anywhere else in this comparison. If a third of your budget is TV and podcast, most of the other tools in this list simply can't see it.
  • Deduplication across a hundred channels is genuinely difficult and it's the core of what you're paying for.
  • Showing where MTA, MMM and testing disagree is a more useful output than a single confident number.
  • Log-level export means your analysts can go past whatever the UI offers.

Limitations

  • COGS isn't in the model. ROAS and CPA are the whole output. No margin, no contribution, no profit view of any kind.
  • Nothing reports at product level, and returns don't report at all. Conversions arrive as orders with a revenue value attached, and what comes back afterwards is invisible.
  • No LTV cohorts. Payback period and time to convert are covered; repeat-order modeling and cohort tables aren't.
  • Conversion enrichment is Google-only. De-duplicated conversions flow back through the Google Ads API, and the Meta equivalent is still documented as beta.
  • No AI assistant, no MCP. Reading the reports and reaching the conclusion is your team's job, and no AI client can query the data directly.
  • Custom dashboards need another tool. The prebuilt views cover paths, overlap and funnel position; anything else means exporting to your warehouse and building it in Looker.
  • Scenario planning only. The planner forecasts what a reallocation would do. Nothing writes a budget back to an ad account.
  • Cookie-based and US-hosted, with no EU data residency documented, and thin commerce connectors: Shopify, Stripe and Segment.

Rockerbox pricing

Not published. The plans page splits the platform into data and analysis products and routes you to a call. Third-party directories put entry pricing around $2,000 per month, and procurement data suggests mid-market contracts land between $40,000 and $90,000 a year for brands spending $100K to $500K monthly on media. No free trial, and incrementality tests are delivered as a managed service.

Rockerbox reviews

4.6, with reviewers consistently crediting the breadth of channel coverage and the responsiveness of the analytics team. The honest caveat that shows up in reviews: walled gardens won't share impression data, so view-through numbers stay modeled rather than observed.

Bottom line

The right instrument if your measurement problem is genuinely hard - many channels, heavy offline, spend big enough that a 5% misallocation costs more than the contract. For a DTC brand that needs to know which SKU earns after returns, it's an expensive way to get a ROAS number.

6.

Hyros

4.9

Best for: high-spend advertisers with long, messy funnels - opt-ins, webinars, sales calls - who need every sale tied back to the click that started it.
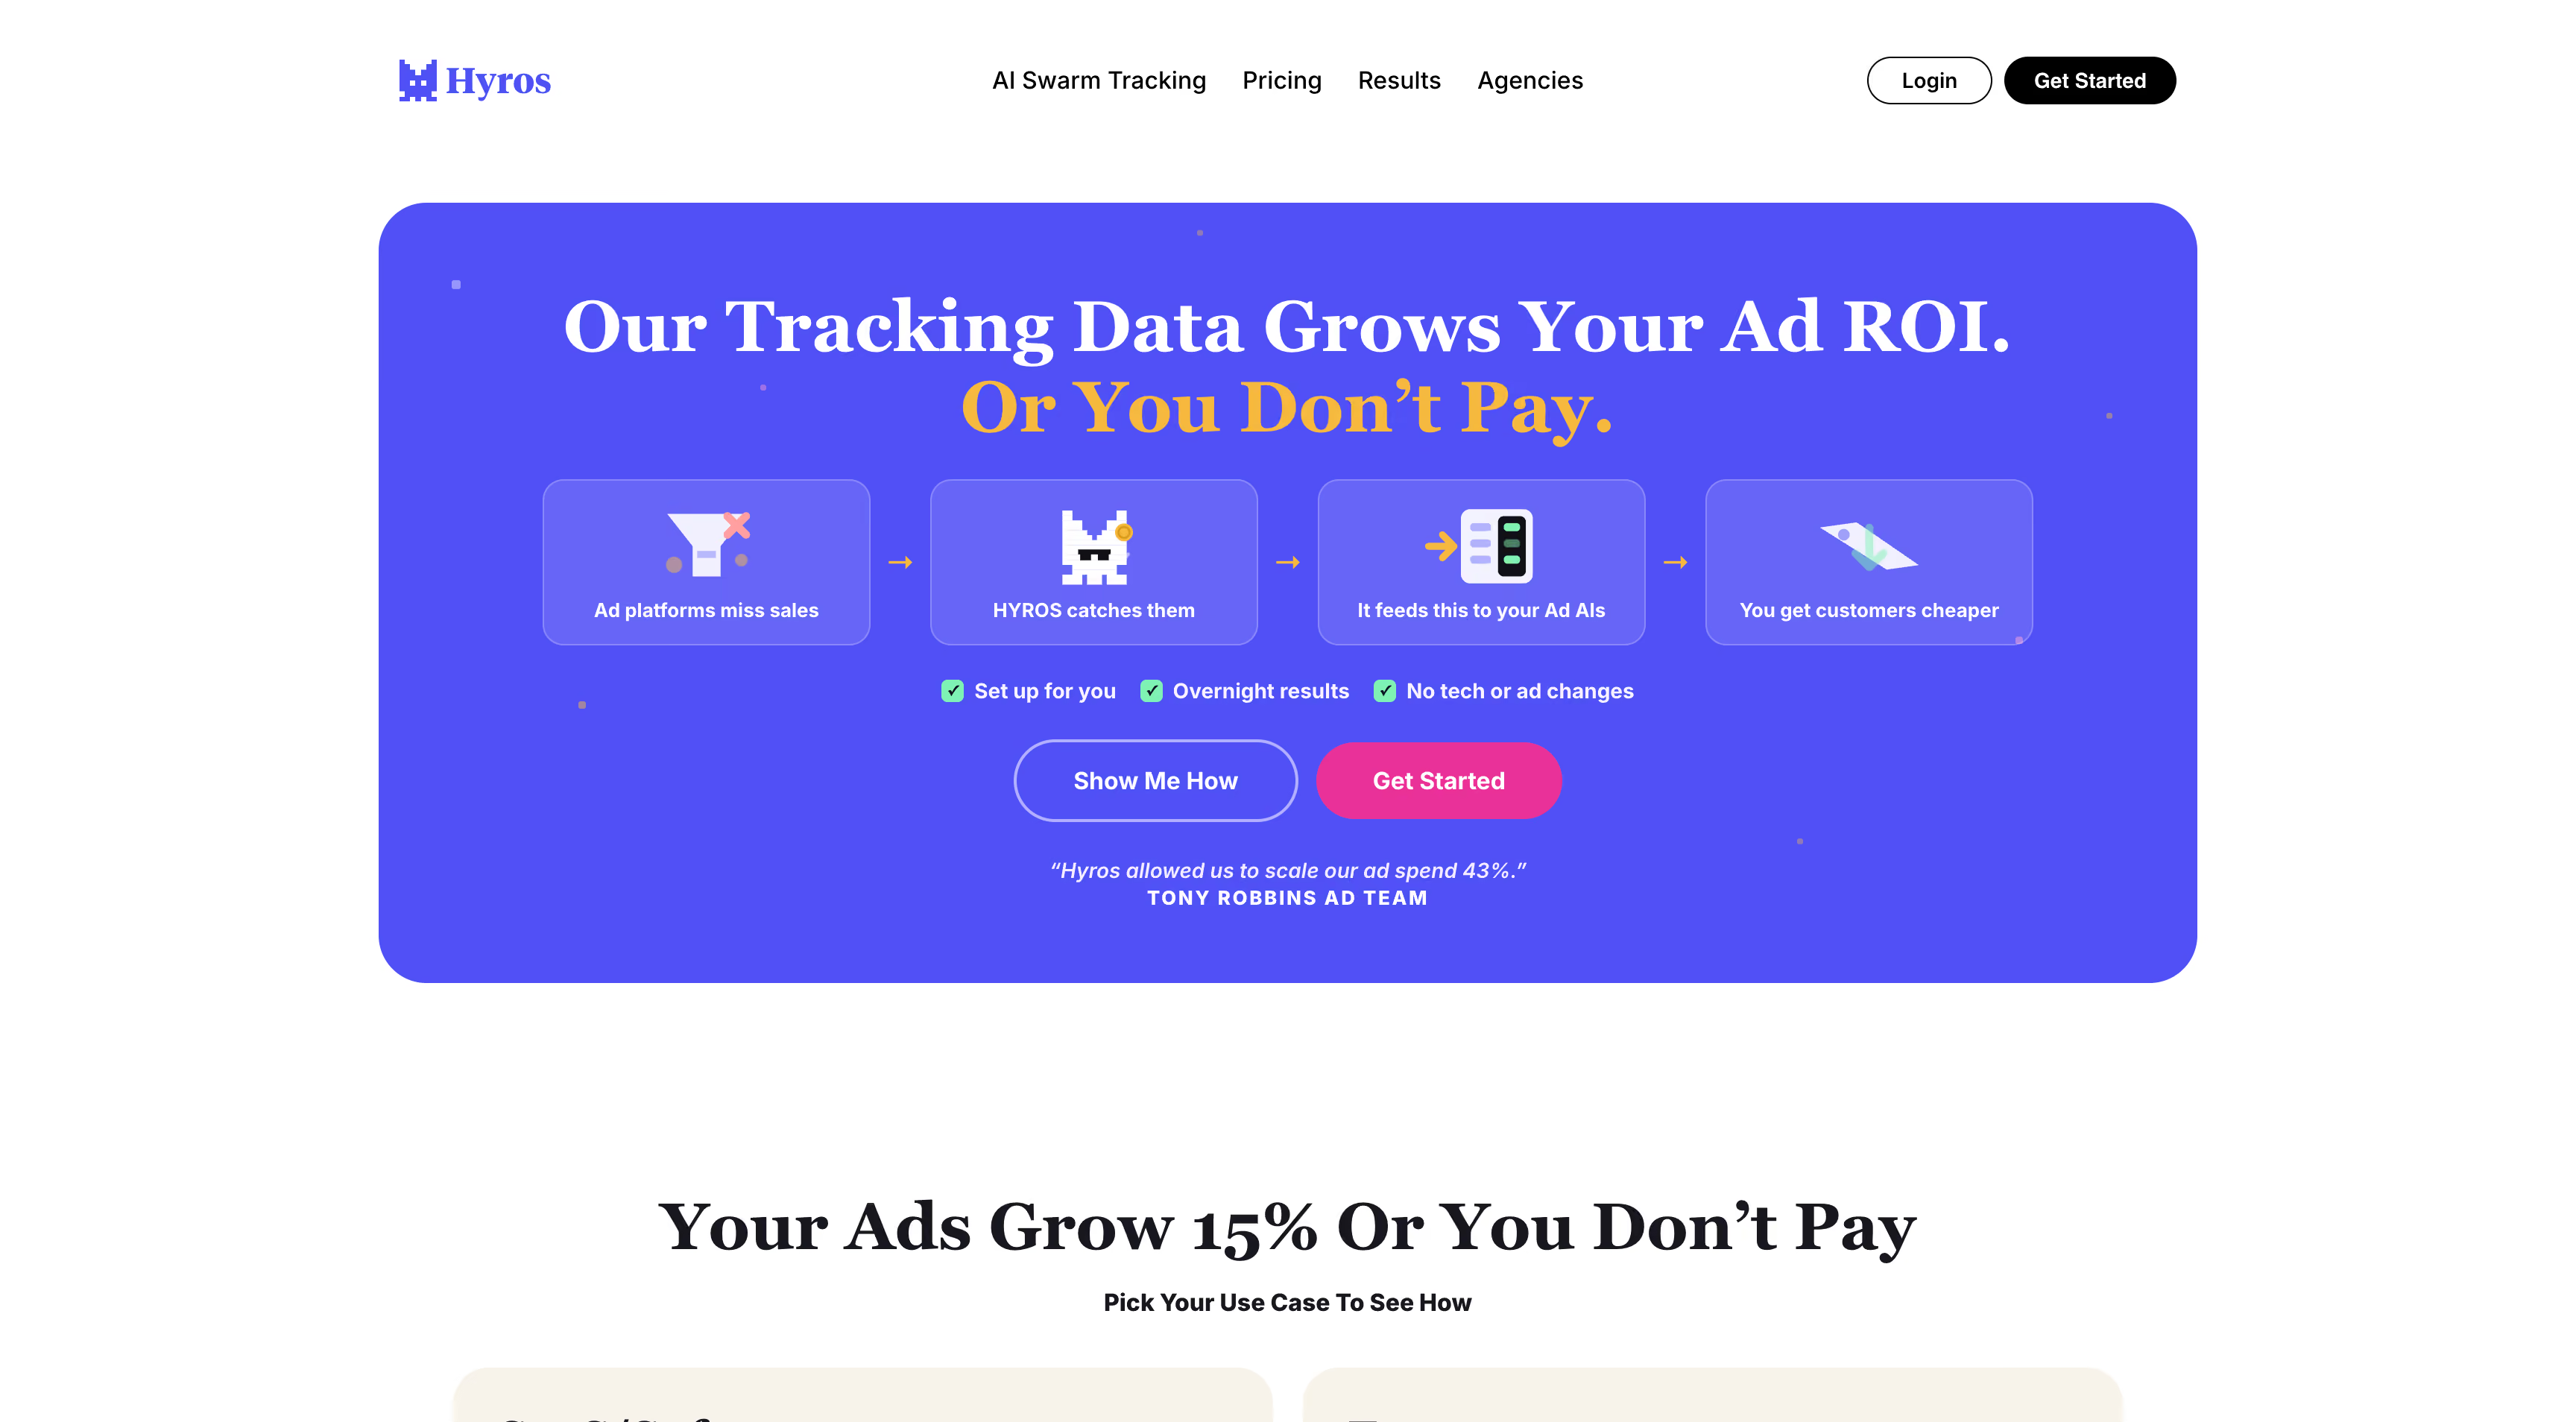
Hyros homepage presenting its identity-based ad tracking for high-ticket funnels

Hyros comes from the info-product world and it shows in the best and worst ways. The tracking is genuinely built for funnels other tools give up on: a first-party script fingerprints the visit, then ties every later order to the same email or phone number, across devices, across months. If your buyer clicks an ad in March, joins a webinar in April and books a call in May, Hyros keeps that on one lead record. It also pushes the recovered conversions back to five ad platforms. What it doesn't do is anything a merchandiser or a CFO would ask for. There's no POAS, no contribution margin, no SKU report, and no model that sizes a channel's impact.

Key features

  • Lead-level identity resolution. Every click, opt-in, call and order attaches to one person via email and phone matching rather than a cookie that expires.
  • AI Pixel Training. Recovered conversions get pushed back to Meta, Google, TikTok, Snapchat and Reddit, with custom rules per event, so the platforms optimize on Hyros data.
  • Five attribution models. First click, last click and linear, plus Scientific and Depreciation, two in-house multi-touch models.
  • Lead Journeys. The full click-by-click path behind a single customer.
  • Chrome extension inside the ad managers. Hyros revenue and ROI sit next to Meta, Google and TikTok's own columns.
  • 90+ integrations, weighted heavily toward payment processors, funnel builders, webinar and scheduling tools. On stores it covers Shopify, WooCommerce, BigCommerce, Magento and TikTok Shops.
  • AIR plus an automation API. AIR identifies visitors and writes one-to-one email and SMS follow-ups; the API can fire automations off any Hyros data point, and an MCP lets Claude or ChatGPT query the data.

Strengths

  • Long-cycle identity matching is the thing Hyros is built around, and it holds up where session-based tools lose the thread.
  • Conversion pushback covers five platforms including Reddit, which is wider coverage than most tools in this comparison manage.
  • The extension puts corrected numbers where media buyers already work.
  • The API and MCP make it a usable data source for automations you build yourself.

Limitations

  • No POAS and no P&L. Profit stops at revenue minus COGS, shipping and taxes. No operating costs, no contribution margin, nothing that reaches EBITDA.
  • No mix modeling or incrementality. No saturation curves, no holdouts. Click attribution is the entire method, which leaves upper-funnel and offline spend unmeasured.
  • Nothing allocates budget. Hyros reports which sources earn and feeds the platforms. Relocating stays manual.
  • Thin on ecommerce reporting. Dashboards are limited to widget views of sources, LTV and CAC. No store metrics, no dedicated SKU performance report, no influencer view.
  • US-hosted and cookie-based. 

Hyros pricing

A Shopify track starts around $69/month at $5K tracked monthly revenue. The Business track starts at $230/month on annual billing for up to $20K tracked revenue and scales through tiers to roughly $1,499/month at $750K, custom above that. Agency pricing depends on client volume. Monthly billing costs meaningfully more than the displayed annual rates, and there's a 90-day refund window instead of a trial.

Hyros reviews

4.9 average, and the sentiment is polarized. Tracking accuracy and the assigned onboarding analyst draw consistent praise. The recurring complaints are pricing opacity, the mandatory sales call, and an interface that people describe as dated next to the Shopify-native tools.

Bottom line

If your funnel runs through calls, webinars and email over weeks, Hyros will find attribution that other tools can't. If you run a store and need to know which SKU made money after returns, it isn't built for that question, and no amount of tracking accuracy fixes a missing profit layer.

7.

Wicked Reports

4.2

Best for: agencies and subscription brands with long buying cycles who care most about new-customer acquisition cost and want an independent read across many ad platforms.
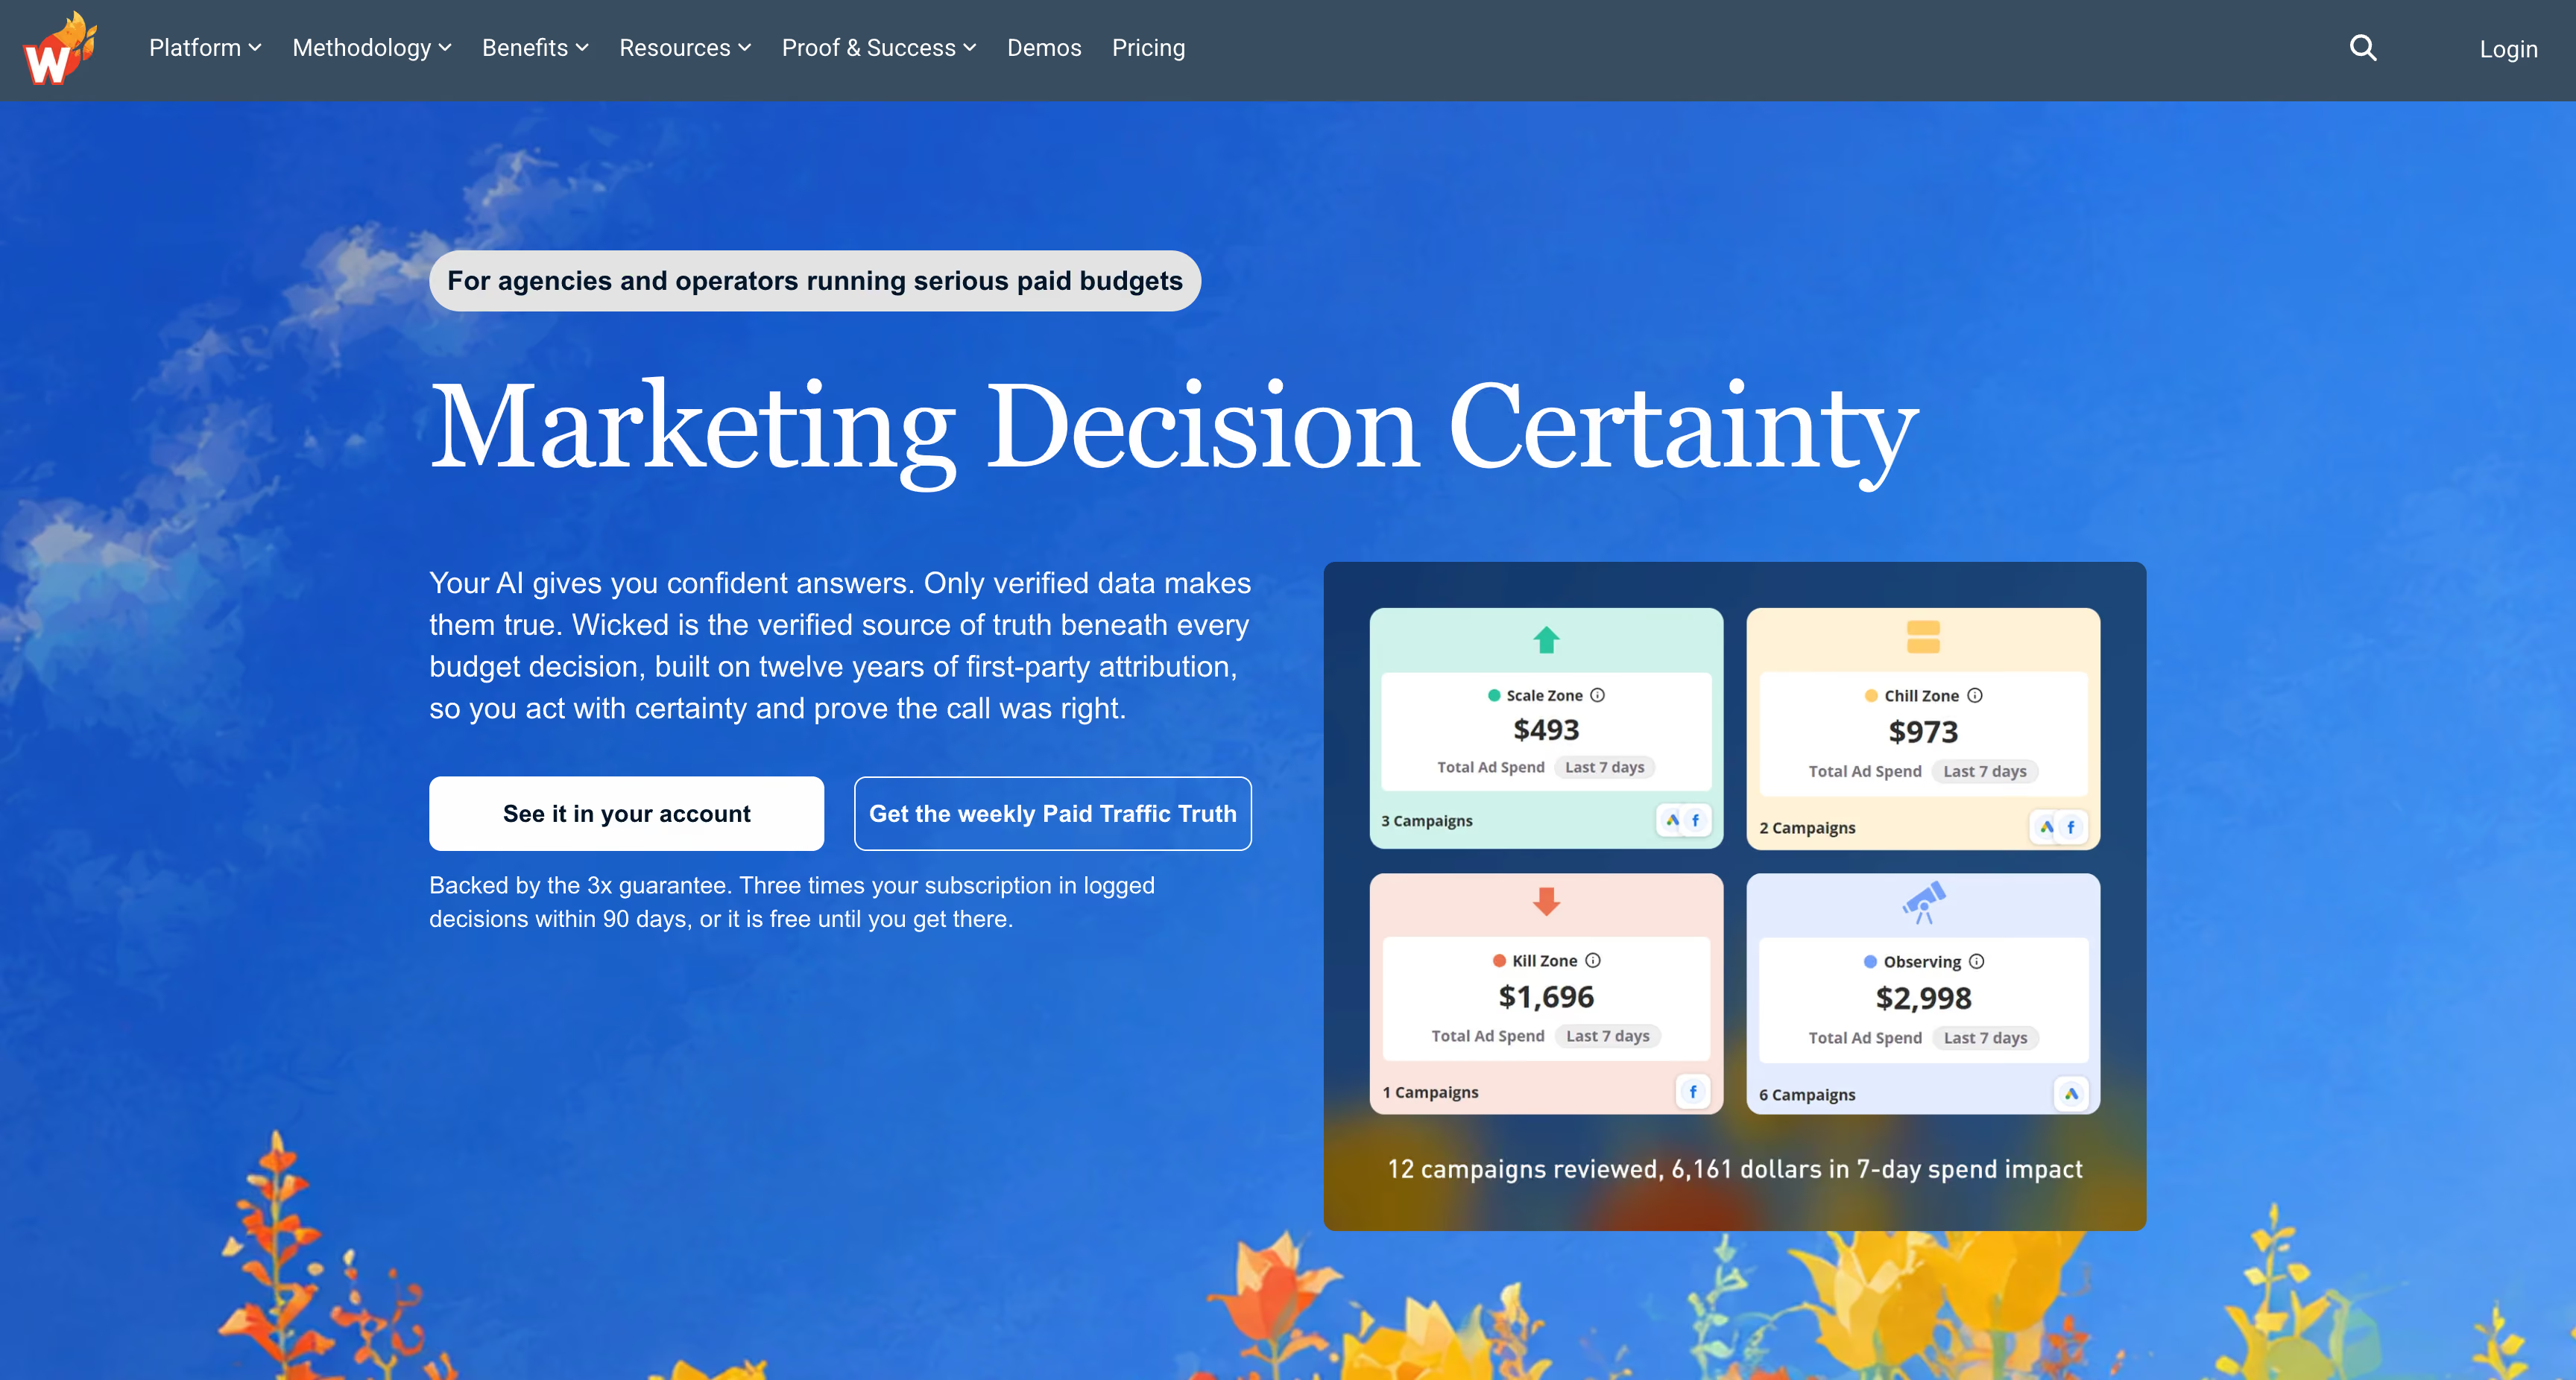
Wicked Reports homepage presenting its new-customer attribution and nCAC reporting

Wicked has been doing click attribution since before iOS 14 made it fashionable, and the product still reflects that origin. It logs the click server-side, then matches every later order back through order ID and CRM record, with lookback and look-forward windows you can stretch to lifetime. The methodology has a name and a point of view: five forces, nightly analysis, a Scale / Chill / Kill call on every channel. Where it falls short is everything past the click. There's no COGS in the platform at all, so a channel that returns 4x on garbage margin looks like a winner.

Key features

  • Six models you can combine. First click, first opt-in, last click, re-opt-in, linear and full impact, with your own lookback and look-forward windows.
  • Cookieless server-to-server matching. A first-party script logs the click, and orders reconcile back through order ID and CRM record instead of a surviving cookie.
  • Lifetime lookback and look-forward. Built for businesses where the first order isn't the point, with cohort and LTV reports included on every plan.
  • 5 Forces AI. Nightly strategic analysis that produces Scale, Chill or Kill calls per channel plus tactical fixes.
  • Advanced Signal. Conversions return to Meta through CAPI, and Google receives 90-day post-click LTV values.
  • A read-only MCP with a guardrail. Claude and ChatGPT query verified click data, and the server tells the model when tracking is incomplete. 

Strengths

  • The new-customer versus repeat split is treated as the main event, which suits brands where retargeting keeps stealing credit.
  • Combinable models with custom windows give more configurability than most tools here allow.
  • Sending LTV rather than order value to Google is a smarter signal than a flat conversion ping.
  • Flagging incomplete tracking to an AI client is a detail most vendors don't bother with.

Limitations

  • No COGS, anywhere. No POAS, no margin, no P&L. Every decision the tool supports is a revenue decision.
  • No product or SKU reporting, and no returns data. Refunds don't report at all, so nothing tells you which campaigns sold merchandise that came back.
  • No creative analytics and no influencer tracking. For a team judging ads, that's a significant hole; ad-level creative performance lives in another tool.
  • No mix modeling or incrementality. Click attribution is the whole method, it’s not measuring saturation, offline or upper-funnel.
  • It recommends, it doesn't execute. 5 Forces hands you a weekly action plan. Moving the budget stays manual in each ad account.
  • The real price is the $999 tier. Measure starts at $499 for the lowest revenue band, but Advanced Signal and 5 Forces AI are $199 each on top until you reach Maximize, and the enrichment they buy only covers Meta and Google.
  • No Chrome extension, no EU data residency, no free trial, and a dedicated success manager only from the $4,999 Enterprise tier.
  • Dashboards are templates. A library of prebuilt attribution views rather than a builder you can shape around your business.

Wicked Reports pricing

Banded on your trailing 12-month gross revenue. In the entry band, Measure is $499/month, Scale $699, Maximize $999, and Enterprise starts at $4,999. Advanced Signal and 5 Forces AI cost $199/month each on the two lower tiers and come included from Maximize. Pricing is quoted through a call, and there's no trial.

Wicked Reports reviews

4.2, the lowest rating of any tool in this comparison, though the criticism is fairly specific rather than general. Attribution accuracy and the support team draw praise, especially from agencies. The recurring complaints are an interface that feels a generation behind the Shopify-native tools, and a total cost that climbs once the add-ons are on.

Bottom line

A serious attribution engine for long, multi-touch, subscription-shaped funnels, wrapped in a product that stops the moment the click is accounted for. If you already have profit reporting elsewhere and just need a defensible read on acquisition, it does that job. If you wanted one tool, this isn't it.

8.

Tracify

4.9

Best for: EU brands whose biggest measurement problem is the consent banner, and who already own a BI stack for everything downstream of tracking.
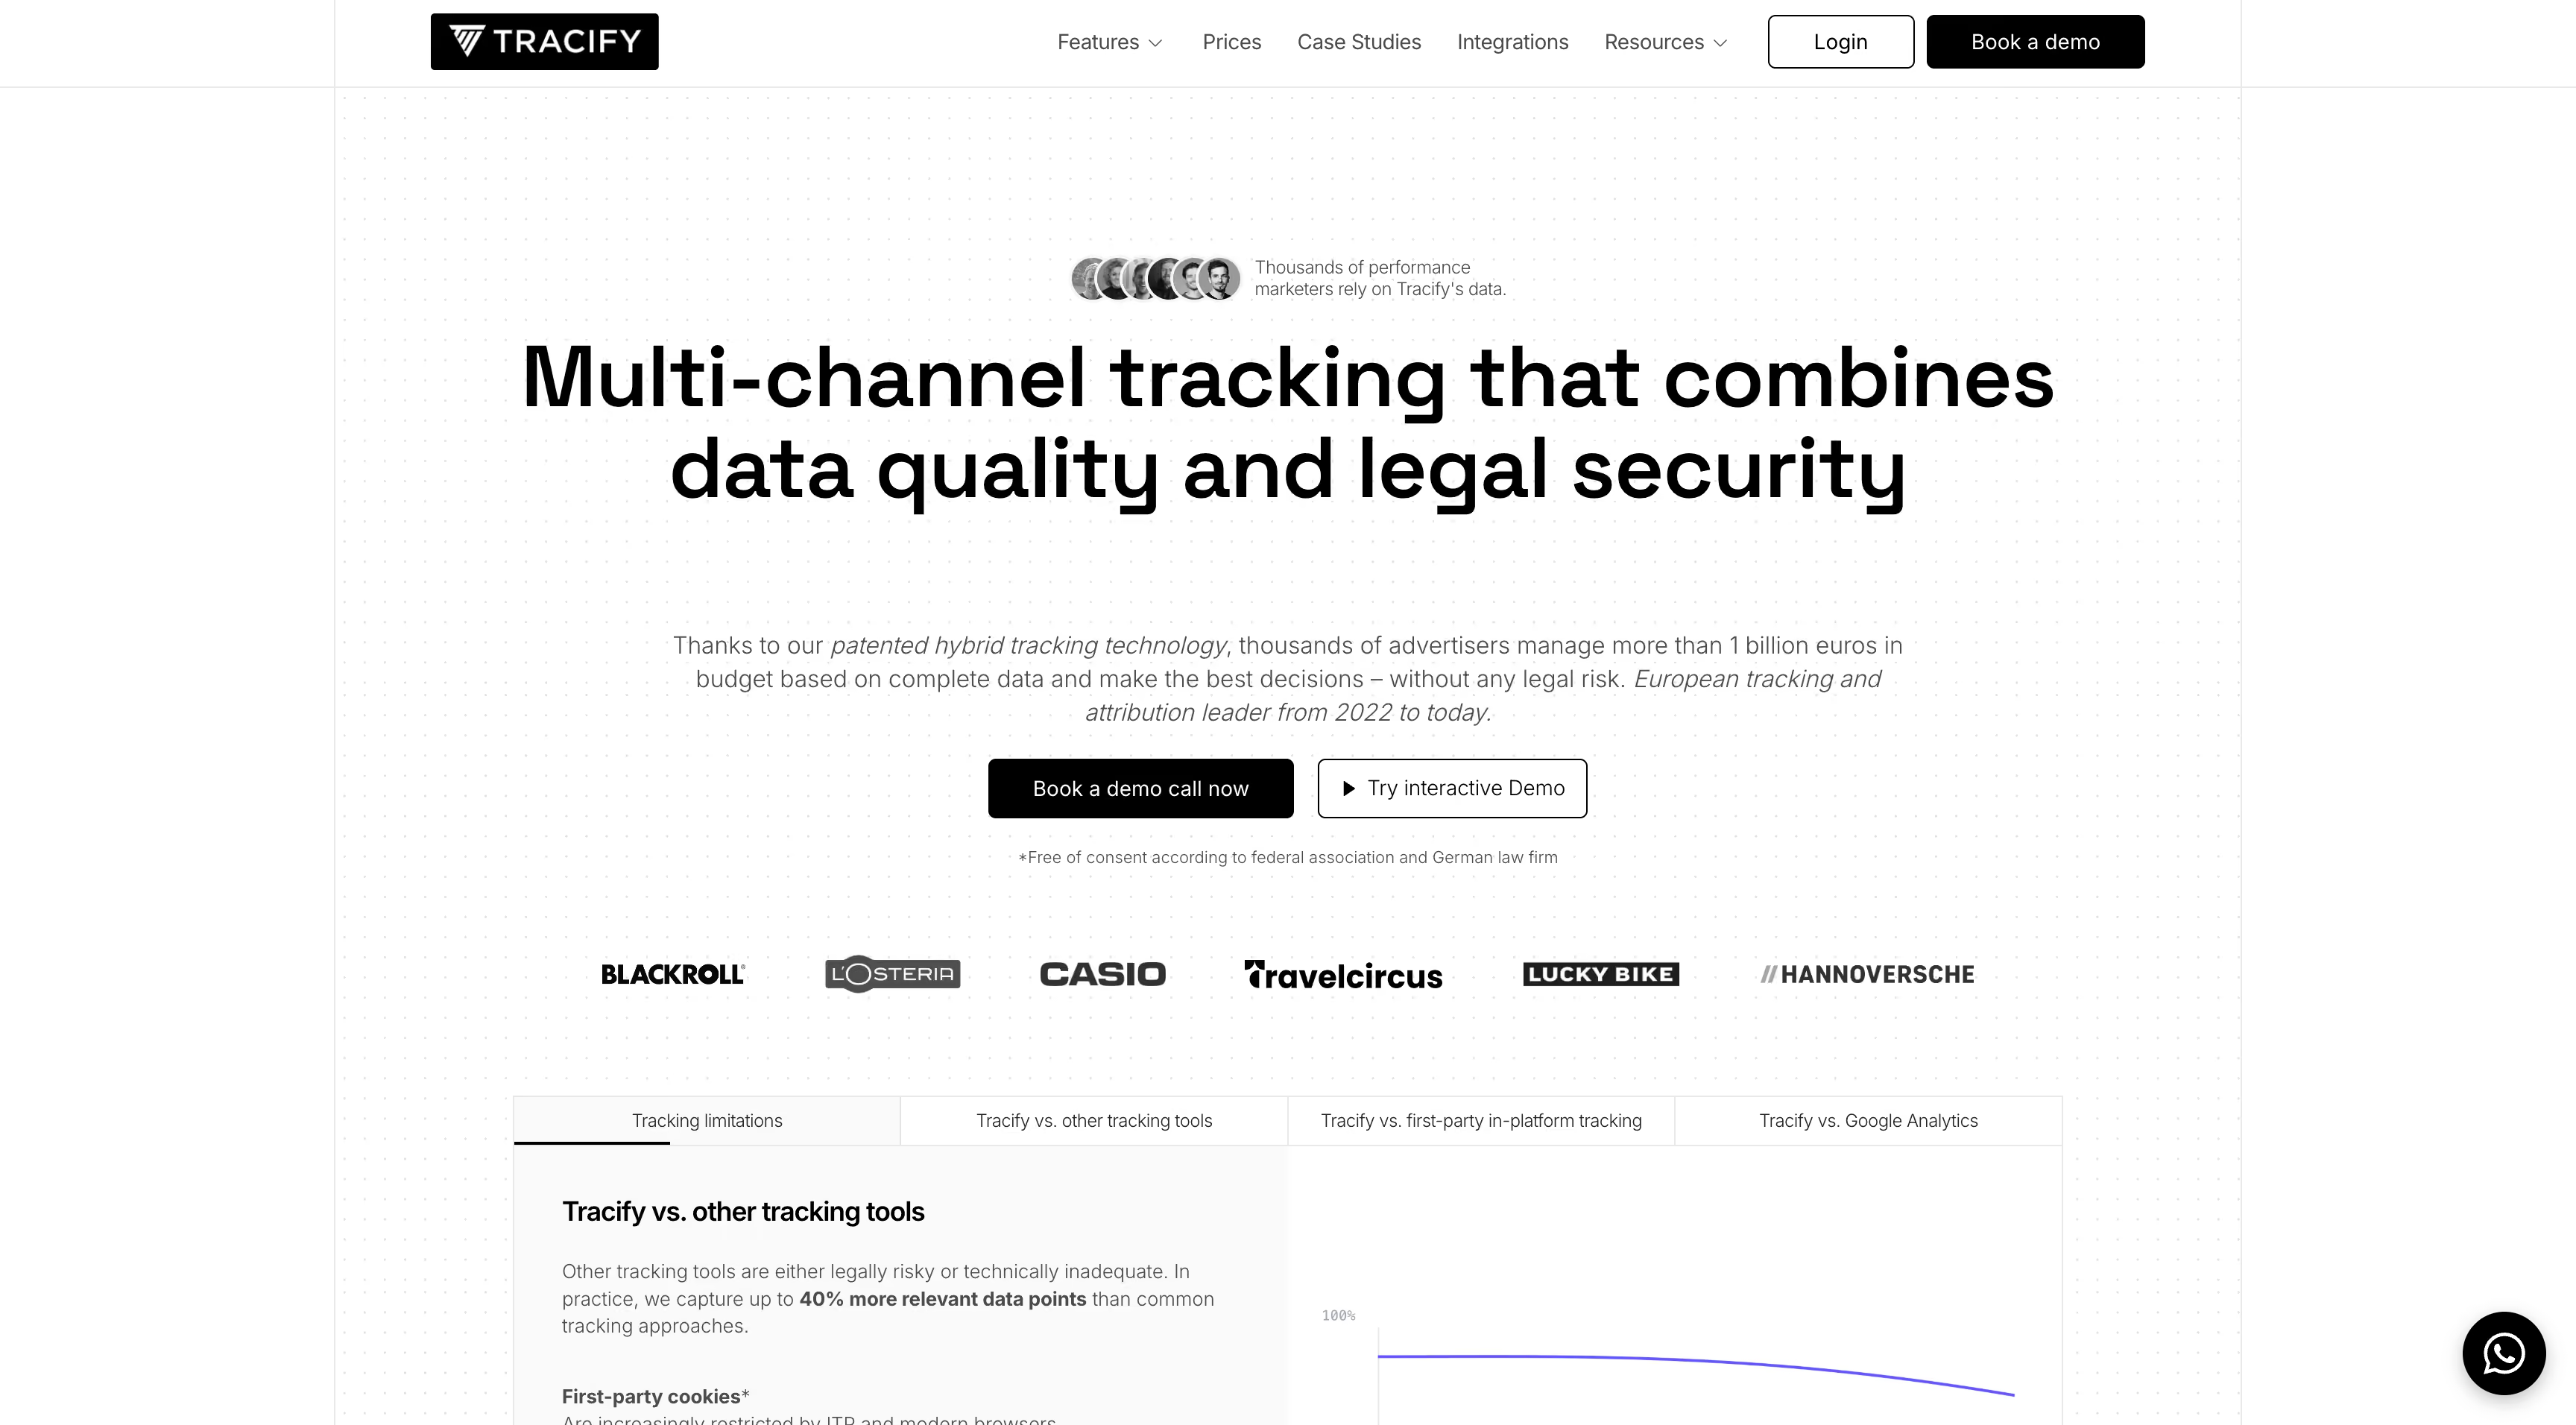
Tracify homepage presenting its consent-free, cookieless tracking for EU ecommerce brands

Tracify solves one problem and charges platform money for it. In DACH, a cookie banner can wipe out a third of your data before any tool gets to see it, and Tracify's answer is a patented collection method that runs without cookies and without a banner at all, anonymizing at the point of capture. The approach has been separately certified as consent-free, the servers are in Munich and Frankfurt, and nothing gets processed outside the EU. For a German brand losing that much signal, this is a real answer to a real problem. Just know what you're buying: this is a tracking layer with dashboards attached.

Key features

  • Consent-free hybrid tracking. Cookieless collection that stitches the same person across devices, domains and sessions without a banner standing between you and the data.
  • Behavior-based AI attribution. A single model weighs each touchpoint per journey rather than giving you rules to choose between, with windows from 7 to 180+ days and the option to exclude channels from credit entirely.
  • Recorded journeys with nothing modeled. Touchpoints are captured over weeks or months and no gaps get filled statistically, so what the dashboard shows is what was observed.
  • German infrastructure with independent certification. Data held in Germany, no processing outside the EU, and the consent-free certified method.
  • 8 dashboards. Marketing overview, per-channel, real-time, journey, creative and influencer views, with creators tracked as their own channel and full journeys attached.
  • Chrome extension for three ad managers. Tracify's numbers appear live inside Meta, Google and TikTok.
  • Webhooks and an open API. No warehouse of its own, but tracking and attribution data pushes straight into whatever BI stack you already run, and the ad-side connector list runs deep into native and display: Taboola, Outbrain, Criteo, plus email, WhatsApp and influencer links.

Strengths

  • Removing the banner from the tracking path attacks the largest single cause of data loss for EU brands, and it's the thing the entire product is built around.
  • Attribution windows past 180 days suit long consideration cycles that most ecommerce tools truncate at 30.
  • Native and display coverage runs deeper than the Shopify-first tools in this list.
  • Feeding your existing warehouse rather than replacing it is a sensible fit if you've already invested in BigQuery or Looker.

Limitations

  • Costs never enter the analytics. There's a P&L view among the dashboards, but no COGS-based margin per campaign and no POAS, so channel decisions still run on revenue.
  • No ecommerce BI at all. No LTV, no cohorts, no product or SKU reporting, no return analytics. Nothing tells you which products or customers the traffic actually produced.
  • One model, take it or leave it. You can't compare the AI's output against first-click or last-click, can't set your own weighting, and have nothing to audit it against when a number looks wrong.
  • No conversion enrichment. This is the sharp one: a tool built to recover the signal everyone else loses sends none of it back to Meta, Google or TikTok, so the ad algorithms never benefit from the cleaner data.
  • No mix modeling or incrementality. Journey capture is the entire method, which leaves offline and upper-funnel spend unmeasured.
  • Nothing acts, and nothing assists. No budget optimizer, no in-product AI, no MCP. Reallocating spend stays manual, and an AI client can't query the data at all.

Tracify pricing

From €500/month for the Shop plan plus a one-off €500 setup fee, with agency pricing on request. A 30-day trial is available, arranged through a demo call.

Tracify reviews

4.9 on G2, from the smallest review base of any tool in this comparison. Reviewers rate support and ease of use highly, and the sample skews almost entirely toward small businesses.

Bottom line

Worth the money if consent-free capture is the specific thing standing between you and accurate numbers, and you have somewhere else to do the profit maths. If you expected the rest of a stack to arrive with it, €6,000 a year plus setup buys less than tools costing half as much.

Best Northbeam alternative: final verdict

For most ecommerce and DTC teams, Admetrics is the Northbeam alternative that answers the complaint that started the search. Tracking runs server-side and first-party, so the conversions a browser pixel drops come back. The recovered signal returns to six ad platforms rather than one. Profit runs through COGS, shipping, fees and returns to SKU level, with returns attributed to the campaigns that caused them. And the Allocator turns the result into a budget move instead of a recommendation. It opens at a quarter of Northbeam's entry price, with a free data audit and a trial before you commit.

READY TO STOP GUESSING?

See what your ad platforms aren't telling you

Connect Shopify and your ad accounts, and see POAS per channel.
Start free trial →
Easy setup
No code required
21 Day Trial
60%
ROAS increase
+30%
Conversions tracked
4,97
Average review rating
50%
Less "unknown" revenue

Frequently Asked Questions

What is the best Northbeam alternative?

For most ecommerce brands, Admetrics. It closes the two gaps that push teams off Northbeam: browser-based tracking, and reporting that ends at ROAS. Admetrics logs conversions server-side and recovers 20 to 30% of the orders a pixel drops, returns that enriched signal to six ad platforms instead of one, and calculates POAS net of COGS, shipping, fees and returns down to the SKU. It starts at $399 a month against Northbeam's $1,500. The other Northbeam alternatives in this list win on narrower jobs: Rockerbox for offline and TV measurement, Polar Analytics for teams that want to own the warehouse, Klar for German hosting, Hyros for funnels built on calls and webinars.

Who are Northbeam's main competitors in marketing attribution and analytics?

Northbeam competitors in marketing attribution split into three groups. Profit-led ecommerce platforms (Admetrics, Polar Analytics, Klar) that carry the number past revenue into contribution margin. Ecommerce analytics suites (Triple Whale) that trade attribution depth for breadth and an AI layer. And measurement specialists (Rockerbox, Hyros, Wicked Reports, Tracify) that go deep on one methodology, whether that's offline channels, long-window click tracking or consent-free capture. Which Northbeam competitors matter to you depends on whether your problem is the price, the missing profit layer, or the tracking itself.

How much does Northbeam cost?

Northbeam pricing starts at $1,500 a month for Starter, billed against your data volume, with Professional and Enterprise quoted on request. There's no free trial, so you commit before you see it run on your own numbers. Two details buyers miss when comparing Northbeam pricing plans: store integrations beyond Shopify sit behind the higher tiers, and MMM+ isn't on the entry plan either. Most Northbeam alternatives in this comparison open between $200 and $500 a month, and several publish their rates rather than gating them behind a call.

What is Northbeam MTA, and how many attribution models does it offer?

Northbeam MTA spreads conversion credit across seven models: first touch, last touch, linear, and proprietary click and view variants. You rotate between them; you can't define your own credit rules. The bigger constraint isn't the model count, it's what feeds it. Touchpoints are recorded by a browser pixel, so a visit only counts if the script fires and the UTMs survive the trip. Server-side alternatives capture the journeys that a pixel never sees, which changes the input rather than the math.

Does Northbeam track profit, or only ROAS?

Only ROAS. COGS never reaches a report in Northbeam, so there's no contribution margin, no P&L, and no cohort or LTV view in the platform. Refunds appear as a channel and campaign metric with no product breakdown and no link back to margin. In practice that means a campaign returning 3.2x on thin margin and one returning 3.2x on healthy margin look identical on screen, and you find out which was which at the end of the quarter. This is the single most common reason teams start shopping for Northbeam alternatives.

What do Northbeam reviews say?

Northbeam reviews average 4.1 on G2, and they follow one consistent pattern: the attribution gets credited, everything around it gets criticized. Accuracy is rarely disputed. Cost, onboarding time and general complexity recur even inside five-star entries, and several reviewers describe the modeling as difficult to interrogate or explain internally. Read enough of them and the picture is a capable measurement engine that asks a lot of the team running it.

Does Northbeam have AI tools for ecommerce?

Not inside the product. Northbeam has no conversational assistant to ask a question of, and its MCP server is read-only, so Claude or ChatGPT can read your data but can't act on it. Among Northbeam alternatives, this is where the gap has widened fastest. Triple Whale's Moby executes campaign changes inside guardrails you set, Polar runs an agent suite, and Admetrics pairs Ava with a native MCP that lets an AI client query attribution and budgets and then act on them.