

Ranking weighs four things, in this order:
Pricing is quoted as published in August 2026. Where a vendor publishes nothing, that's stated as quote-only rather than filled in with a guess.
Best for: ecommerce and DTC brands that want multi-touch credit and contribution margin in the same view, on tracking collected server-side rather than in a browser that increasingly refuses to cooperate.
Switch a report from last-click to linear and Meta prospecting goes from 1.8x to 3.4x. Nothing about the business changed overnight, only the rule splitting the credit. Which is why the model you pick matters less than the data feeding it and the costs sitting on top of it.
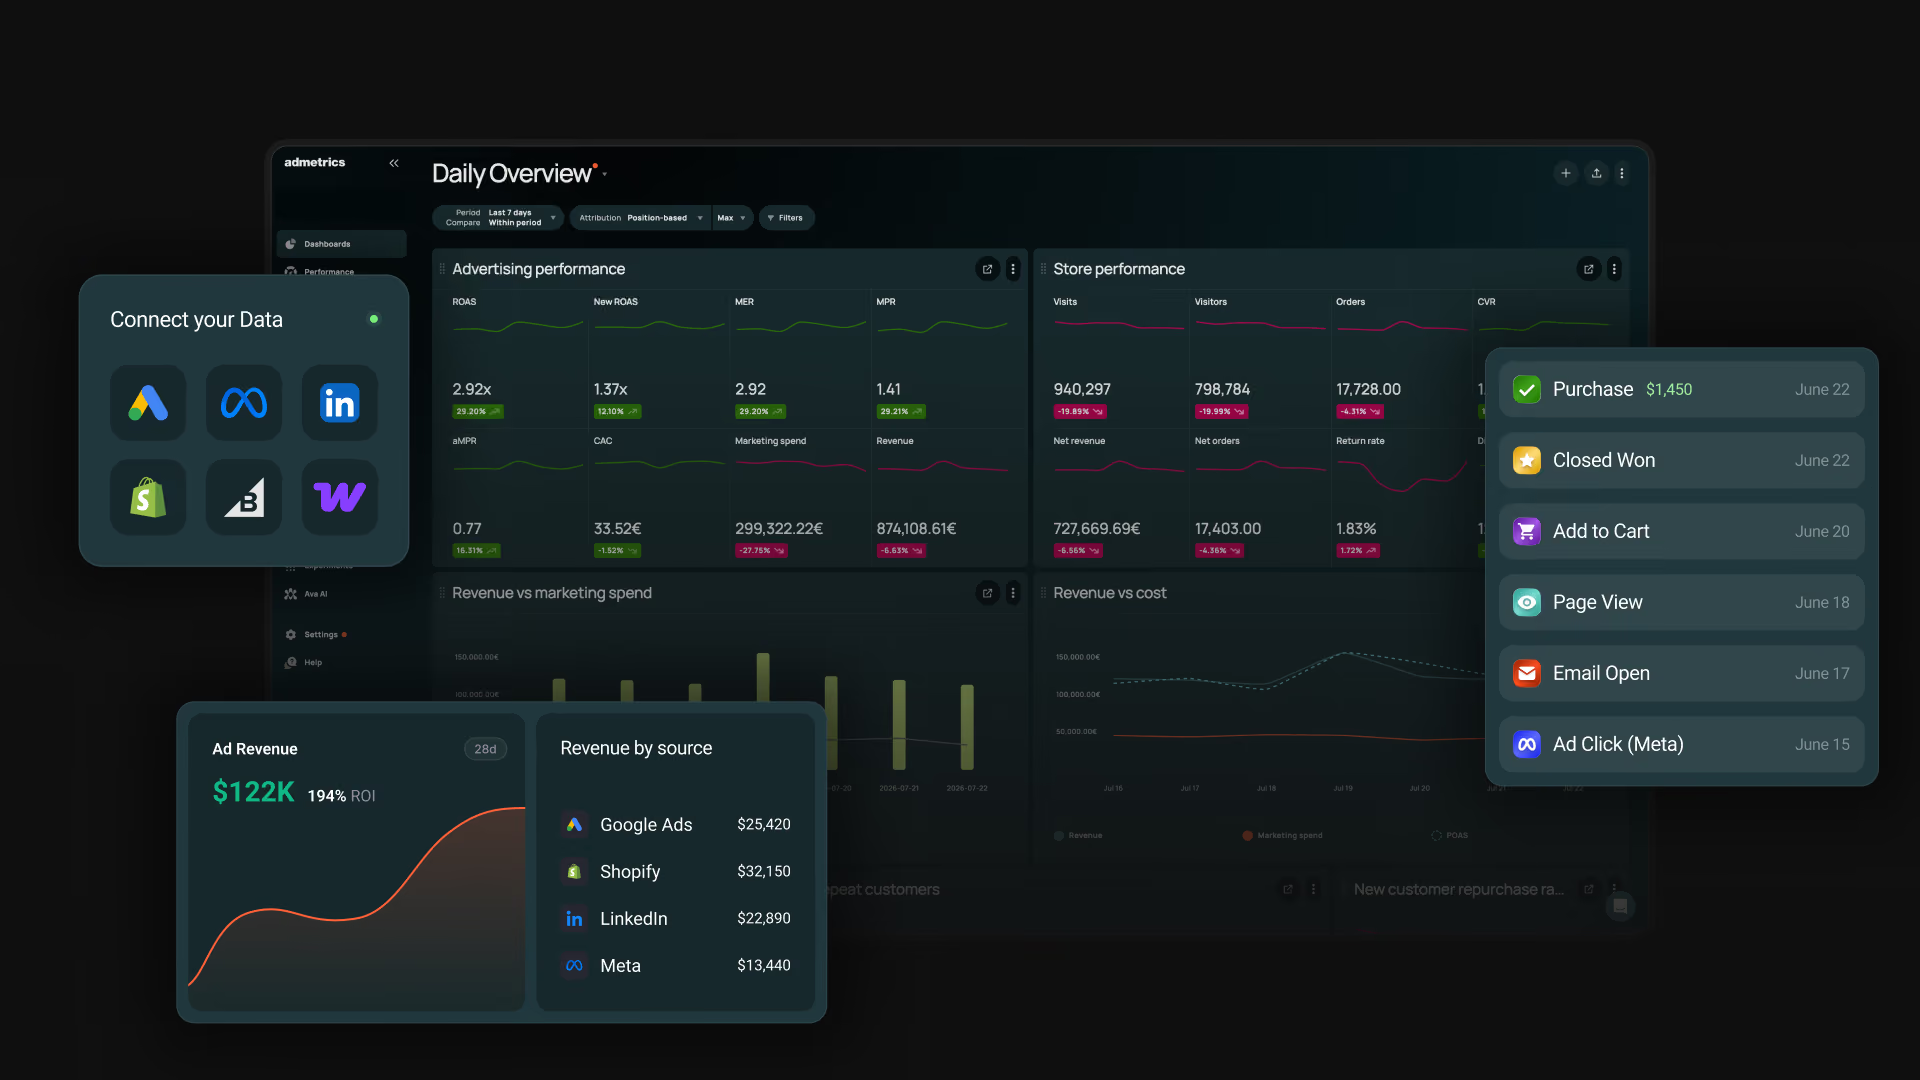
Admetrics is built at both ends of that problem. Conversions are collected on the server rather than in the browser, your product costs and returns sit above them, and nine multi-touch attribution models in between decide who gets credit. German platform, German servers, and it takes for granted that you sell physical goods with margins, refunds and repeat buyers.
Plans are priced against monthly marketing spend rather than seats, so nobody is locked out by a licence count. Growth runs $399 a month with the first $20,000 of spend included and 1.5% beyond it. Business is $899, covers $70,000, and cuts the overage to 1%. Premium is quoted individually and unlocks PRISMA, S2S data sharing, API access and a dedicated success manager. Every plan includes a 21-day trial and multi-shop support.
The average sits at 4.97, the highest here. Two themes repeat: the distance between what Admetrics reports and what the ad platforms claim, and a support team that helps read the numbers. Results back it up. ESN & More cut CAC by 70% while revenue climbed 81%, and Ehrenkind logged a 60% ROAS gain with cost per order down 25%.
Most multi-touch attribution software measures and stops. This one carries a conversion from the server that recorded it, through margin, into a budget split, which is why it opens the ranking.
Best for: brands spending six figures a month across Meta, Google, TikTok and CTV who need one number the media team and the CFO both accept.
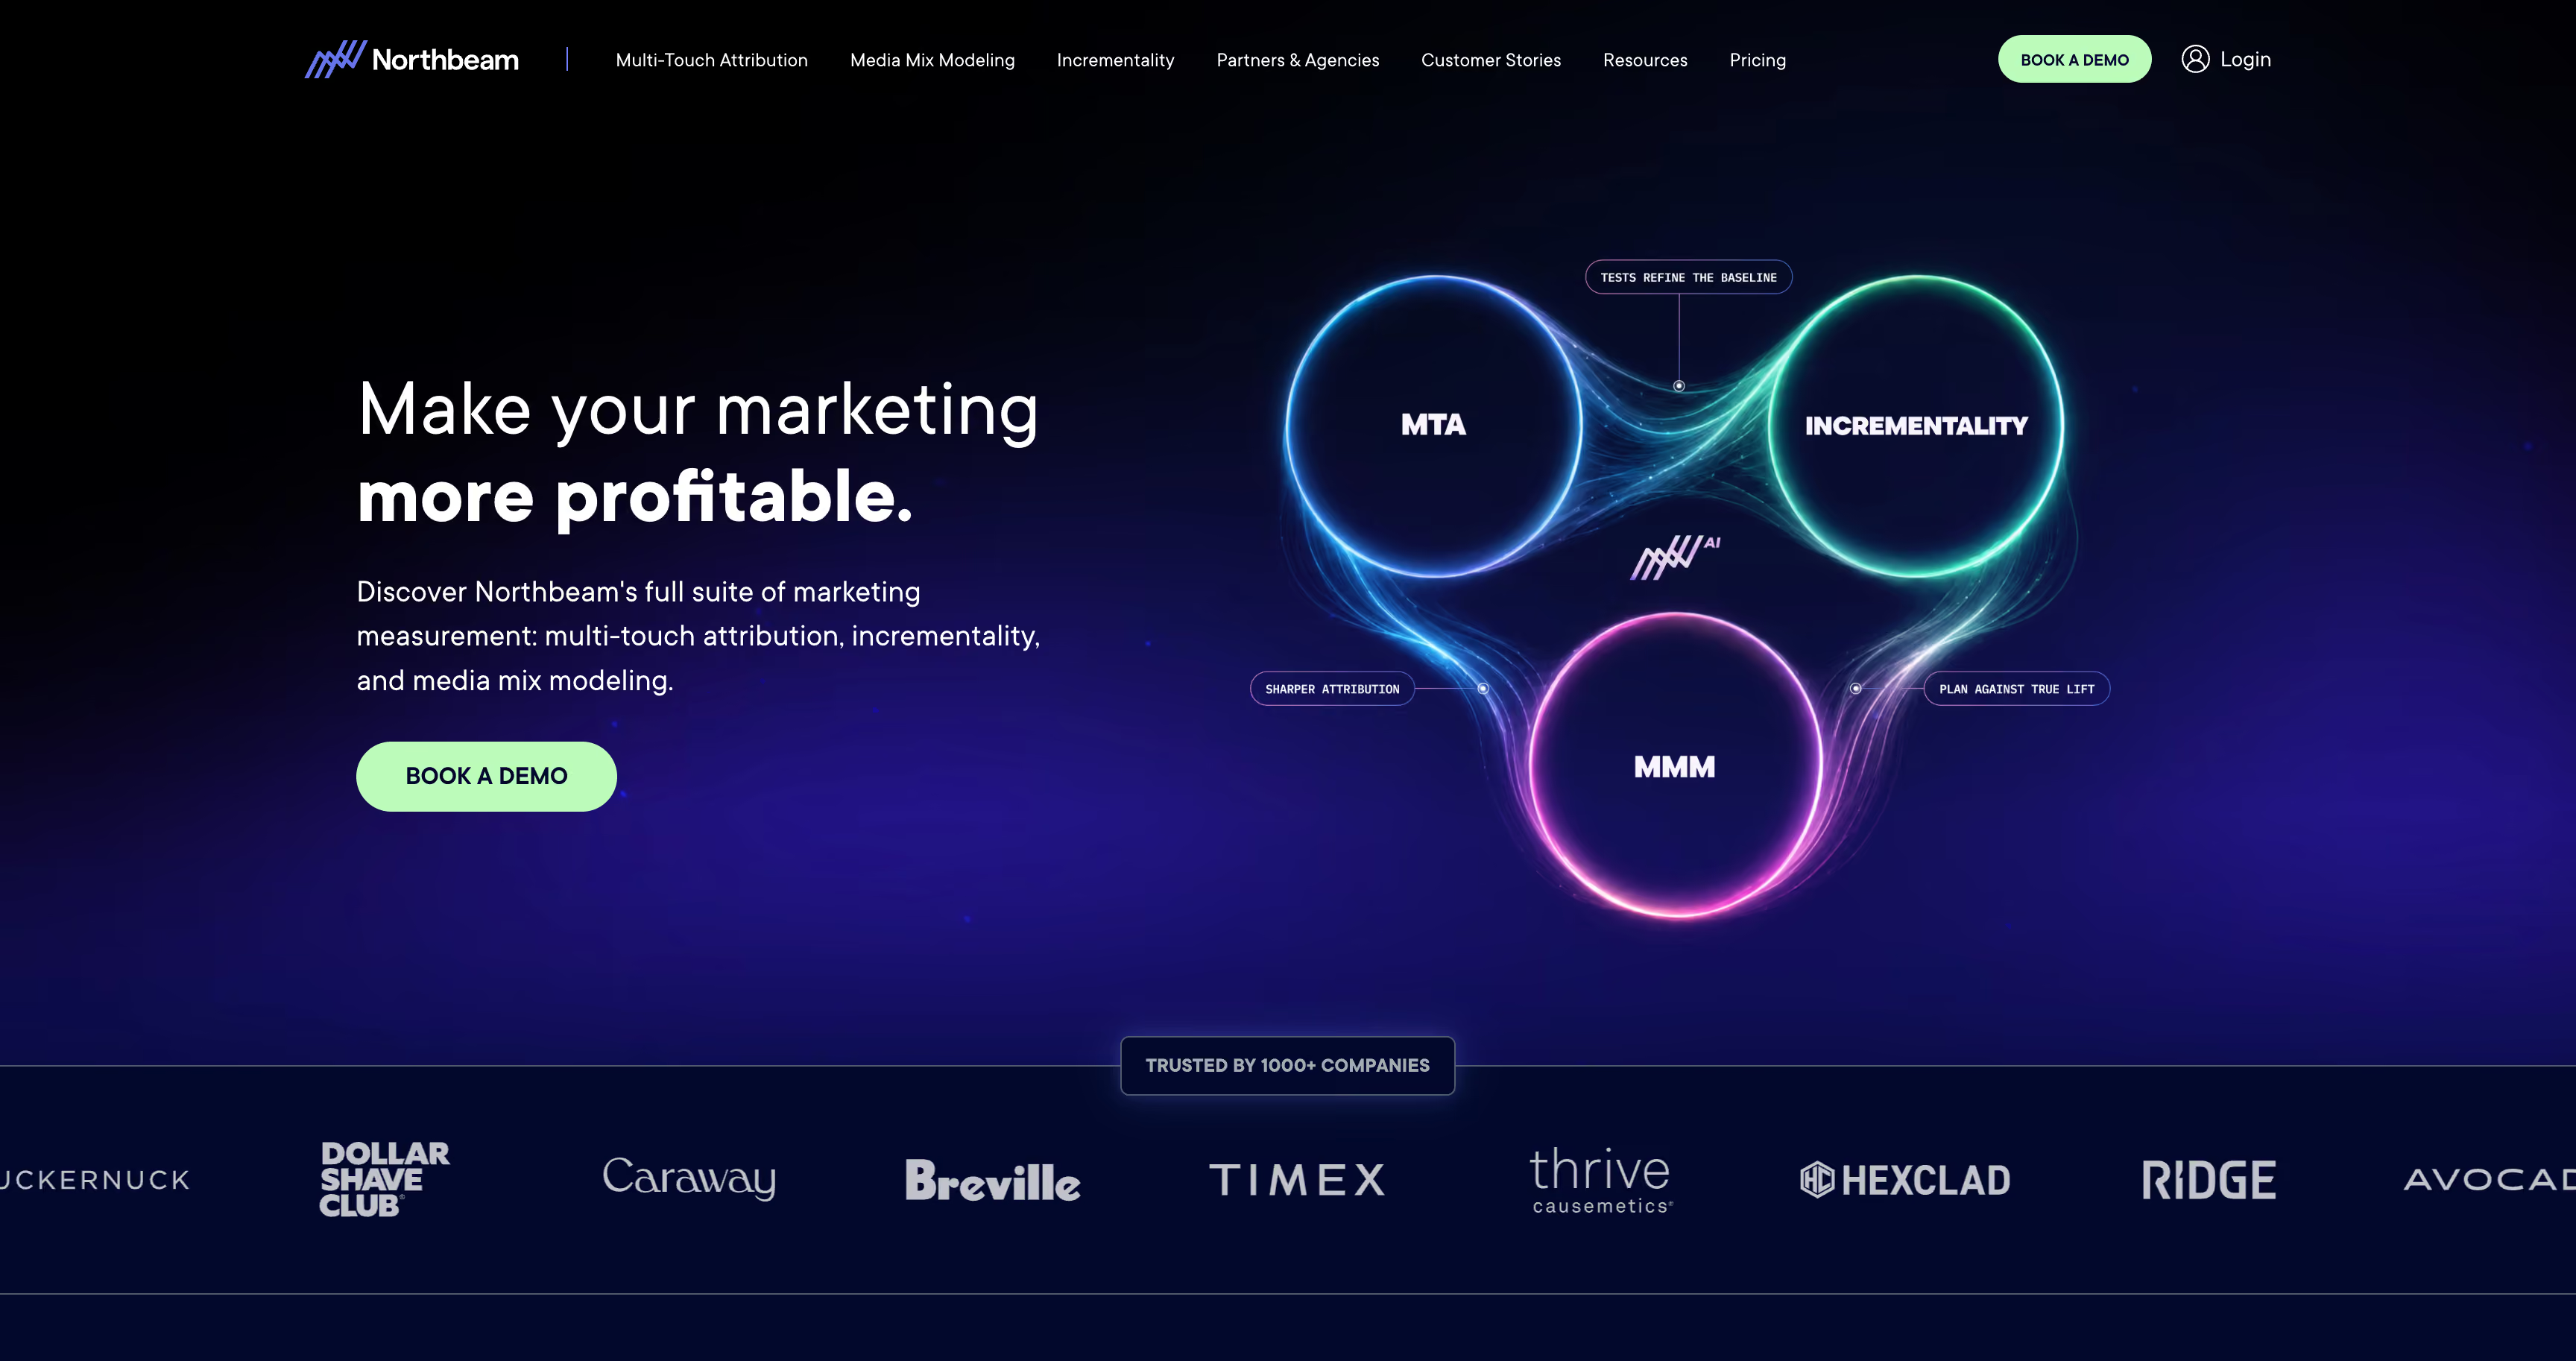
Northbeam's bet is that the hardest part of multi-touch attribution isn't dividing credit, it's seeing the impression nobody clicked. Its Clicks + Deterministic Views model, launched in late 2025 with Meta, TikTok, Snapchat and Pinterest as named partners, awards view credit only when the platform itself verifies the impression and ties it to a purchase. That's a narrower claim than the modeled view-through most vendors sell, and a more defensible one. It reads as an instrument panel built for a media team with an analyst on it, which is both the appeal and the catch.
Starter starts at $1,500 a month, billed monthly against your data volume, month-to-month, with a direct Shopify integration and email support — aimed at brands under $1.5M a year in media. Professional is quoted, opens above $250K a month in spend, connects to any ecommerce platform, moves to predictable flat-rate annual billing and adds a dedicated media strategist. Enterprise is quoted, opens above $500K a month, and is where MMM+ becomes available as an option, alongside a dedicated CSM, Slack-channel support and paid add-ons for multi-region instances, higher refresh rates and touchpoint-level exports. No free plan, no trial.
Attribution accuracy dominates the praise. Complexity, learning curve and cost dominate the complaints, turning up inside five-star reviews as often as critical ones. Nobody says the numbers are wrong. Plenty say it took a while to understand them, and lower-spend accounts report thinner live support.
One of the best pure multi-touch attribution engines here, and deterministic view-through is a real advance for impression-heavy media. What you don't get is anything past the measurement itself, no margin, no cohorts, and a budget recommendation someone still has to execute by hand.
Best for: Shopify brands that want multi-touch attribution, BI and an AI layer that can actually change a campaign, all from one login.
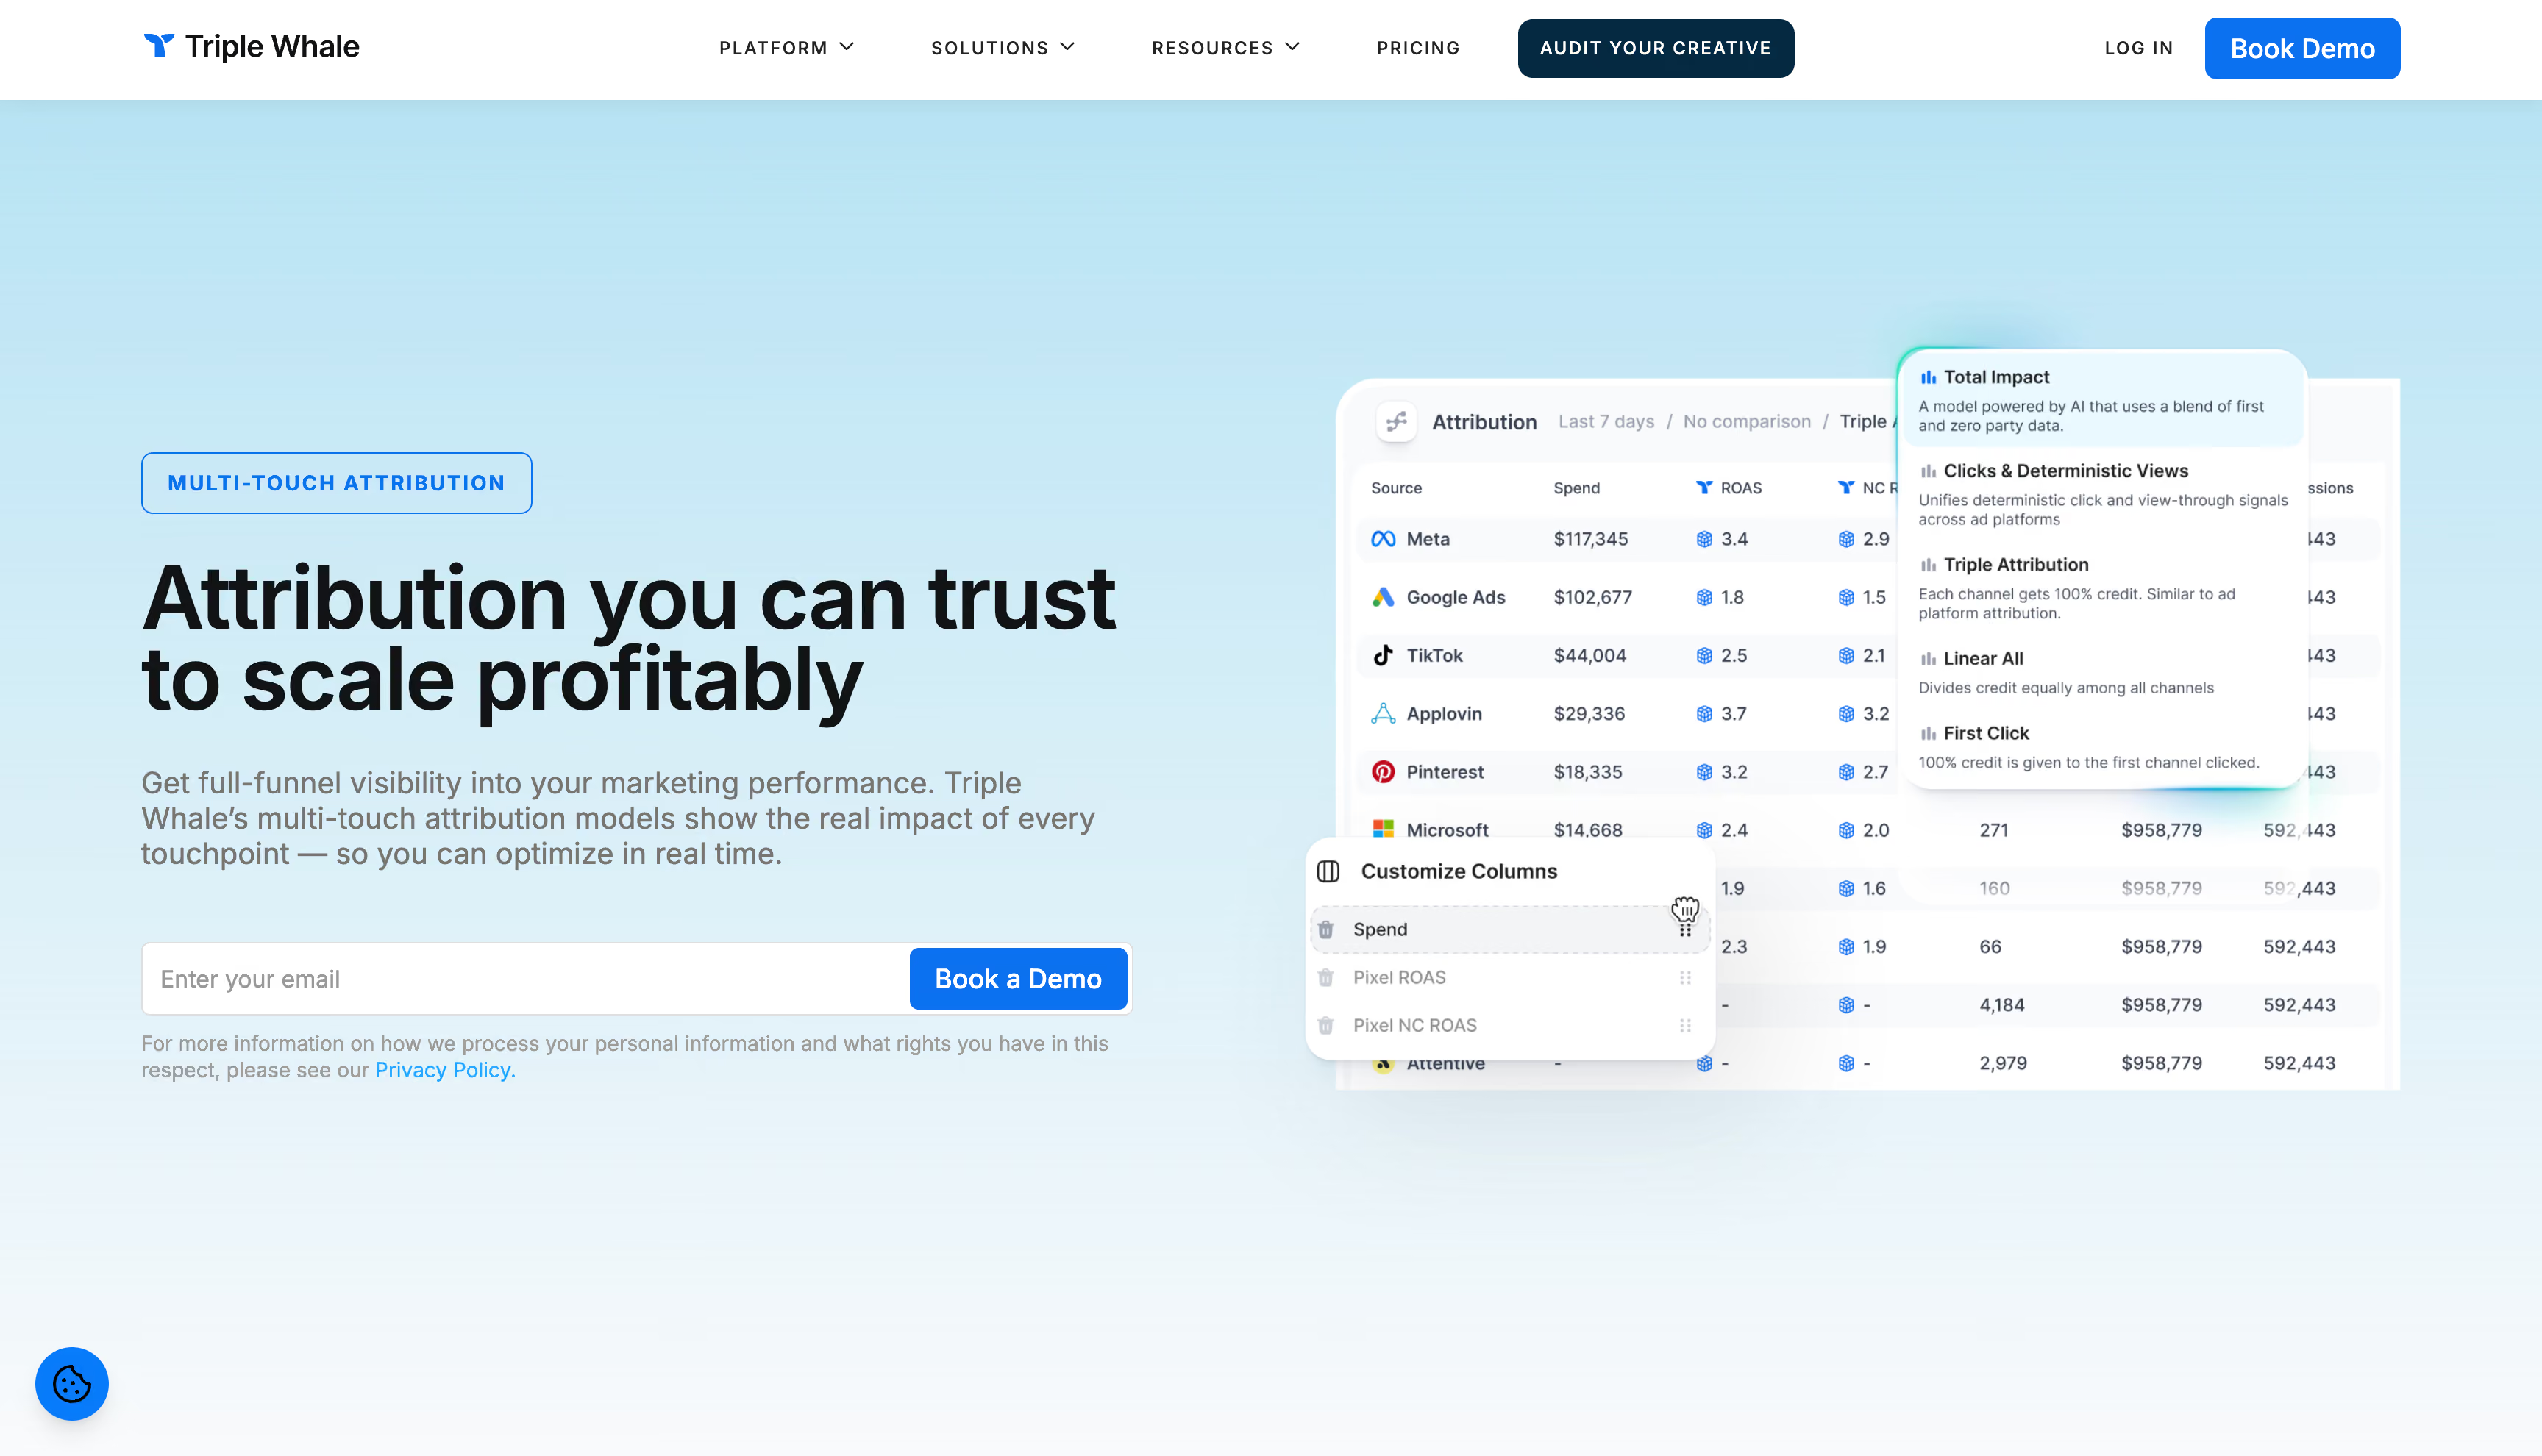
Triple Whale started as a real-time profit dashboard for Shopify operators and has spent two years turning into something closer to an operating system: 60+ integrations and an AI called Moby that no longer just answers questions but pauses underperformers and scales winners inside your guardrails. Breadth is the pitch, and breadth is the trade-off.
Free for a single dashboard with first and last-click attribution. Paid plans price on annual GMV: Foundation from $219 a month, Automate from $749 at the lowest revenue tier, both climbing steeply as GMV does, with brands in the $2.5M–$5M range reporting figures nearer $799 and $1,799. Enterprise is quoted. Paid tiers are 12-month commitments. Retention and conversion add-ons run $19 and $79 a month; Compass is quoted separately.
4.3 across roughly 480 reviews. Praise clusters on the single-pane view and speed to value. Complaints land on two things: attribution figures that don't reconcile with the ad platforms, and pricing that jumps when GMV crosses a tier boundary. Moby draws strong opinions both ways, useful on routine questions, uneven on complex ones.
One of the broadest multi-touch attribution platforms here, and the right call for a Shopify brand that would rather run one tool at 80% than five at 100%. The gap that matters for this list is profit. Gross margin isn't enough to rank campaigns on when returns and fulfilment are where DTC margins actually die.
Best for: media buyers running manual bid strategies on large daily budgets who need attribution that updates in near real time.
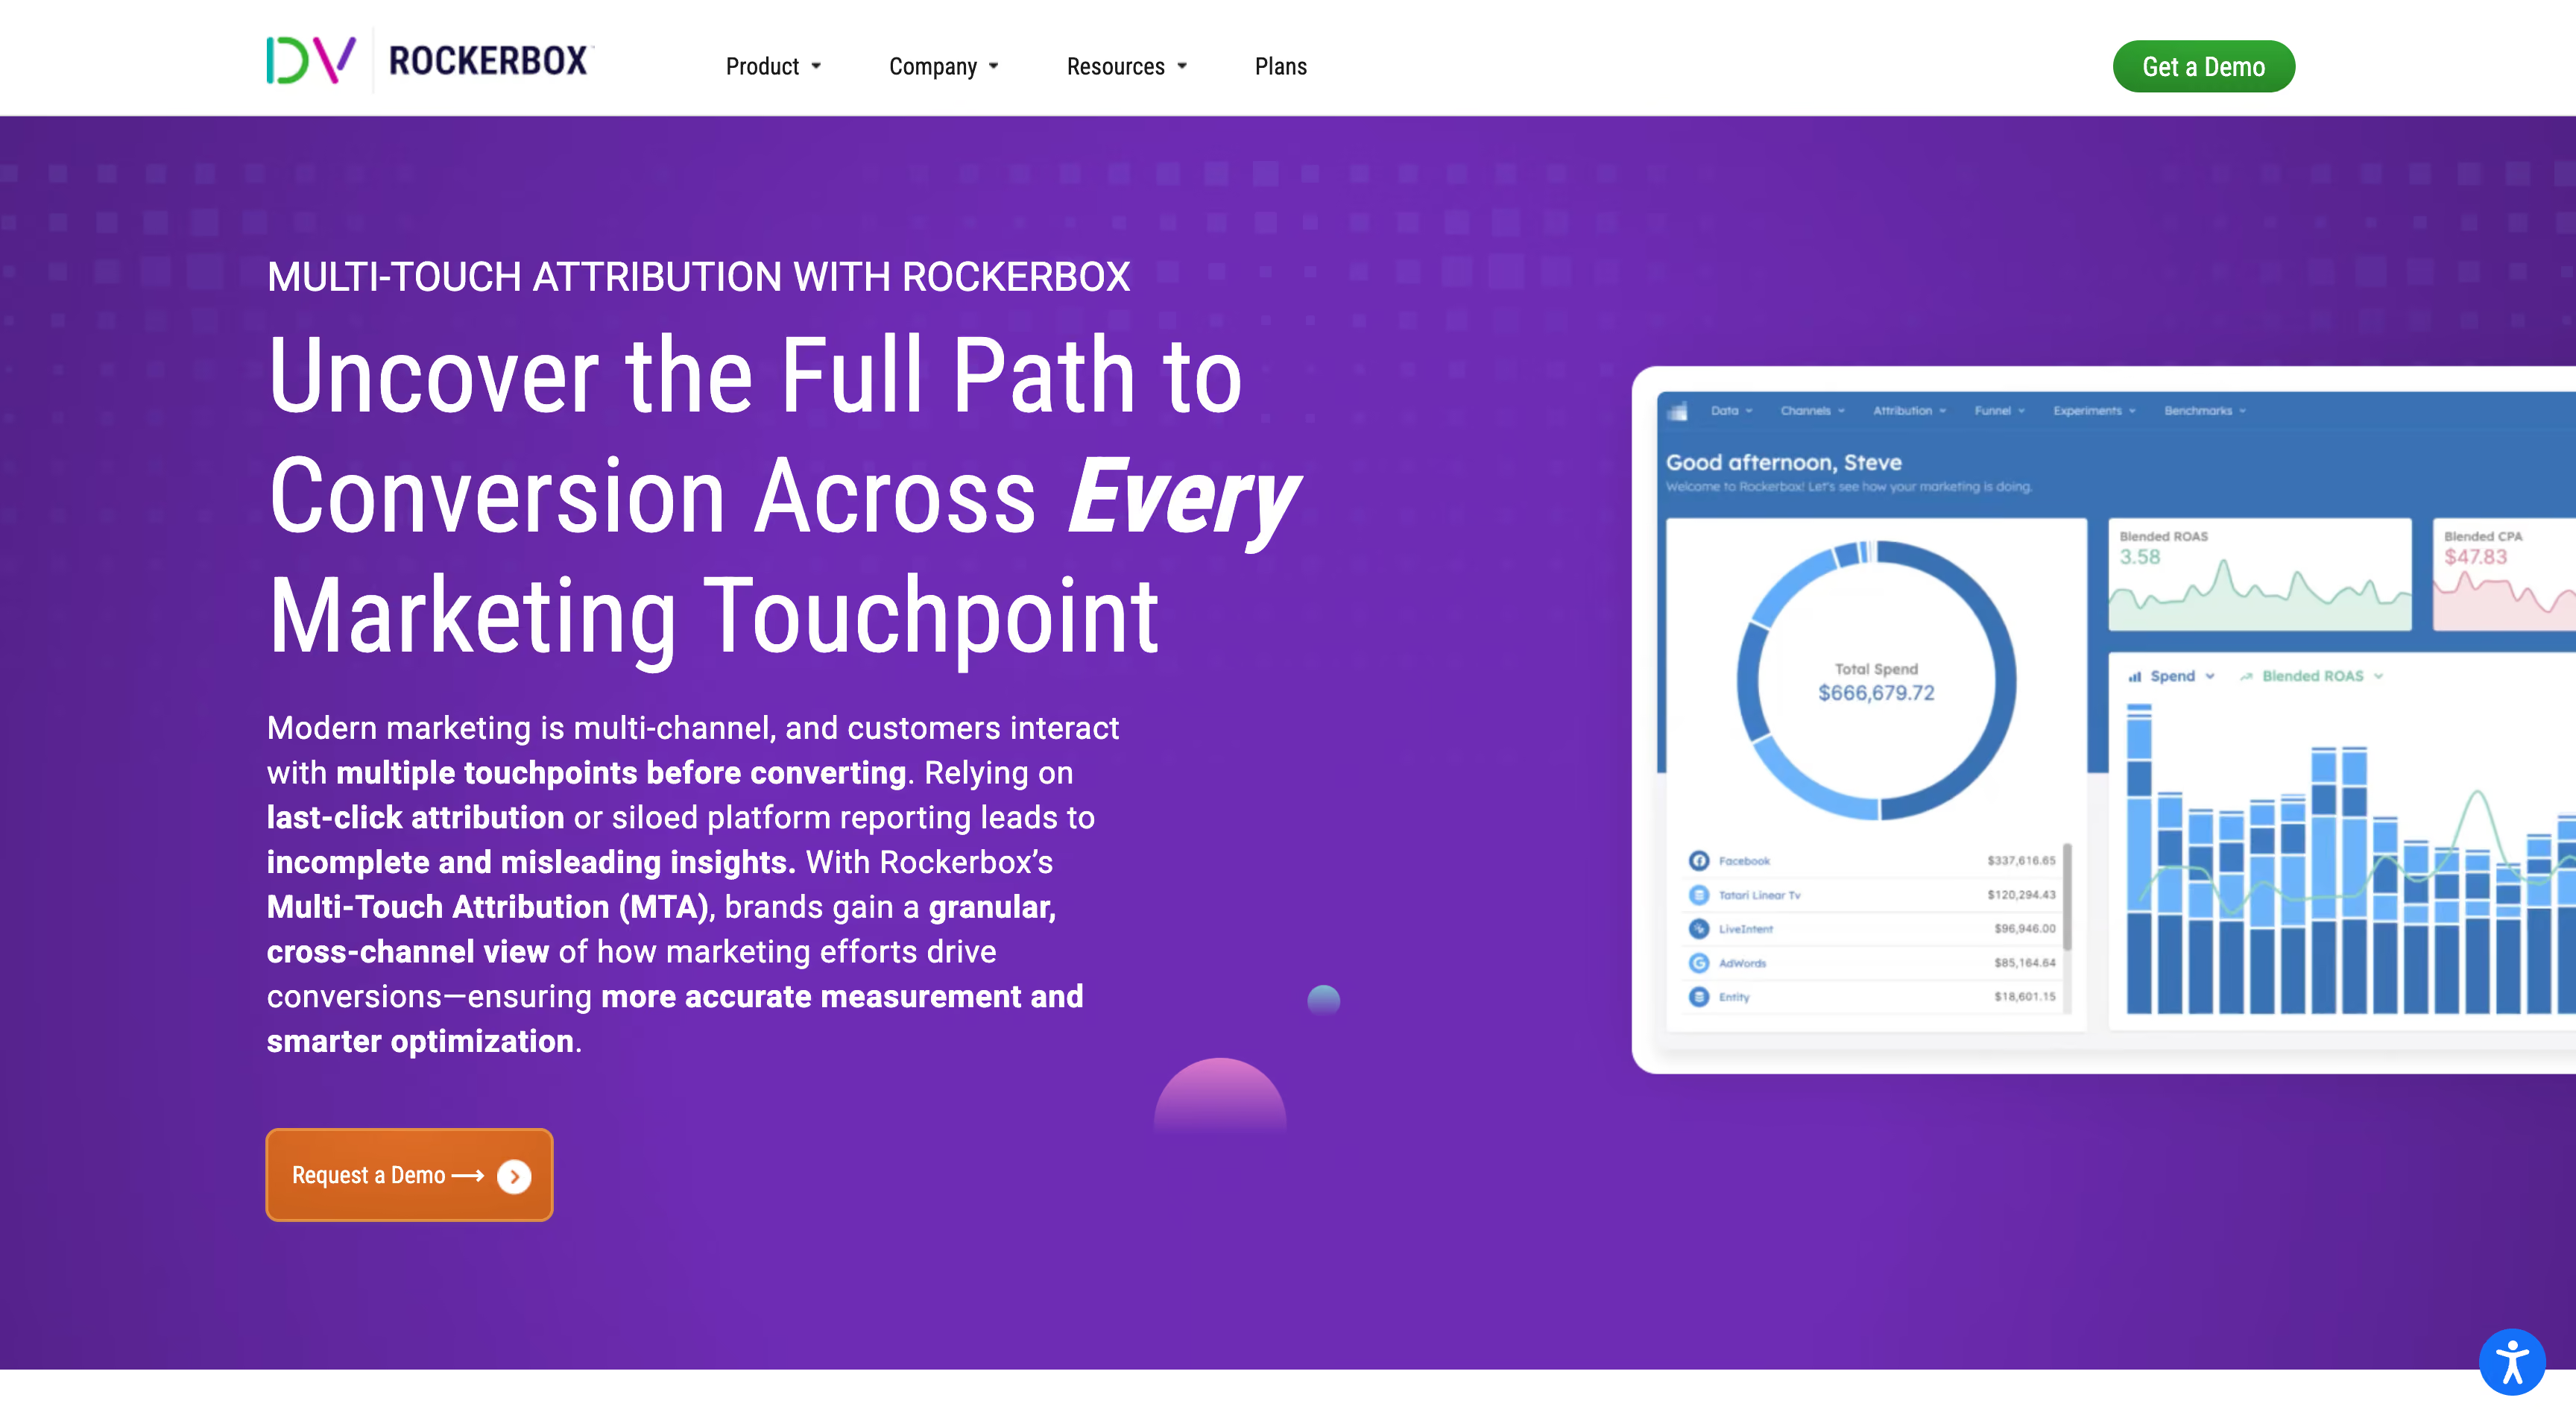
Rockerbox is thirteen years old, based in New York, and was acquired by DoubleVerify in February 2025. That history shows in the product. It was built for the measurement problem enterprises have, not the dashboard problem founders have, and its answer starts underneath the multi-touch attribution models: every channel tracked, every touchpoint tied to a user, every duplicate conversion stripped out before anyone argues about credit.
Nothing is published. The plans page splits the platform into data and analysis products and routes you to sales. Third-party listings put the entry point near $2,000 a month, while procurement data suggests brands spending $100K to $500K a month typically land between $40,000 and $90,000 a year. Annual contracts are standard, multi-year deals get discounted, and the cost scales with spend under management, channel count and data volume.
The public review base is thin, which is itself informative for a platform this established. What's there praises conversion-path visibility, the breadth of channels under one roof, and responsive support. Criticism repeats on three points: expensive for mid-market budgets, weak on view-based channels, and stretches where reporting carried bugs. Several reviewers note charges appearing for capabilities they expected to be included.
The strongest multi-touch attribution tool on this list if your media plan includes channels a pixel can't see and you have someone to interpret the modeling. It is also the furthest from a profit tool. You get a rigorous, well-reconciled revenue number, and everything about margin, returns and lifetime value happens somewhere else.
Best for: brands past $50K a month in ad spend whose paid social clearly works and never shows up in a last-click report.

Every other multi-touch attribution tool divides credit by position in a sequence: who was first, who was last, how the middle splits. SegmentStream asks a different question. What did the user actually do on that visit? A session where someone read two product pages, compared variants and checked shipping is treated as more influential than a bounce off a retargeting ad, regardless of which came last. Credit follows behaviour rather than order.
That mechanism explains the product's shape. It's aimed at brands whose paid social does real work early in the journey and gets nothing for it under last-click.
Three published plans. Online starts at $800 a month, for businesses where every conversion happens online. Full Funnel starts at $1,200 and adds CRM and warehouse conversions plus CRM funnel attribution for deals closing offline. Enterprise starts at $5,000 and is the only tier including automated budget allocation, server-side conversion tracking and incrementality testing, along with SSO, custom retention, an uptime SLA and a dedicated CSM. Pricing is per project rather than per seat, scaling with channels, data volume and motions instead of headcount. Online and Full Funnel are self-serve with quarterly or annual billing; Enterprise is annual only, with a paid three-month POC. Data residency in the US or EU is available on every plan.
A thin public base, uniformly positive where it exists. The recurring themes are per-channel clarity that platform reporting doesn't provide, campaign-level allocation guidance that shapes forecasting, and credit reaching upper-funnel social. The one repeated request is broader coverage: reviewers want every channel inside a single optimization portfolio.
Behavioural scoring is a genuinely different answer to the credit problem, and pairing it with saturation curves and weekly execution puts SegmentStream in the small group of multi-touch attribution platforms that measure and then act. Judged as a DTC tool it stops short in the same place as most of this list, optimizing revenue it can measure while margin, returns and lifetime value sit outside the system entirely.
Best for: B2B teams where six people touch a deal over nine months and the revenue lands in a CRM, not a cart.
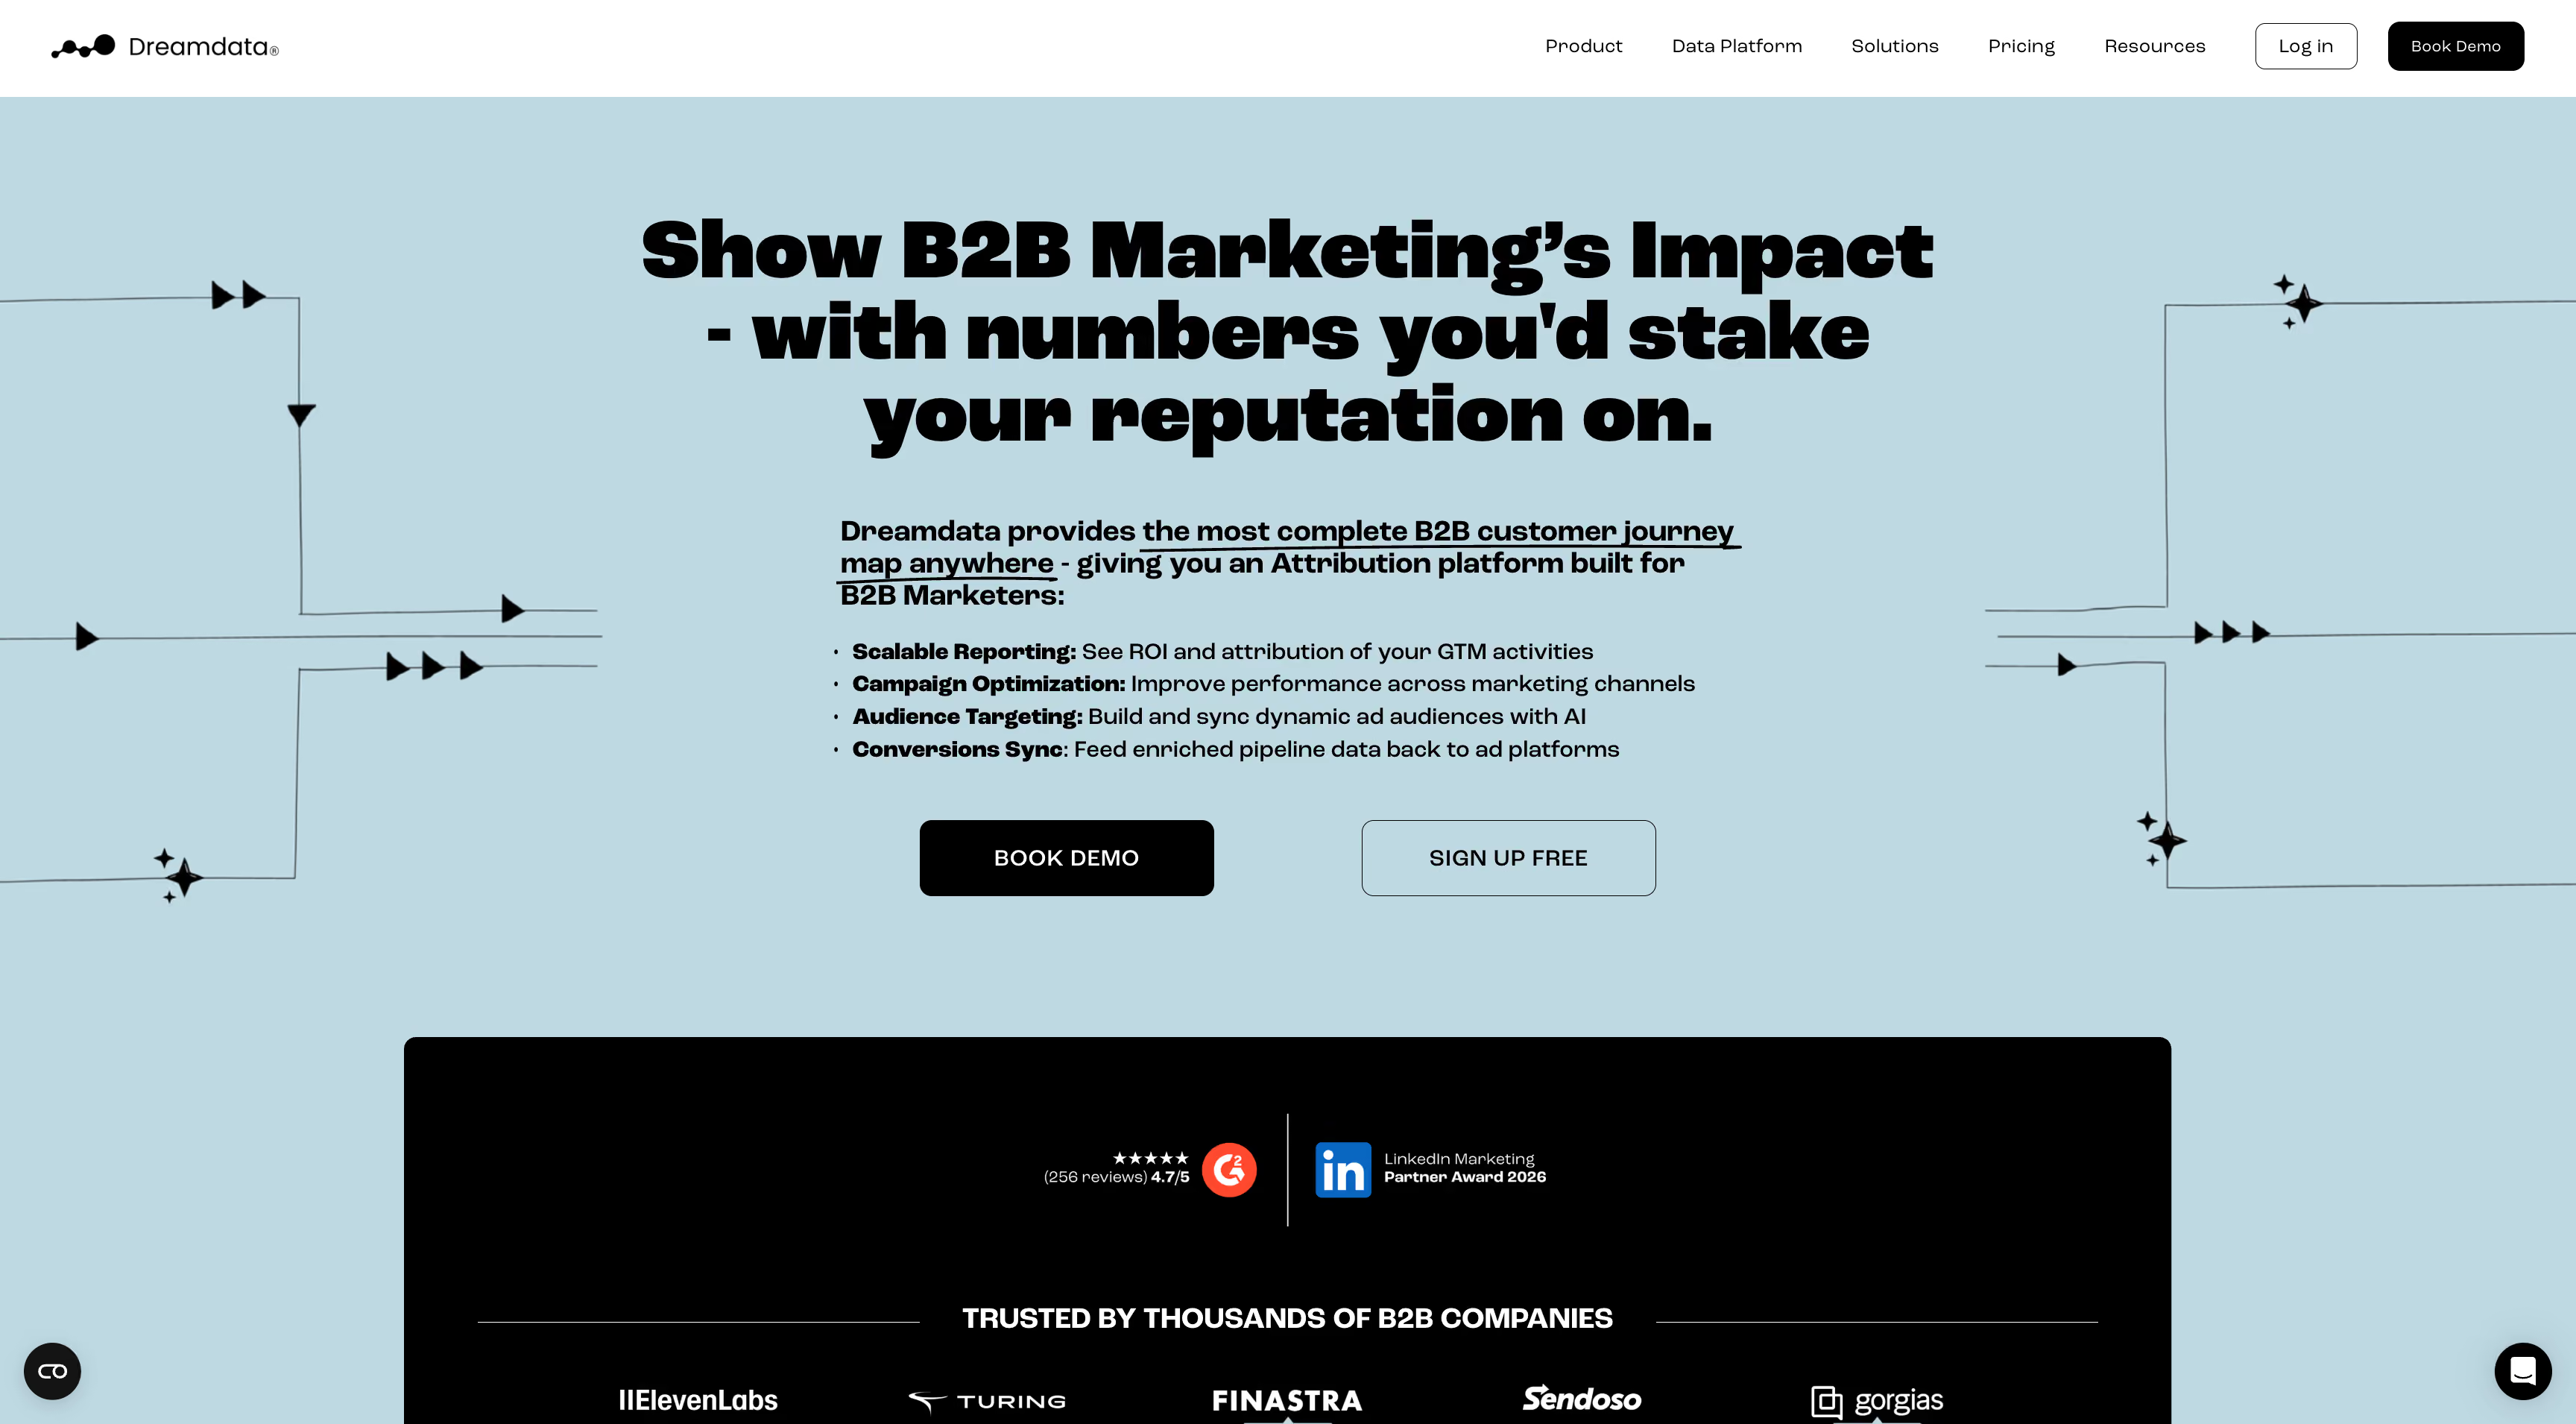
Dreamdata is on this list because it solves the multi-touch attribution problem better than almost anyone, for a completely different buyer. Its unit of analysis is the account, not the person. When an engineer reads a blog post in March, a procurement lead downloads a comparison in June, and a VP signs in October, Dreamdata treats that as one journey belonging to one company, including the anonymous sessions that happened before anyone filled in a form. Contact-level attribution splits the same story into three unrelated leads.
Two plans. The free plan gives you B2B web analytics, tracking with or without cookies, company identification, engagement scoring, the audience builder, Slack and Teams notifications and an ad spend report, capped at 5 seats, 2 months of history, 3 stage models, 2 notifications and 1 sync. Everything else lives in one custom-priced Activation & Attribution plan: AI-based and custom attribution models, revenue and content analytics, custom ROI reporting, full audience activation, advanced data controls and SSO, with a dedicated CSM, technical manager, solutions consulting and data science support included. Cost is driven by monthly tracked users. A guided free trial is available before committing.
4.7 across 245 reviews, and unusually specific about what's good. The account journey view comes up repeatedly as the thing that changed how teams report to their board. Onboarding and customization draw praise from reviewers who've used several attribution platforms. Criticism concentrates in three places: reporting depth, time to value, and the absence of a way to trial the paid product first.
The best B2B multi-touch attribution platform here, and the wrong purchase for anyone selling physical products. If your revenue closes in Salesforce or HubSpot after months of committee deliberation, this belongs on your shortlist. If it closes in Shopify in one session, everything Dreamdata is good at solves a problem you don't have, while the margin question you do have goes untouched.
Best for: B2B revenue teams who need one defensible number across marketing, sales and product usage, and want the buyer journey visible before anyone fills in a form.

HockeyStack leads with multi-touch attribution and has kept leading with it, even as the company layered Revenue Agents on top after a $50M round in April 2026. The proposition is a single account-level model: every interaction from the first anonymous visit through to closed-won and expansion, tracked without cookies, reconcilable line by line against your CRM.
Not published. Tiers are quoted after a demo on annual contracts, with attribution, Odin, scoring, enrichment and the Salesforce embed in the lower tier, and the custom agent builder, full agent suite and higher usage limits above it. Third-party procurement data puts entry around $2,200 a month; modules and hosting options move real contracts well beyond that.
Flexibility and analytics breadth dominate the praise, followed closely by support described as proactive — several reviewers revised their ratings upward after working with the team. The criticism is equally consistent: complex initial setup, sparse guidance through it, and a sense from some that positioning runs ahead of depth.
A serious B2B multi-touch attribution platform with an unusually clean privacy story and numbers you can defend in a board meeting, now carrying an agent layer on top. For a DTC brand it's simply the wrong shape — the journey it models is a committee deciding over months, and the margin question that decides whether your campaigns make money never enters it.
Best for: businesses where the sale involves a phone call, a form or a long consideration window, and revenue lands in a CRM rather than a checkout.

Ruler starts from a different premise every other MTA tool above it. Not every conversion is a click on a buy button. Someone researches for three weeks, then picks up the phone, and the deal gets marked won in Salesforce a month later with no trace back to the keyword that started it. Ruler's whole design closes that gap: track the anonymous visitor across sessions, identify them when they convert through a form, call or live chat, then pull the revenue back out of the CRM and attribute it to the channels that earned it.
The company is based in Liverpool, and it publishes its pricing, which sets it apart from most multi-touch attribution vendors.
Published and tiered by monthly website traffic, in pounds, euros or dollars. Small covers up to 10,000 visits from $400 a month, Medium up to 50,000 from $668, Large up to 100,000 from $1,326, and Advanced starts at $2,000 for anything above that. Annual billing takes 10% off, agency rates exist, and every tier includes phone, email and chat support, a dedicated CS manager and white-glove onboarding. Data-driven and impression attribution arrive at Medium; marketing mix modelling and the AI agent only at Advanced. Ruler describes the figures as indicative, scaling with traffic, product and integration requirements.
4.6 on G2 across 30 reviews, mostly mid-market. The two standout scores are dynamic number insertion at 9.4 and quality of support at 9.4, which matches what the product is built around. Reviewers describe it as the tool that finally connected marketing spend to closed business rather than web conversions, and several who compared it against heavier platforms chose it for landing between capability and implementation burden. The review base is small, so treat the average as directional.
The right answer for a business whose customers phone before they buy, and a mismatch for one whose customers check out in ninety seconds. Ruler proves which channels produce revenue, at a price mid-market teams can actually sign, which is rare among multi-touch attribution software. What it never tells you is whether that revenue was profitable, and for a DTC brand that's the half of the question that decides where next month's budget goes.
Best for: Shopify brands that want attribution, margin and BI in one subscription, and want the underlying data in a warehouse they can query themselves.
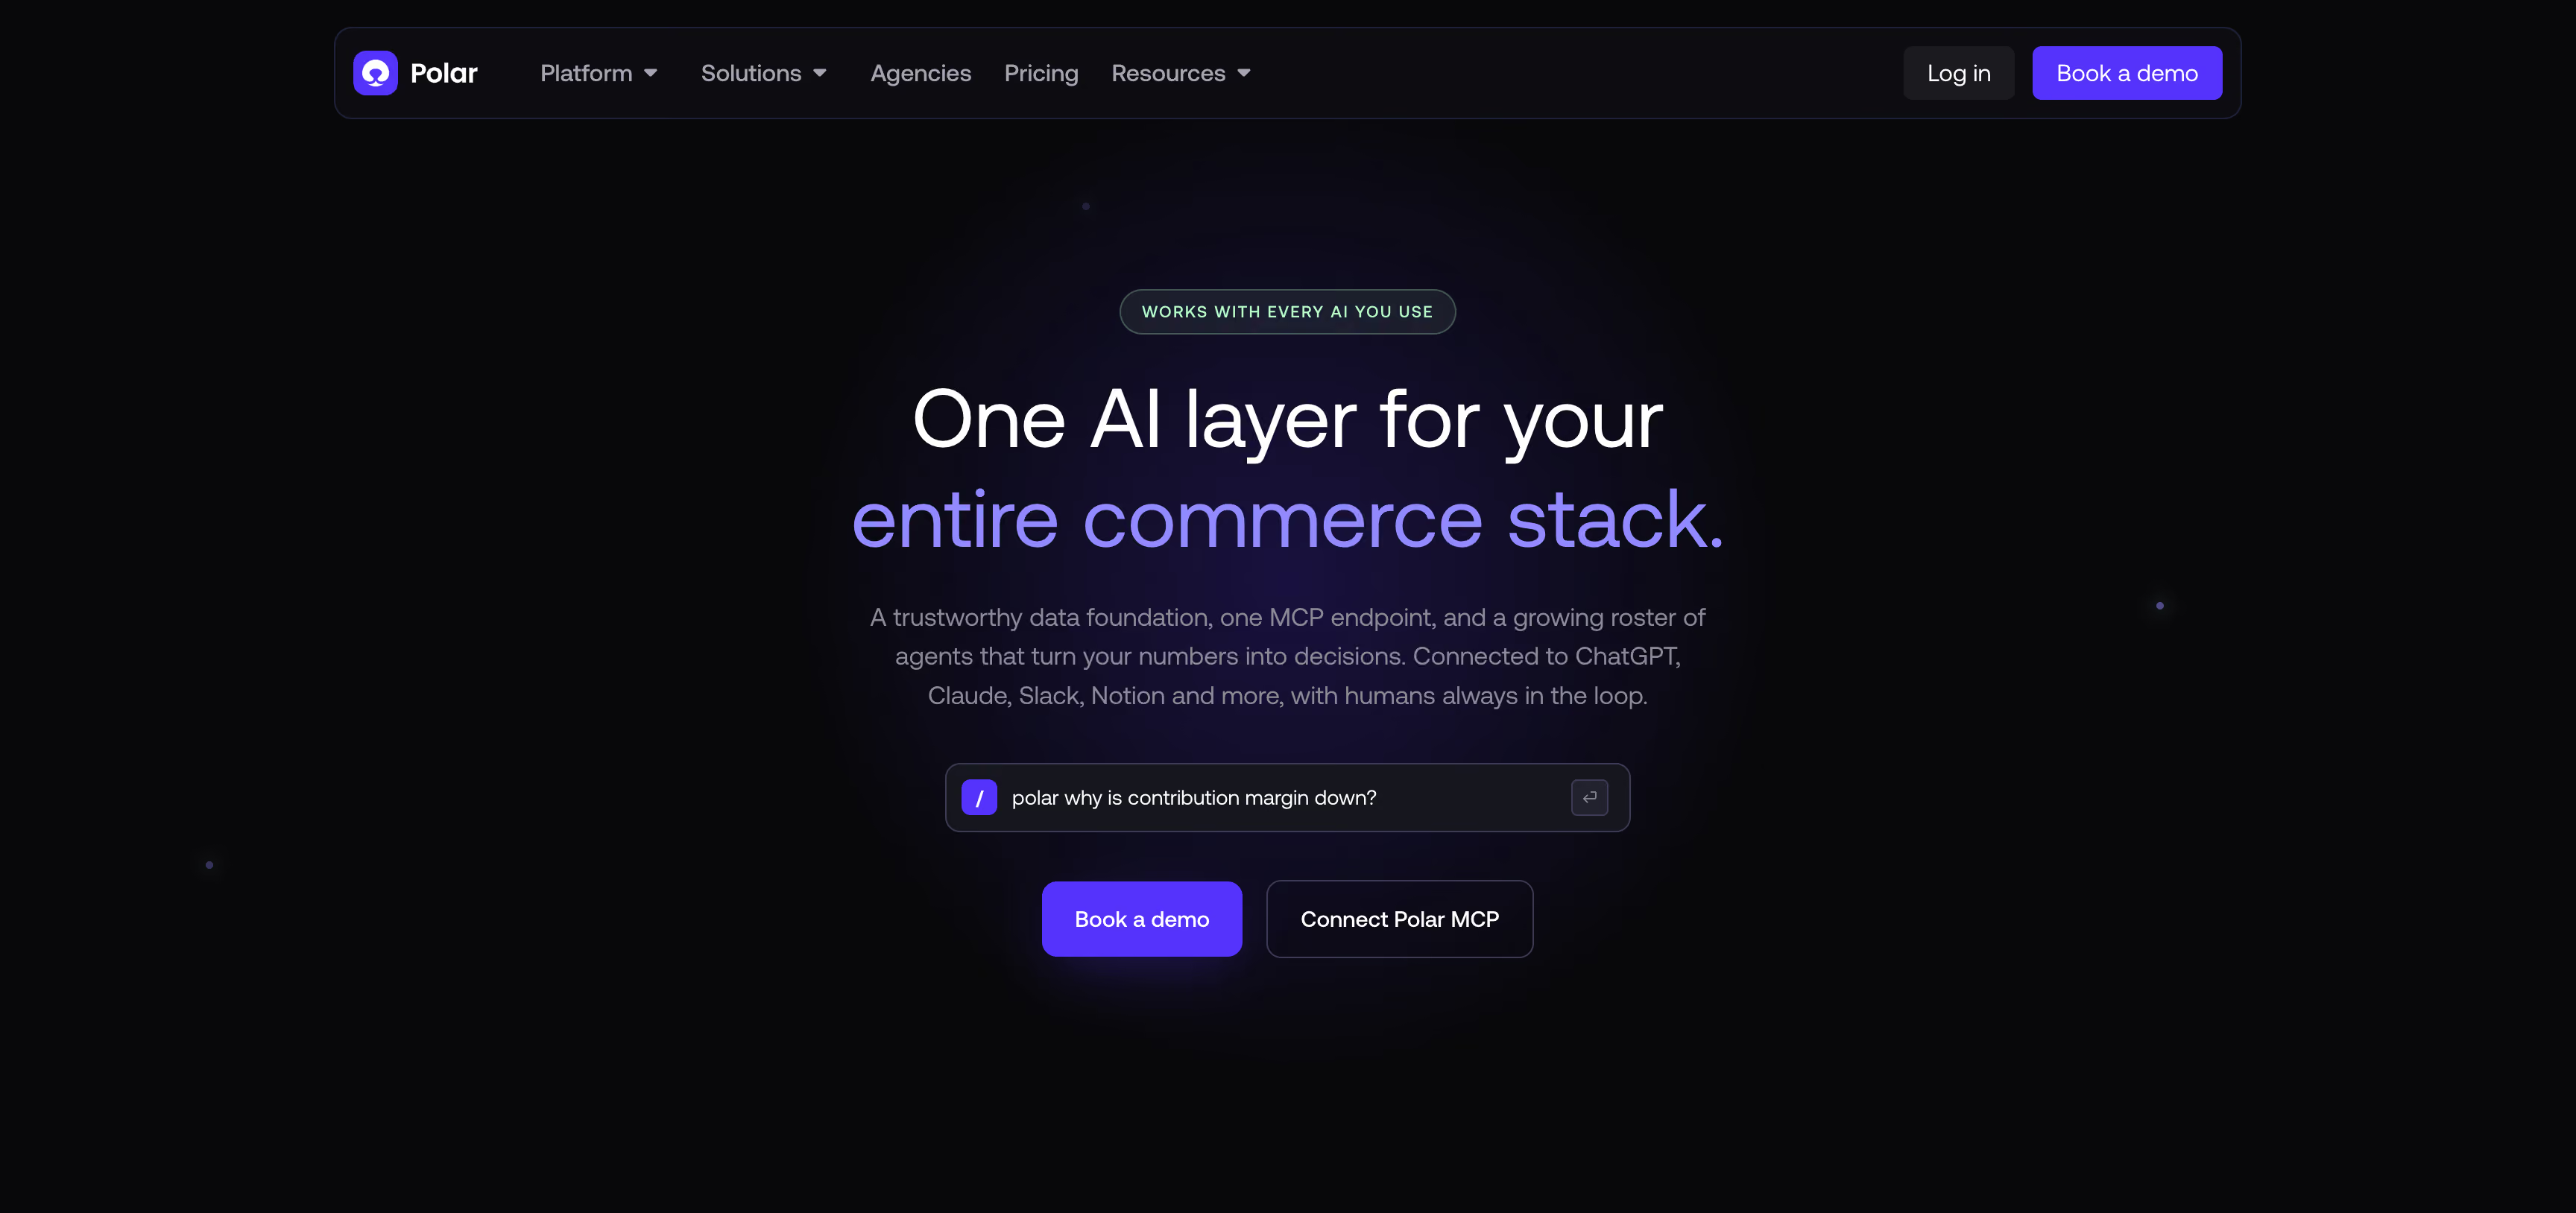
Most multi-touch attribution tools on this list hand you a number and keep the data. Polar hands you the database. Every plan ships a dedicated Snowflake instance with your name on it, a semantic layer of 400+ prebuilt ecommerce metrics sitting on top, and SQL access available if you want to go underneath the dashboards entirely.
Not published as a list. The pricing page gates figures behind an annual GMV selector and routes you to a demo, with a Core plan bundling the products at a discount and a Custom plan letting you pick them individually. G2 lists entry at $300 a month across three plans, and third-party reporting puts base analytics near $300–350, roughly $400 once the pixel, CAPI enhancer and Klaviyo enricher are added, and an Enterprise quote above $20M in annual GMV. Cost scales with monthly tracked orders rather than seats. Every plan includes the Snowflake database, the first-party pixel, unlimited users, unlimited history and a dedicated success manager. Free trial available, no free plan.
Reviewers describe replacing a stack of Sheets, Looker Studio connectors and freelance data work with one platform, and consolidation plus speed of setup dominate the praise. Complaints are specific and consistent: refresh latency, custom connectors that need a support specialist, the missing Amazon Ads connection, and cost relative to store size at the smaller end.
The rare multi-touch attribution tool here where attribution and contribution margin report from the same tables without a six-figure commitment. The gap is the aggregate layer. With no mix model, every channel a click can't observe gets proven one paid test at a time, and the signal loop closes on two platforms behind an add-on — so the measurement is excellent and the machinery for acting on it is thinner than the price of admission suggests.
Best for: every brand that wants a free, vendor-neutral read on click-driven conversions, and has the SQL or the patience to work around what the interface won't do.

Every multi-touch tool on this list gets compared against GA4 at some point, usually as the exhibit for why you need something else. The honest problem isn't the modeling. It's that GA4 sees clicks in a browser, reports revenue, and stops there.
Free for standard properties, with no seat limits and no spend thresholds. Analytics 360 is quoted through Google Cloud sales, reported to start near $50,000 a year, and buys retention up to 50 months, BigQuery exports in the billions of events per day, intraday data freshness, a 99.9% SLA, subproperties and dedicated support. BigQuery storage and query costs sit outside both tiers and run modestly at typical ecommerce volumes.
4.5 on G2 across more than 6,500 reviews, which measures ubiquity more than fitness — GA4 is installed almost everywhere, so the rating reflects a population with no alternative rather than a chosen one. Praise concentrates on cost, the depth available once you learn it, and how cleanly it connects to the rest of Google's stack. Criticism is remarkably consistent: an interface that hides what you need, a learning curve steeper than the old Universal Analytics, and reporting that never reconciles with what the ad platforms claim.
Keep it installed. It's a free, neutral count that's useful precisely because nobody is selling you anything with it, and BigQuery export means the raw data is always yours. What it can't be is your multi-touch attribution system.
Multi-touch attribution (MTA) divides credit for a single conversion across every touchpoint that contributed to it, instead of handing all of it to one interaction.
A shopper sees a TikTok ad on Tuesday, reads a review on Thursday, clicks a branded search ad ten days later and buys. Last-click gives Google the full order value and TikTok nothing. Multi-touch marketing attribution splits that order across all three, and how it splits is what you're buying.
Every platform in this comparison does the splitting. What separates them is the data the split runs on. A model that allocates credit flawlessly across a dataset missing 30% of its conversions returns a confident wrong answer, which is why the ranking below weighs collection and identity resolution as heavily as model count.
Single-touch models award one interaction 100% of the credit. First-click pays discovery, last-click pays the closer, and both are wrong in a direction you can anticipate.
Last-click overpays branded search and retargeting — the channels that harvest demand something else created. First-click overpays whatever the customer happened to see first, including a display impression they scrolled past. Run one month through both and you get two different budget plans from identical data.
That gap is the case for multi-touch attribution vs single-touch. Last touch tells you where the purchase finished. Multi-touch attribution tells you what it cost to get there.
Rule-based multi-touch attribution models split credit by position, using a formula you pick before you see the results. Linear divides evenly across touchpoints. Time-decay weights recent interactions heavier. U-shaped loads the first and last touch; W-shaped adds a milestone in the middle.
Their virtue is auditability. When a channel owner disputes a number, the rule is right there and the argument is short. Their flaw is that the weights come from convention rather than from your customers — nothing in a 40/20/40 split was derived from how anyone actually buys from you.
Data-driven multi-touch attribution models learn the weights instead of accepting them, comparing converting paths against non-converting ones to estimate how much each interaction moved purchase probability.
Behavioral scoring asks a different question: what happened inside the visit? A session with three product pages, a size chart and a shipping check gets scored above a two-second bounce off a retargeting ad, regardless of where either sat in the order.
The trade is auditability. A position rule is arguable because it's visible. A behavioral score is harder to challenge, and harder to defend.
Vendors use the three interchangeably. They describe different things, and the difference decides whether the numbers hold.
Multi-channel means the tool reports on more than one channel. Cross-channel means it resolves one person across those channels and devices, then strips the duplicate conversions three platforms are each claiming. Multi-touch attribution is what happens after that: how credit gets divided once the journey is assembled correctly.
The order matters. Multi-touch conversion tracking systems that can't link a mobile session to a desktop purchase record one journey as two, and every model downstream inherits the error. Most cross channel attribution tools sell on connector count; the best multi-channel attribution software is the one that can tell you its identity match rate without checking.
Two brands can run identical budgets and need opposite models. One sells a $40 candle bought in a single session on a phone. The other sells a $2,400 mattress researched across six weeks and three devices. The right model follows the shape of the journey, not the size of the ad account.
Pick one, then check it. The multi-touch attribution solutions in this comparison differ less in which models they ship than in whether you can define your own and compare two side by side — any multi-touch attribution platform worth its price lets you do that without a support ticket. Run last-click and your chosen model over the same month. If a channel takes 55% of the credit in one and 15% in the other, the thing to fix is the identity resolution underneath, not the model on top.
Your Meta prospecting campaign reports a 1.2x ROAS in every multi-touch attribution view you own. You pause it for three weeks and total revenue falls 9%. Nothing was broken. The model measured the journeys it could follow, and the campaign's real work happened in journeys it couldn't.
That's the split in one line. Multi-touch attribution measures the paths it can observe; marketing mix modeling measures the outcome it can't explain.
MMM ignores individual users entirely. It regresses spend, seasonality, promotions and outside factors against total revenue over time, then estimates how much each channel contributed to the whole. No cookies, no click IDs, no consent to lose. Which is exactly why it reaches TV, podcasts, marketplaces, retail and every impression nobody clicked — the spend MTA values at roughly zero.
The trade-offs run in both directions:
Run both and they will disagree. Treat the disagreement as the finding. When multi-touch attribution says paid social returned 1.8x and the mix model says 3.1x, the gap is approximately the view-through and cross-device credit your tracking is losing — which also tells you how much to discount every MTA figure you put in front of the board.
One practical warning for buyers: mix modeling is almost always the most expensive thing in the box. Northbeam gates MMM+ behind Enterprise and roughly $500K a month in spend. Triple Whale sells Compass as an add-on below its top tier. Ruler reserves mix modeling and its scenario planner for the Advanced plan. Admetrics puts PRISMA and the Budget Allocator on Premium. Polar has no mix model at all and proves incremental channels one paid test at a time. If MMM is the reason you're shopping, price the tier that includes it rather than the number on the pricing page.
A rough test for whether you need it yet: if more than a fifth of your budget goes somewhere a pixel can't follow, MTA alone is measuring the wrong four-fifths.
Meta says the campaign returned 3.4x. It sold your lowest-margin SKU, 22% of it came back, and the payment fees and pick-and-pack came out of a number nobody in the platform ever saw. On paper it's your best campaign. In the bank it lost money.
Almost every tool in this comparison stops at revenue. Seven of the ten have no profit layer at all — Northbeam, Rockerbox, SegmentStream, Dreamdata, HockeyStack, Ruler and GA4 all resolve to conversions and ROAS. Triple Whale reaches gross margin and stops before returns. Polar and Admetrics carry contribution margin down to the campaign and the SKU.
Ranking channels by revenue and ranking them by contribution margin produce different orders, and the difference decides where next month's budget goes. That's the criterion this comparison weighs most heavily, and it's why the best software for tracking multi-touch ROI is rarely the one with the most attribution models.
Two things to check on any demo: does product cost, shipping, fees and returns reach the campaign report, or only a blended P&L view? And are refunds traced back to the campaign that produced them, or netted off at the account level a month later?
Most of these platforms will show you a defensible number. The question is which one answers the question you're actually stuck on.
Work through five, in order:
Then price it properly. The best attribution software on this list is often not the one with the lowest entry number — the capability you're shopping for tends to sit two tiers above it. Ask what the quote includes at your spend level, not what the pricing page starts at.
One test worth running in every demo: hand them a week you already know cold, and see whether their numbers reconcile with your Shopify orders and your bank. Multi-touch attribution vendors are good at explaining discrepancies. The ones worth buying have fewer to explain.
Admetrics takes it, on the criterion that decides budgets. Conversions are collected server-side, nine models split the credit, product cost and returns come out per SKU, and PRISMA plus the Budget Allocator turn that into a spend split you can execute. Published pricing from $399 a month, and EU hosting if your DPO has opinions.
