
Synthetic focus panels - Get feedback before you launch Get free feedback

10 Best Ecommerce Analytics Tools 2026

The platforms ecommerce and DTC teams actually trust with a budget, tracking, profit, and action compared across 10 tools.
Silvana Chirita
|
Updated August 11, 2026
|
20 min read
Comparison of the 10 best ecommerce analytics tools for 2026, ranked on tracking accuracy, profit visibility and budget action

Your top seller isn't always your best seller

Your top seller this month moved 3,000 units. Marketing calls it a win. Finance calls it the reason November's margin missed budget, because the SKU everyone's chasing carries a 22% return rate and ships in a box that costs more than the discount code that sold it.

That's the gap most ecommerce analytics tools never close. They'll tell you what sold, who bought it, and which channel gets the credit for it. Fewer will tell you what any of that actually cost. And a tool that stops at revenue keeps a business scaling the wrong products with real conviction.

Ten ecommerce analytics tools sit under review here, side by side on tracking accuracy, data coverage, profit visibility, and whether they turn any of it into an actual decision.

Key Takeaways

Admetrics ranks first among ecommerce analytics tools for 2026, ahead of Northbeam, Triple Whale, Lifetimely, Daasity, Peel Insights, Glew, GA4, Adobe Analytics and Mixpanel, because it's the only platform combining server-side tracking, real attribution, profit math and budget execution in one place.
Browser pixels are losing the count. GA4, Mixpanel, and most attribution dashboards still read the browser directly, and cookie loss routinely costs them a fifth to a third of real conversions.
Revenue isn't profit. ROAS rewards the SKU that sells, not the one that pays; few tools here work shipping, fees, product cost, and returns back out before calling a channel a winner.
Attribution and customer analytics answer different questions; Lifetimely and Peel Insights track what a buyer is worth over time, not which channel put them in front of you.
Most platforms stop at reporting. Admetrics converts a finding into an actual spend change instead of leaving that translation to whoever's watching the dashboard.

Quick comparison: best ecommerce analytics tools 2026

#
Platform
Best For
Tracking & Attribution
P&L CONTROL
1
Admetrics
Full-stack ecommerce & DTC

S2S + 9 MTA models, custom

POAS to SKU level
2
Northbeam
Enterprise paid media
Browser pixel + ML MTA
None
3
Triple Whale
Shopify-native DTC
Triple Pixel + Sonar S2S
Gross margin only
4
Lifetimely
LTV & cohort tracking
No MTA, Shopify order data
Full P&L, COGS to refunds
5
Daasity
Omnichannel data warehouse
No native attribution
Fully-loaded CM
6
Peel Insights
Retention on Shopify & Amazon
Shopify referrer/UTM only
None
7
Glew
Multichannel BI/ETL
None
None native
8
GA4
Free universal baseline
Client-side, 4 DDA models
None
9
Adobe Analytics
Enterprise behavioral analytics
Client-side, multi-touch
None
10
Mixpanel
On-site product behavior
No marketing attribution
None

What are ecommerce analytics tools?

An ecommerce analytics platform is software that pulls store, ad and customer data into one place and reports on what the business actually did — orders, traffic, channel performance, and on some platforms, what was left after costs.

Search analytics software for ecommerce or analytics tools for ecommerce, and two different kinds of product come back under the same label; confusing them is how brands end up paying for the wrong one. Some platforms watch a shopper move through a site, product views, cart adds, checkout steps, and report on that behavior. Others watch the money: which channel drove the sale, and what it actually earned once costs come out.

GA4 and Mixpanel sit in the first camp; ask either one which ad caused a purchase and the answer is thin. Northbeam, Triple Whale and Admetrics sit in the second, attribution and profit are the job, and on-site behavior is someone else's dashboard. Most vendors in the ecommerce analytics space build for one camp, not both, and both camps sell under the same ecommerce analytics software label — so checking which lane a tool actually plays in matters more than reading its feature list.

Why tracking accuracy decides everything downstream

Every number downstream depends on what actually got recorded at the moment of sale. Browser-based tracking runs into trouble at every step: Safari limits cookies to a single day, most iOS users decline tracking when asked, ad-blocking extensions strip the script before it ever loads, and consent banners hold back whatever's left. Third-party cookies are disappearing on top of all that, and each one of these is a sale your pixel would have caught a year ago and now simply doesn't.

Server-side capture skips the browser entirely. The order confirms on your own backend, and that confirmation is what travels to the ad platform, not a client-side tag hoping the tab stays open long enough to fire. What comes out the other end is a fuller, first-party record instead of whatever slice of shoppers let the script run, and it's the difference analytics ecommerce tracking has to get right before any attribution model on top of it means anything.

Ecommerce performance analytics: revenue metrics vs. what you actually keep

Ecommerce performance analytics that stops at ROAS misses the point: two channels can post identical ROAS and fund completely different businesses. Paid social pushes a SKU that comes back constantly and ships in oversized packaging; email pushes a SKU that almost never gets returned. Same revenue divided by the same spend, very different amount of cash actually left over at the end, and ROAS alone can't tell the two apart.

POAS is the correction, working shipping, payment fees, product cost and returns back out of the equation before anything gets ranked. Carry that math down to SKU level and the leaderboard moves; the channel with the biggest ROAS number on the dashboard isn't always the one actually funding the business.

Ecommerce customer analytics: what a buyer is worth, and what happens next

Ecommerce customer analytics answers a different question than attribution does: not which channel brought someone in, but what they're worth once they're a customer, and whether they'll buy again. Cohort tools split buyers by acquisition date, first product or channel, then track how each group's spending holds up over the following months, the number that actually predicts payback rather than just first-order margin.

Predictive analytics in ecommerce sits on top of that layer. Ecommerce predictive analytics forecasts 3-, 6-, and 12-month LTV, churn risk, and repurchase likelihood from patterns in past cohorts, so a brand can act on a customer's likely value before a second order proves it, rather than waiting for the data to arrive on its own.

How we tested and scored each tool

We ranked each of these ecommerce analytics tools against the four criteria that actually decide the outcome — not feature counts or how loud the marketing is. Four criteria, weighted in order:

  • Tracking and attribution accuracy — does the signal come from a browser pixel or genuine server-side capture, and are the attribution models real or a label on the pricing page?
  • Data foundation — how many channels, stores and platforms actually feed the numbers?
  • Profit tracking — do COGS, fees and returns net out before anything gets ranked, or does it stop at revenue?
  • Action — does a finding change a budget, or just sit there looking correct?

Rankings come from using each product directly, reading its documentation, and cross-checking that against what verified users report on G2 and the Shopify App Store. When a vendor's claims and its shipped product told two different stories, the shipped product won.

1.

Admetrics

4.97

Best for: DTC and ecommerce operators who'd rather run tracking, attribution, profit and spend decisions through a single system than reconcile a pixel, a BI dashboard and a spreadsheet every week.

Admetrics dashboard, a server-side tracking and profit attribution platform for e-commerce brands

Two hundred conversions on Meta, 140 orders in Shopify, a Monday meeting arguing about whose number is real. Admetrics handles the entire sequence itself: server-side capture, credit split across nine models, SKU-level profit, a mix model catching what attribution can't, and the resulting change pushed straight into ad accounts. Most ecommerce analytics tools in this list own one link of that chain and hand you the rest.

Key features

  • First-party server-side tracking. Captures 20-30% more conversions than a browser pixel, then routes that enriched signal into Meta, Google, TikTok, Outbrain, Taboola and Snapchat so each platform bids against real buyers instead of a partial sample.
  • Nine attribution models, plus a custom builder. The standard set ships out of the box, plus a custom builder for when none of the nine fit how a journey actually works.
  • SKU-level profit. POAS subtracts product cost, shipping, fees and returns before a channel earns the "winner" label, refreshed through the day rather than at month-end.
  • PRISM4 mix modeling. Machine learning estimates offline and upper-funnel contribution and pinpoints where each channel starts to saturate, not a static rule reassigning direct traffic.
  • Budget Allocator. Turns what attribution and PRISM4 surface into specific cross-platform moves, closing the gap between an insight and a spreadsheet someone has to build.
  • Ava, plus a native MCP server. A conversational analyst for profit questions, plus a connection point where agent tools like Claude or ChatGPT can pull the data and act on it.

Strengths

  • Everything shares one dataset. Tracking, attribution, profit BI, mix modeling, and budget execution typically arrive as three or four separate subscriptions; here they're one product.
  • The signal loop closes. Recovered conversions push back into the bidding engines directly, the mechanism behind the 10-20% lifts brands see once that loop closes.
  • Credit splits by lifecycle stage. Acquisition, retention, and reactivation are credited separately, so retargeting can't quietly claim a sale a cold ad already earned.
  • German-hosted and GDPR-compliant by default. Cookieless out of the box, worth noting for any brand selling into the EU.

Limitations

  • Built for one data model. Shopify, WooCommerce, and comparable platforms are home turf; a B2B seller on a nine-month sales cycle is better served elsewhere.
  • The agentic layer is young. Ava and the agent connection point launched relatively recently, so the autonomous side of the product is still filling out rather than fully mature.
  • Pricing scales with ad spend. Cost is tied to spend volume, not headcount, so a brand budgeting for growth needs to model a rising percentage rather than pencil in one flat line.

Pricing

Growth opens at $399/month and covers up to $20,000 in monthly ad spend, then adds 1.5% on anything above that line. Business runs $899/month up to $70,000, with a 1% rate past it. Beyond $100K a month, the quote becomes custom. A 14-21 day trial comes standard, and no card is required to start it.

Reviews

G2 scores it 4.97 out of 5, and two themes recur: the numbers hold up, and support keeps showing up after launch. Ehrenkind logged a 60% lift in ROAS; Nyfter came away tracking three times the data volume it could trust.

Bottom line: most tools here handle one link in the chain well and stay quiet about the rest. Admetrics captures the signal at the source, carries it through to an actual profit figure, and moves the budget on its own rather than handing that last step to whoever's watching the dashboard.

2.

Northbeam

4.5

Best for: brands running six-figure monthly media budgets that need one first-party number to make daily allocation calls against, instead of trusting whatever each ad platform reports about itself.
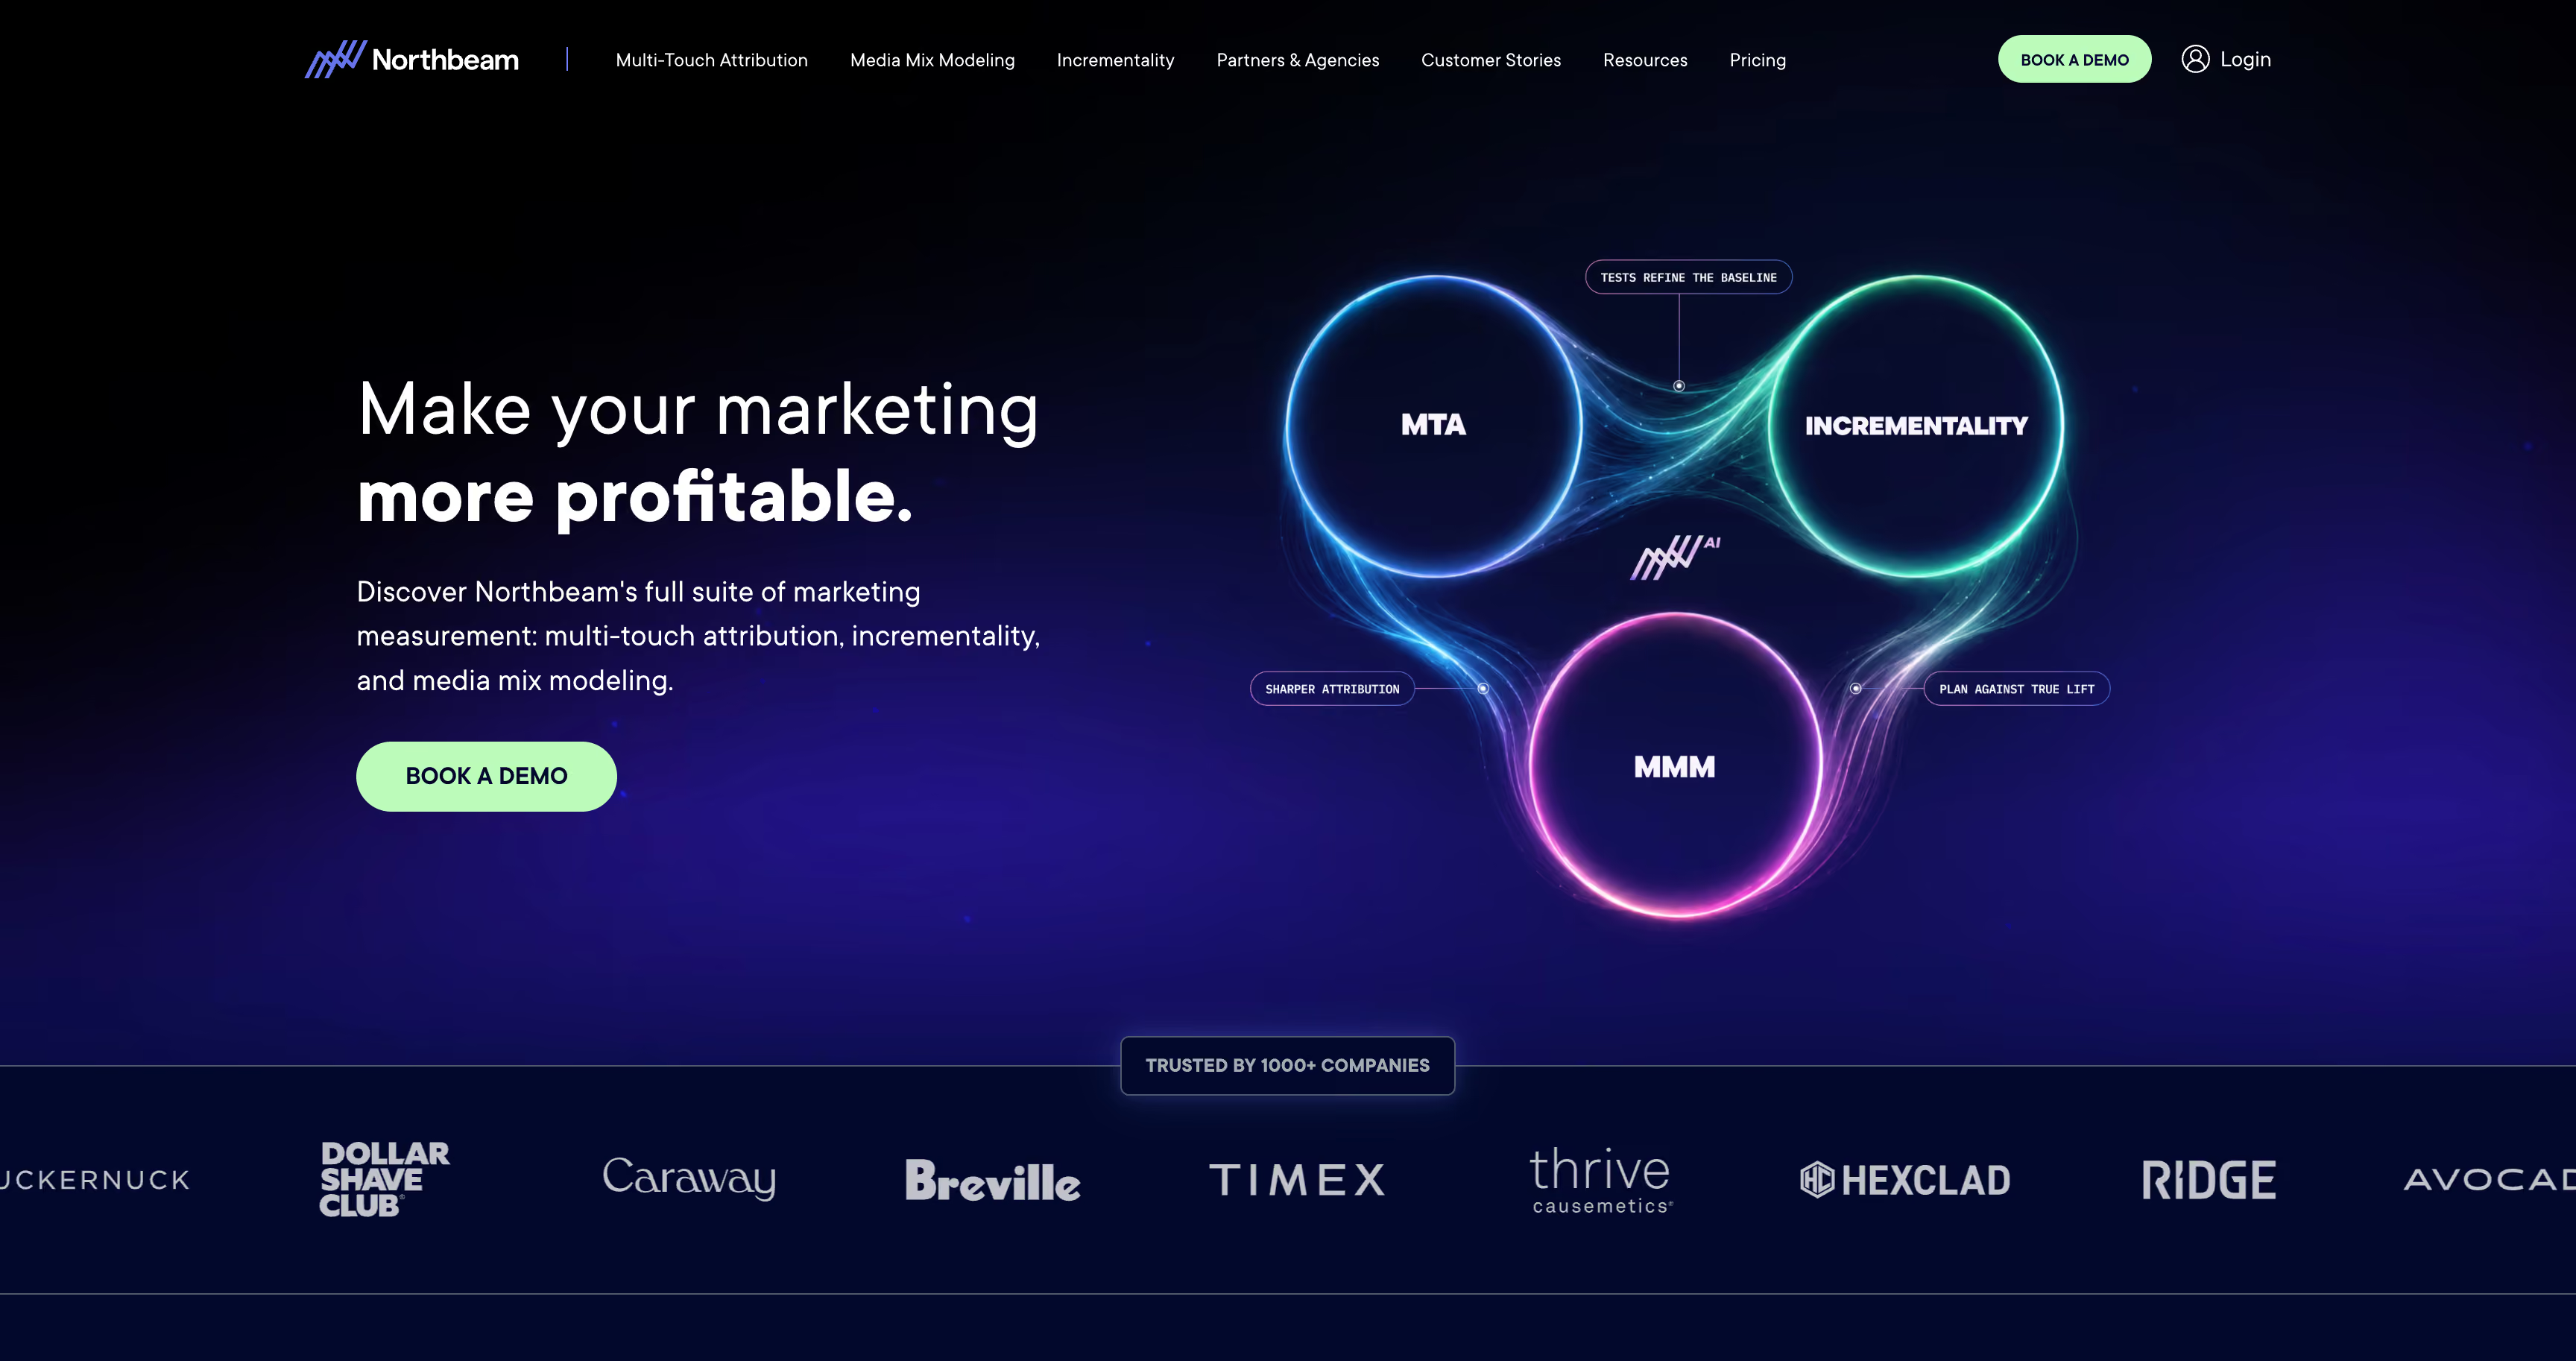
Northbeam website homepage, a marketing intelligence and media mix modeling platform for large e-commerce paid media teams

Northbeam is built specifically for larger ecommerce operations, mapping the buyer's path across Meta, Google, TikTok and CTV using first-party data instead of platform-reported numbers. Its view-through model, Clicks + Deterministic Views, credits verified impressions alongside clicks. Brands typically arrive once last-click stops holding up and a five-point misallocation would cost more than the subscription.

Key features

  • Machine-learning attribution. Credit weights by measured impact on conversion rather than touchpoint position, with several models to compare and no lookback cap.
  • Clicks + Deterministic Views. Built with Meta, TikTok, Snapchat and Pinterest, this layer counts verified impressions and in-app views alongside clicks.
  • Northbeam Apex. Routes attribution data back into Meta's delivery algorithm, though the enrichment loop reaches Meta only.
  • MMM+. A media mix model sitting on top of the attribution data for saturation and incrementality reads, available as an add-on from Professional up.
  • Creative Analytics. Thumbstop and hook-rate metrics at the ad level, gated to Professional and above.

Strengths

  • Attribution accuracy is the standout. Reviewers name trust in the number itself most consistently, used daily for budget calls instead of what Meta or Google's own dashboard shows.
  • The ML model reads deep. Multiple accounts describe the output as more accurate than other attribution platforms they've compared it against.
  • It functions as a source of truth. Teams commonly end up standardizing on it as the single number everyone reports against, retiring the patchwork of platform dashboards that came before.

Limitations

  • Tracking runs on a browser pixel. Signal capture isn't server-side, so it misses the cookie and consent gaps S2S tracking is built to recover.
  • No profit layer. COGS, returns, and fees never enter the model, so decisions stay anchored to ROAS rather than actual margin.
  • MMM+ sits behind a paywall. It's walled off to Professional and up, so entry-tier brands get attribution only.
  • Setup is hard. "Complex" and "steep" recur even in five-star reviews, and there's no free trial to test that curve first.

Pricing

Starter runs roughly $1,000 to $1,500/month for brands under about $250K in monthly spend, priced on data volume. Professional moves to around $2,500/month above that mark. Enterprise, past $500K/month, is quoted individually.

Reviews

Northbeam sits at 4.5 out of 5 on G2 across 16 reviews. Confidence in the number over platform self-reporting comes up repeatedly; so does a steep ramp and a price that only pencils out once spend justifies it.

Bottom line: the sharpest pure attribution read on this list for high-spend brands, but the picture stops at revenue, and someone still has to turn the number into a budget change by hand.

3.

Triple Whale

4.5

Best for: Shopify sellers who want attribution, creative analytics and an AI operator bundled into one subscription rather than assembled from separate vendors.
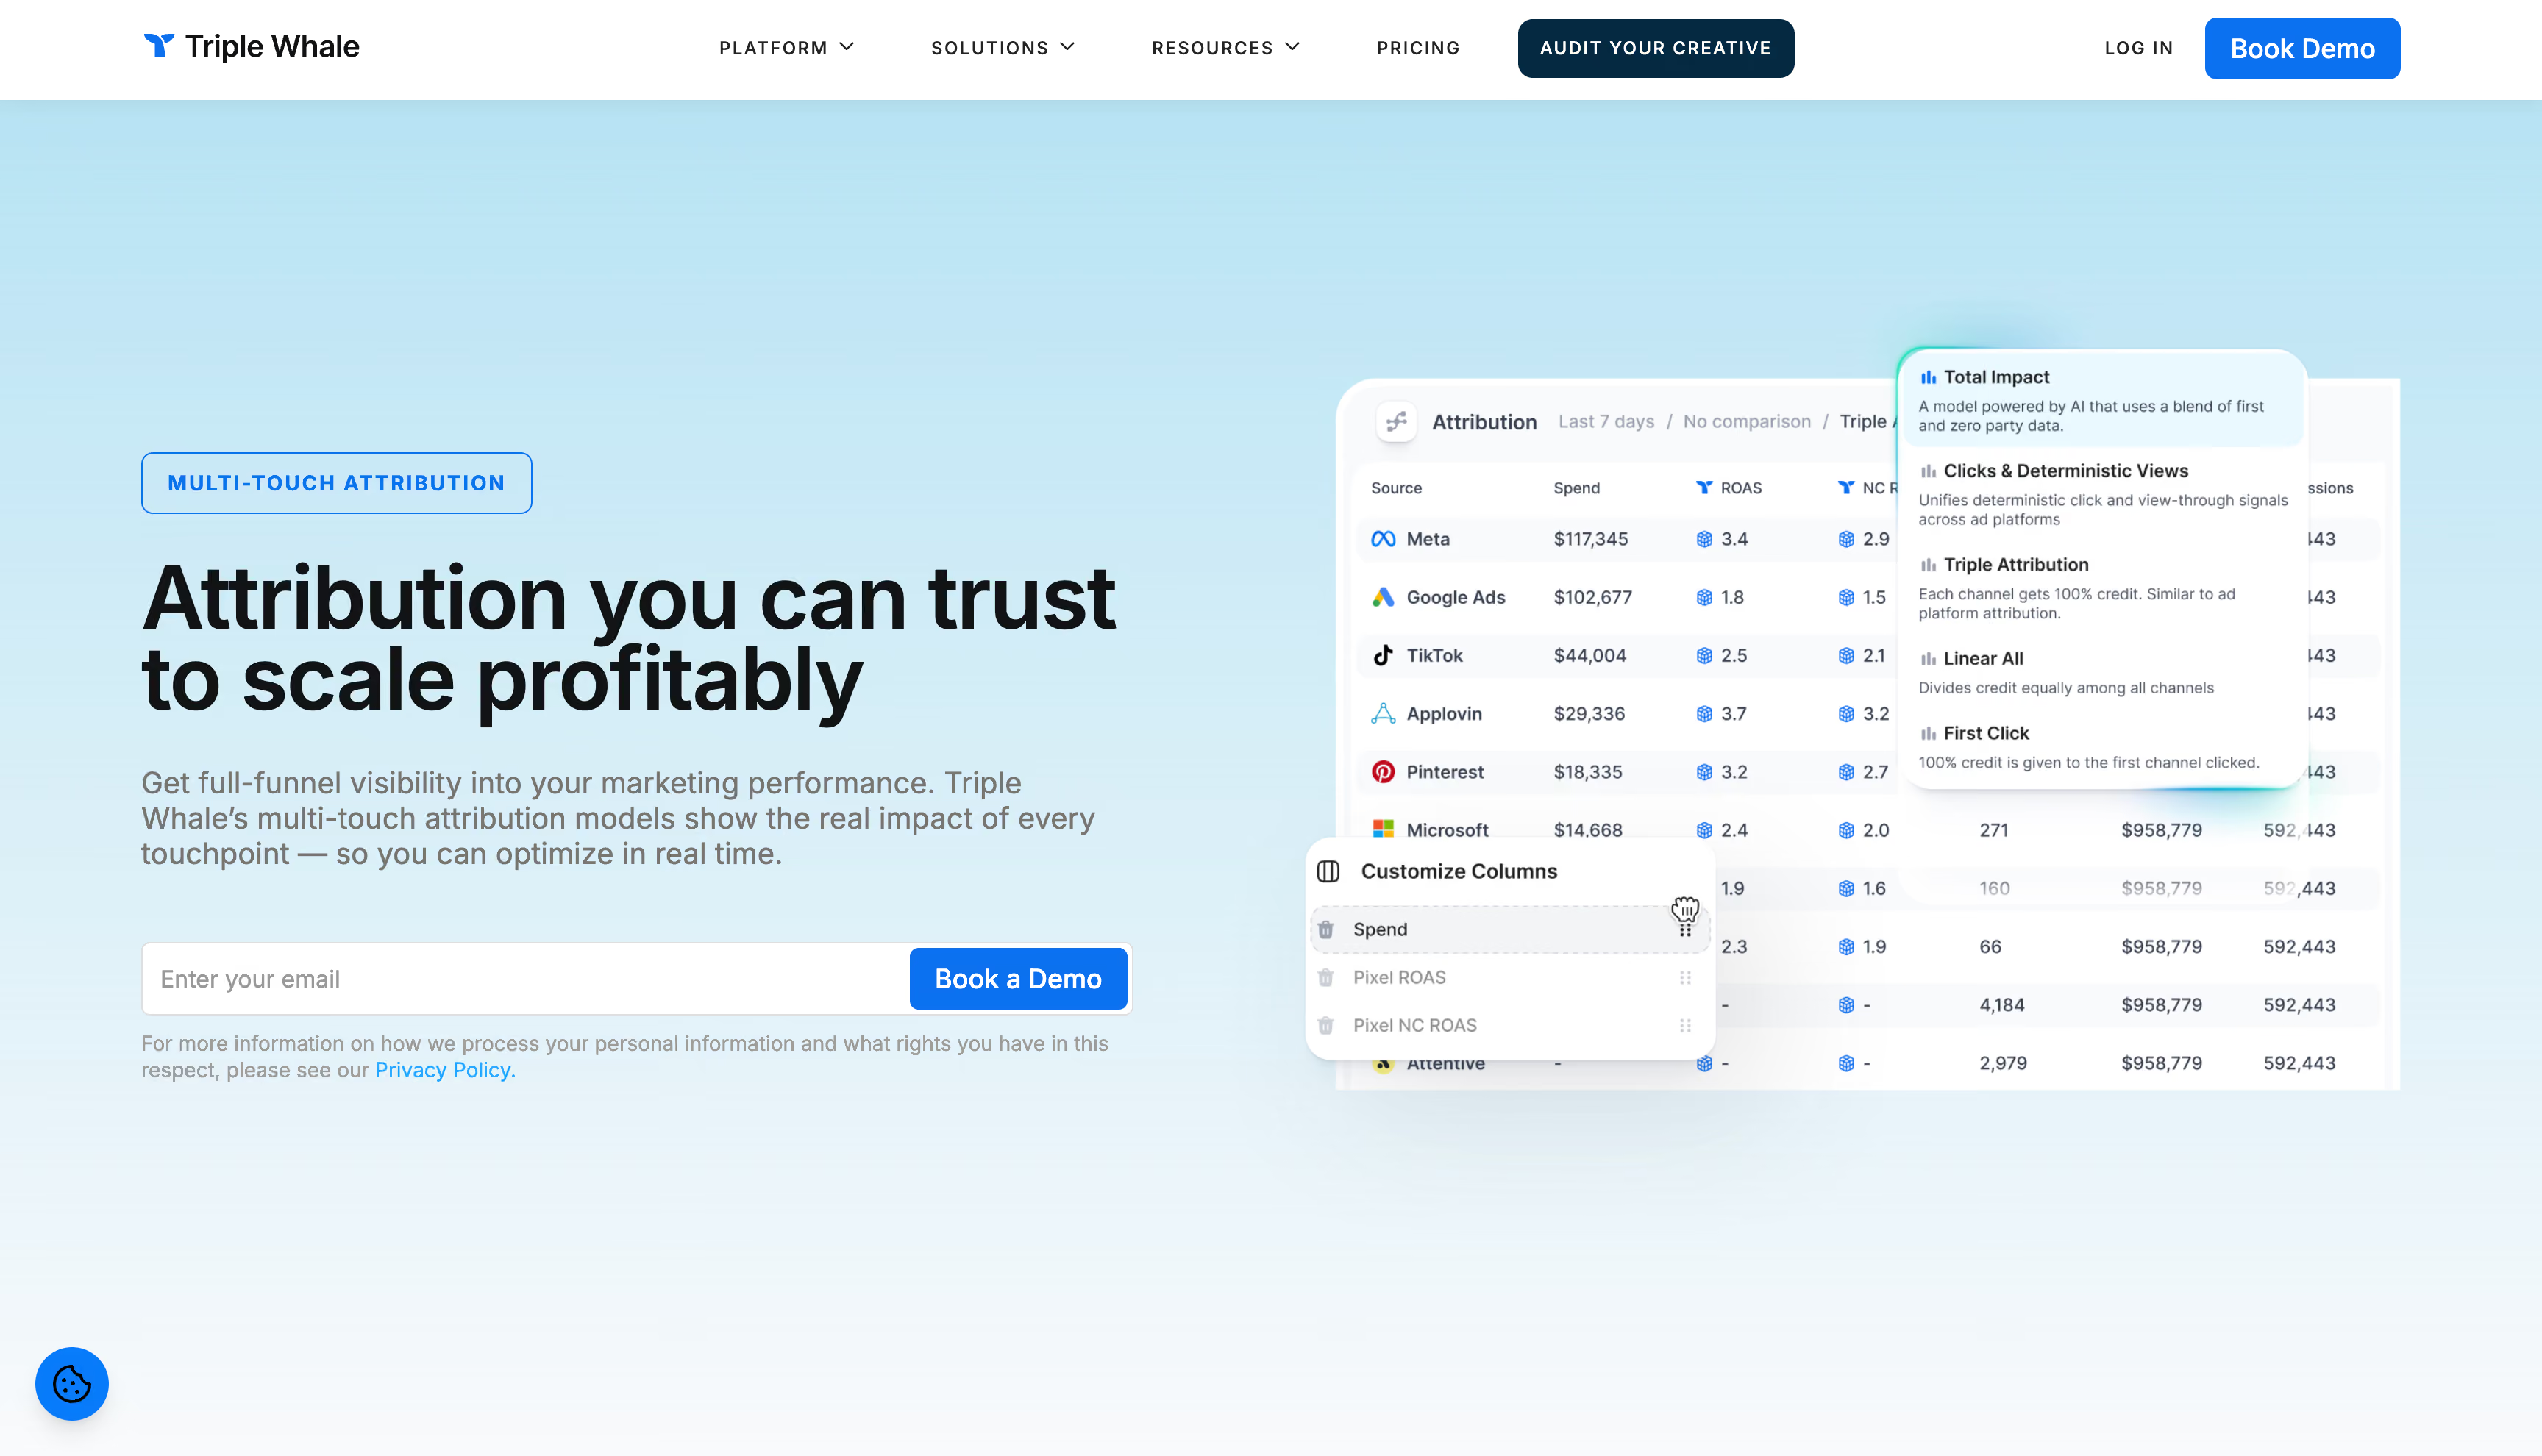
Triple Whale website homepage, an all-in-one e-commerce analytics and ad performance platform for DTC brands

What launched as a live ROAS counter has expanded into what Triple Whale now markets as an AI operating system for e-commerce, used by 30,000+ brands. The Triple Pixel handles identity resolution and attribution, Sonar pushes enriched conversions back to Meta and Google, and Moby, now on its second generation, has moved from answering questions to executing campaign changes directly.

Key features

  • Triple Pixel and Sonar. Identity resolution feeds Sonar Optimize, which sends enriched conversion data back through Meta and Google's APIs so the algorithms bid against real buyers.
  • Moby 2. Generates creative, rebalances budgets and runs scheduled reports, orchestrating GPT, Claude and Gemini rather than replacing them.
  • Compass. MTA, marketing mix modeling and incrementality testing calibrated against each other, sold as an add-on below Enterprise.
  • Cohort and product analytics. LTV, repeat-purchase and SKU-level reporting, gated to Advanced and above.
  • 60+ integrations. Major ad platforms plus Klaviyo, Recharge and Gorgias, with a data warehouse export option for teams running their own BI.

Strengths

  • Moby 2 moves past chat-based AI. It ships creative and adjusts spend on its own once guardrails are set, further into automation than most tools here attempt.
  • Setup is fast. Most brands connect Shopify and core channels in under 30 minutes.
  • The free plan is a real entry point. A brand can test blended ROAS and Triple Pixel tracking before paying anything.

Limitations

  • Profit stops at gross margin. There's no full contribution margin or EBITDA view netting out shipping, fees, and returns the way Admetrics does.
  • MMM sits behind an add-on. Compass is standard only on Enterprise, so the forward-looking measurement layer costs extra below that.
  • Pricing scales with GMV on 12-month contracts. Billing complaints recur in reviews: cancellation friction and charges continuing after brands tried to leave.
  • Non-Shopify platforms trail the primary integration. WooCommerce and BigCommerce don't track as cleanly as native Shopify data.

Pricing

Free covers basic tracking and blended ROAS. Foundation starts at $219/month for attribution and daily Moby use. Automate runs $749/month and adds automations plus AI creative generation. Enterprise, with Compass included, is custom-quoted.

Reviews

Among e-commerce analytics tools, G2 puts Triple Whale at 4.5 out of 5 across 478 reviews, with praise clustering on unifying e-commerce and ad data in one dashboard. The Shopify App Store skews bimodal, mostly five-star with a smaller cluster on attribution accuracy and contract terms.

Bottom line: the strongest Shopify-native pick among e-commerce analytics tools for AI doing real work fast, but profit tops out at gross margin, and the deeper measurement stack costs extra.

4.

Lifetimely

4.6

Best for: Shopify DTC brands that care more about what a customer is worth over time than about splitting attribution credit across touchpoints.
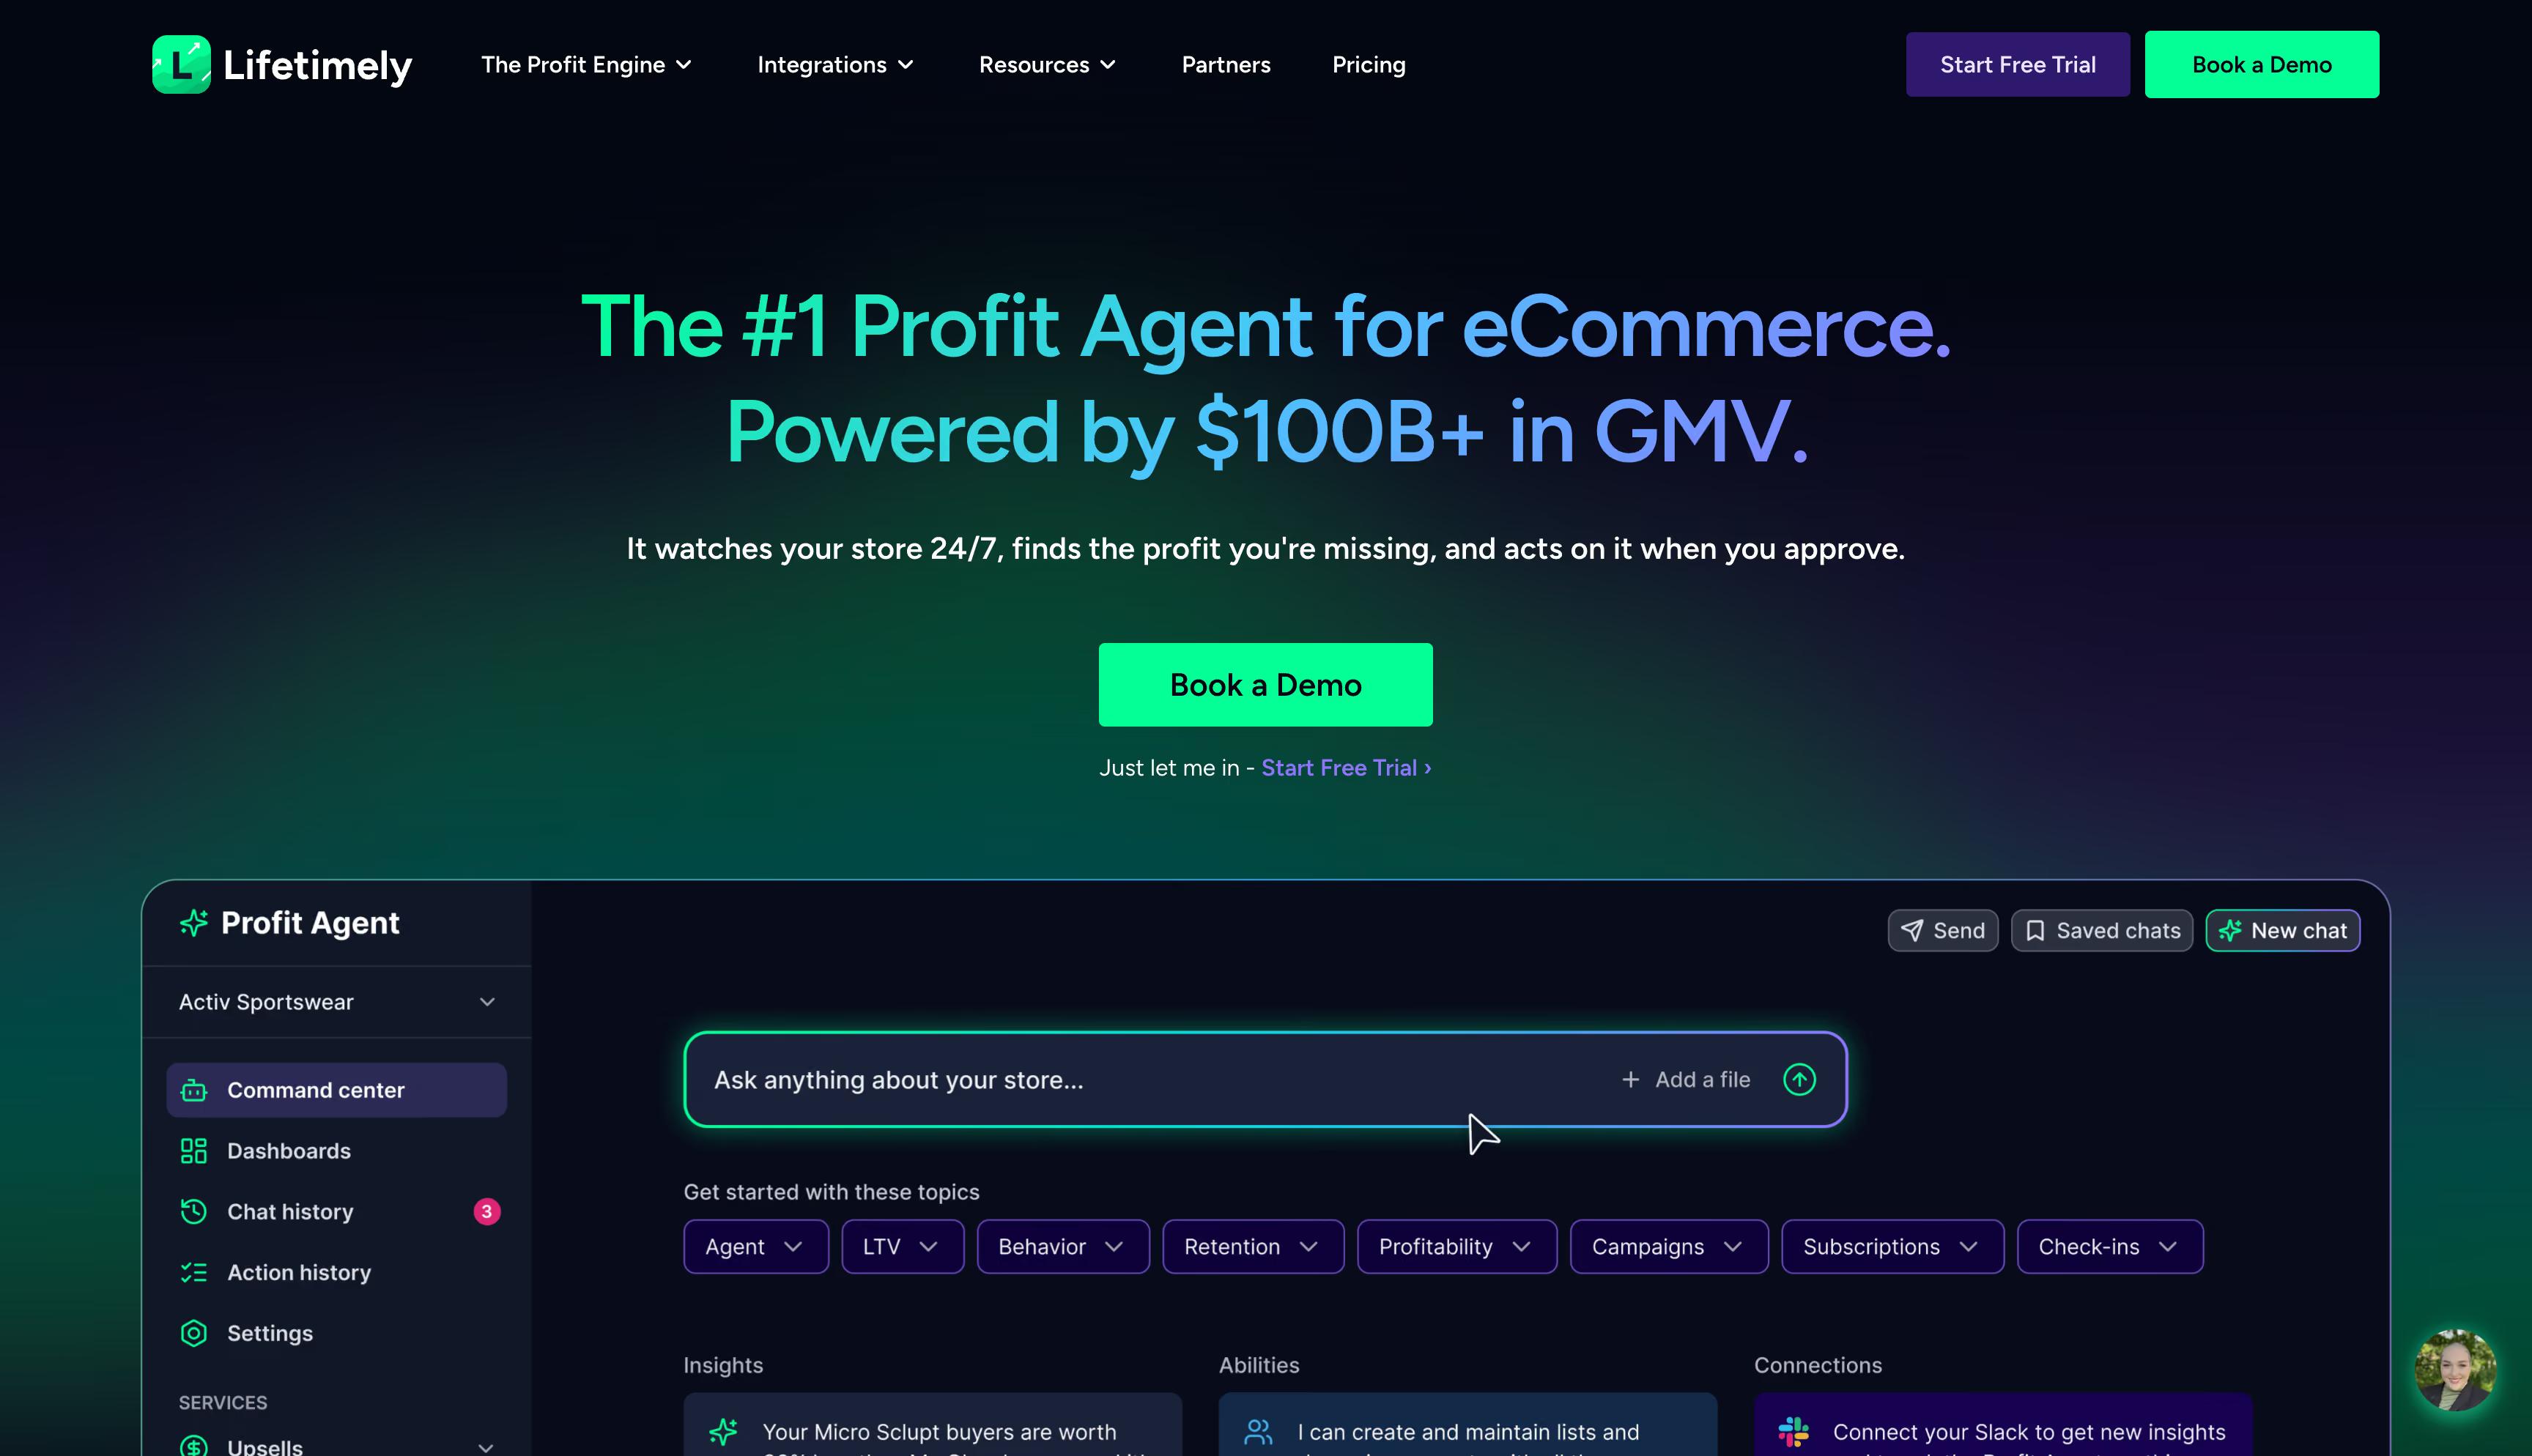
Lifetimely website homepage, an LTV and profit analytics platform for Shopify merchants

Lifetimely, now shipped as Lifetimely Profit Agent and LTV by AMP, started as a focused LTV app and has grown into a profit and cohort platform tracking $100B+ in GMV across 45,000+ stores. It answers a narrower question, not which channel gets credit, but what a customer is actually worth, and answers it in more depth than almost anything else here.

Key features

  • Daily profit and loss. COGS, ad spend, shipping, fees and refunds sit as first-class line items, refreshed through the day rather than backed into at month-end.
  • Predictive and cohort LTV. ML forecasts of 3, 6, 9 and 12-month customer value, segmented by acquisition date, channel, first product or geography.
  • Industry benchmarks. LTV, CAC, repurchase rate and AOV plotted against comparable stores in your category, a feature no other Shopify analytics app publishes.
  • Profit Agent. An AI layer that monitors P&L and LTV continuously and flags risks or opportunities with reasoning attached; you approve, it executes.

Strengths

  • Cohort analysis is the best available. Consistently rated the deepest on the Shopify App Store, filterable by acquisition date, first product, channel and discount code.
  • The free plan is genuinely free. It covers every feature for stores under 50 orders a month, not a stripped trial, and pricing scales by order volume with no silent overage on a single BFCM spike.
  • Support draws real praise. Named account managers walk merchants through the data rather than a ticket queue.

Limitations

  • No genuine multi-touch attribution. Reporting exists, but there's no model library or custom credit-splitting, so channel decisions still need a dedicated attribution tool alongside it.
  • Data isn't intraday. It refreshes every few hours, so same-day spend decisions will feel the lag.
  • Shopify-only. WooCommerce, BigCommerce and headless stores don't appear in the data, and there's no cross-store identity matching for multi-brand operators.
  • No server-side tracking. Nothing here recovers pixel loss or sends conversion enrichment back to ad platforms to improve delivery.

Pricing

Free up to 50 orders/month. Paid tiers run $149/month to 3,000 orders, $299/month to 7,000, and $499/month to 15,000, plus a $75/month Amazon add-on. Every plan includes every feature; only order volume changes.

Reviews

Lifetimely holds 4.8 out of 5 across 491+ Shopify App Store reviews and 4.6 on G2, among the highest-rated ecommerce analytics tools for LTV in the category. Praise centers on accuracy and support; criticism points to the refresh lag and a price jump hard to justify under roughly $30K in monthly revenue.

Bottom line: the deepest LTV and cohort tool among these ecommerce analytics platforms, a genuine complement to an attribution tool, but not a replacement for one.

5.

Daasity

4.7

Best for: omnichannel consumer brands doing $5M to $150M+ across DTC, Amazon, wholesale and physical retail that have outgrown lightweight, Shopify-only dashboards.
Daasity website homepage, an ELT and analytics platform for consumer product and e-commerce brands

Daasity is a modular data platform, not an attribution tool, built for brands where Shopify is only one channel among several. It pulls DTC, marketplace, wholesale and syndicated retail data into a warehouse the brand owns, cleans it into standardized models, and pushes segments back into marketing tools nightly. Where most tools here start from ad spend, Daasity starts from reconciling revenue across channels that all define it differently.

Key features

  • 60+ native connectors. Shopify, Amazon Seller Central, Walmart, ad platforms, Klaviyo, NetSuite and syndicated retail data from SPINS and Nielsen, feeding a customer-owned BigQuery, Snowflake or Redshift warehouse.
  • Fully-loaded contribution margin. Nets out fees, returns and retailer deductions, not just ad spend and COGS, across DTC, marketplace and wholesale.
  • Nightly segmentation and activation. RFM and LTV segments push automatically into Klaviyo, Meta and Google without manual CSV exports.
  • Cross-channel forecasting. Blends Shopify orders, Amazon FBA velocity and syndicated scan data into one demand forecast.
  • Managed professional services. A dedicated team builds custom models and manages the pipeline, standing in for the data engineer a brand would otherwise hire.

Strengths

  • Retail and syndicated data coverage is the clearest differentiator. SPINS, Nielsen and retailer portals give shelf-level and competitive velocity signals DTC-first tools don't carry.
  • It genuinely unifies every channel. DTC, Amazon, wholesale and retail land in one financial truth, the exact problem it's built to solve.
  • The support team draws consistent praise. Reviewers describe the relationship as closer to teammates than a vendor.

Limitations

  • No native attribution or MMM. Daasity pairs with a separate tool like Northbeam for channel credit, it doesn't assign multi-touch credit itself.
  • No server-side tracking. Its job is warehousing and modeling, not signal capture or conversion feedback to ad platforms.
  • Pricing is fully custom. No published tiers or free trial; quotes reportedly start in the low thousands per month, and budgeting needs a scoping call first.
  • The learning curve is steep. Looker-based modeling is coding-intensive, and onboarding commonly runs four to six weeks.

Pricing

Not published. Cost scales with data volume, connector count and services required, with implementations typically quoted in the low thousands per month.

Reviews

Among ecommerce analytics platforms, Daasity holds 4.7 out of 5 on G2 across 17 reviews. Praise centers on integration breadth and a support team reviewers treat as an extension of their own. The recurring critique is execution speed and a request for more built-in forecasting and anomaly detection.

Bottom line: among ecommerce analytics platforms, this is the strongest choice for reconciling DTC, wholesale and retail into one number, but it's infrastructure to pair with an attribution tool, not one itself.

6.

Peel Insights

4.5

Best for: Shopify and Amazon brands that want to know which customers are worth chasing again, and to act on that list without a CSV export.
Peel Insights website homepage, a retention analytics platform for Shopify and Amazon DTC brands

Peel Insights is a retention-first analytics platform built around one question: which customers come back, and why. It connects to Shopify, Amazon, and subscription platforms like Recharge and Skio, then turns that data into cohort, churn and RFM reporting that pushes straight into Klaviyo or Meta as live segments. Where most tools here chase the next customer, Peel squeezes more value from the ones already acquired.

Key features

  • Cohort analysis across 100+ metrics. Repurchase rate, days between orders, churn curves and cohort revenue, filterable by product, channel or discount code.
  • Segment activation. RFM buckets like champions, at-risk and lapsed push directly to Klaviyo or Meta with no manual list-building.
  • Subscription analytics. Native connections to Recharge, Skio and Smartrr track MRR, churn and cancellation reasons by product.
  • Daily Slack and email digests. Key metrics land where teams already work, before anyone opens a dashboard.
  • Explore. A build-your-own report tool with multi-filter, raw-data access for questions a template doesn't cover.

Strengths

  • Cohort depth is the standout. Repeatedly singled out as the deepest retention analysis available on Shopify, and the reason retention-focused teams pick it over broader BI tools.
  • Every plan includes 1:1 strategy calls. Reviewers consistently credit the team with building custom dashboards on request.
  • Ratings are consistently high. A clean 5.0 across 34 Shopify App Store reviews, backed up by 4.5 on G2 across 32.

Limitations

  • Attribution is shallow. Peel reads Shopify's own referrer and UTM data rather than running true multi-touch models, and a G2 reviewer flags it as the area most in need of work.
  • No server-side tracking. Nothing here recovers what a browser pixel misses or feeds enrichment back to ad platforms.
  • No profit layer. COGS, fees and contribution margin don't appear in the reporting; Peel measures revenue and retention, not what's left after costs.
  • Pricing scales with order volume. The feature set stays flat, so a growing brand pays more for the same reports without unlocking anything new.

Pricing

Core runs $199/month for up to 16,000 orders, Essentials $499/month up to 29,000, Accelerate $899/month up to 62,000, each with a 7-day free trial.

Reviews

Among ecommerce analytics tools, Peel holds 5.0 out of 5 on the Shopify App Store across 34 reviews and 4.5 on G2 across 32. Praise is consistent: fast setup, responsive support, genuinely deep retention reporting. The recurring critique is cost relative to feature depth as order volume climbs.

Bottom line: the sharpest retention and cohort tool among these ecommerce analytics tools, but a companion to an attribution platform, not a substitute for one.

7.

Glew

4.5

Best for: multichannel and multi-store operators who want every platform they sell on pulled into one reporting layer without building it themselves.
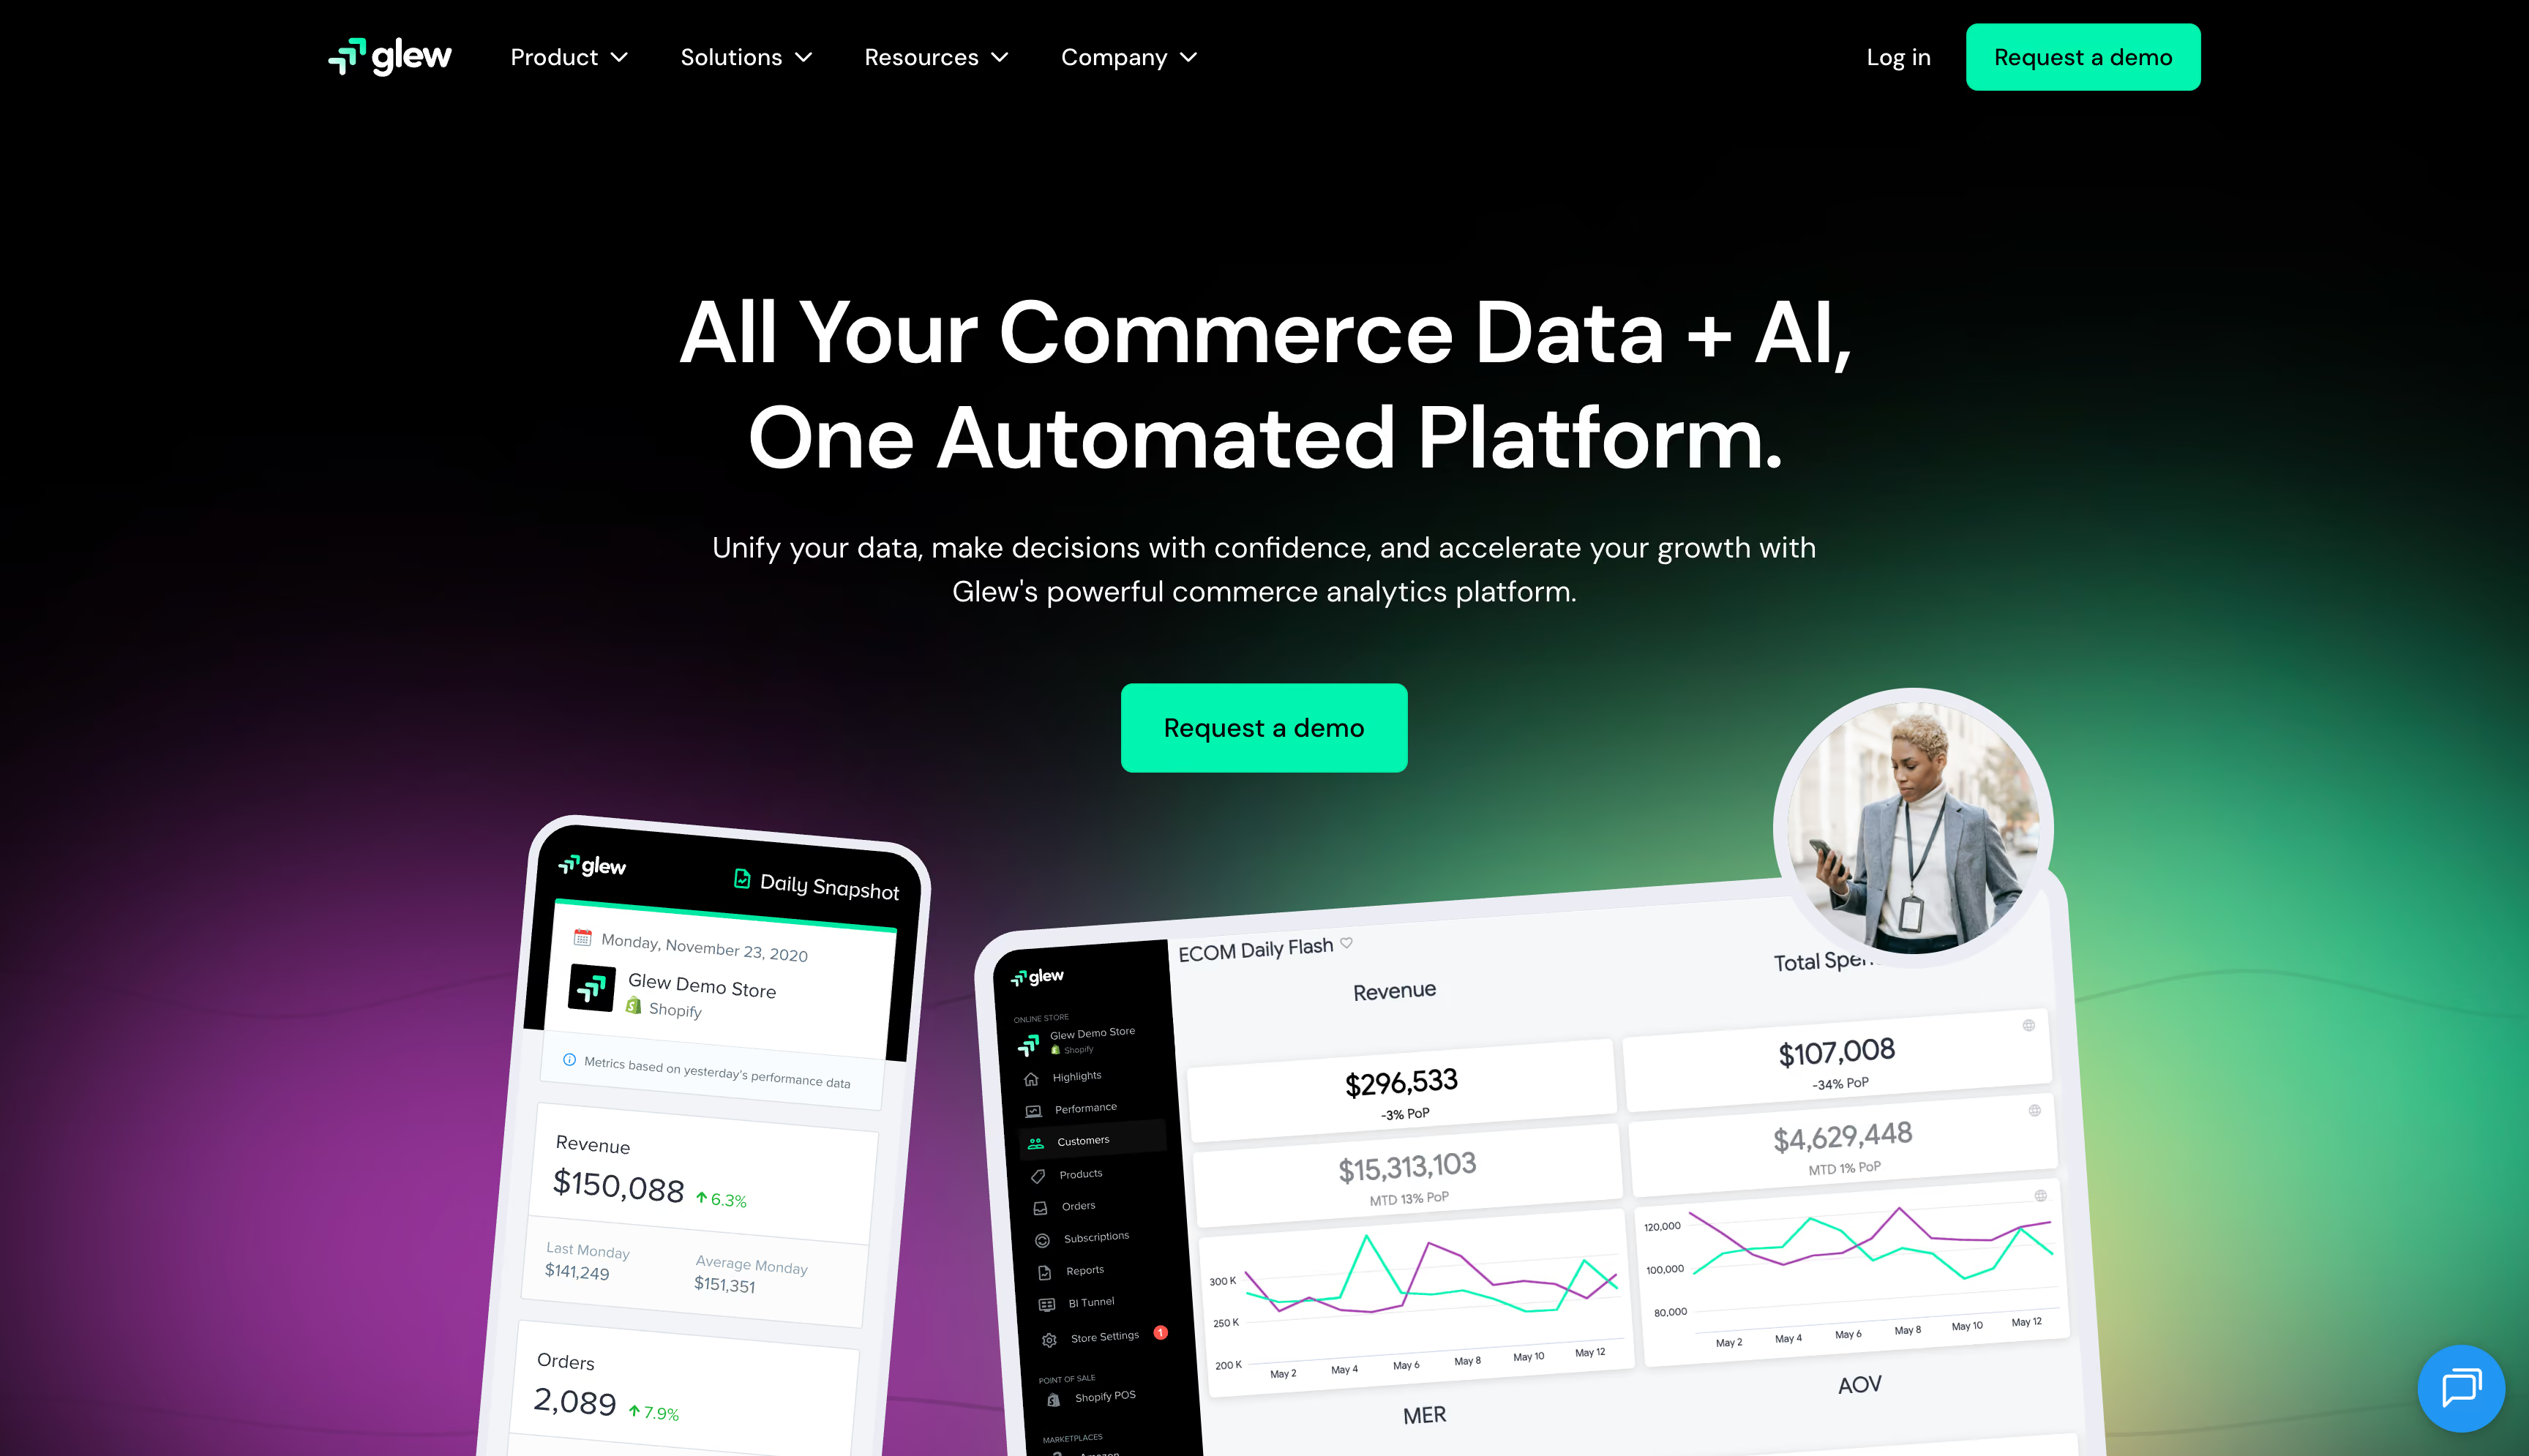
Glew website homepage, a multi-channel e-commerce analytics and marketing attribution platform for online retailers

Glew is a managed ETL and BI platform, an ecommerce analytics tool built to unify ecommerce, POS, marketing, inventory and subscription data from more sources than almost anything else here. It doesn't compete with GA4 or an attribution tool so much as sit downstream of them, pulling their data alongside Shopify, Amazon and 150+ other systems into prebuilt dashboards a team can use without writing a query.

Key features

  • 150+ native integrations. Ecommerce platforms, POS, ad channels, inventory, shipping and ERP systems feed one managed data warehouse.
  • Prebuilt dashboards. Hundreds of out-of-the-box calculations for sales, marketing, customer and product performance, live without report-building.
  • Individual customer profiles. Order history, returns, status and total spend surfaced per customer.
  • Subscription analytics. MRR and churn rate tracked alongside standard metrics for brands running recurring revenue.
  • Multi-store consolidation. Multiple Shopify or Amazon accounts roll into one unified view.

Strengths

  • The connector catalog is the widest here. 150 to 180+ integrations spanning ecommerce, fulfillment and ERP, which matters most for brands running several sales channels at once.
  • It arrives configured. Reviewers repeatedly note the dashboards are ready on day one, a real advantage for teams without in-house BI experience.
  • Support draws unusually strong praise. Described by reviewers as a genuine extension of their team rather than a vendor relationship.

Limitations

  • No attribution engine of its own. Glew enhances platforms like GA4 or Adobe rather than replacing them, so there's no multi-touch modeling, only what those upstream tools already calculated.
  • No server-side tracking. Glew sits downstream of tracking rather than performing it, so there's no signal feedback to ad platforms.
  • The Pro plan caps out fast. The tier most brands land on has a smaller integration subset with no warehouse access; full coverage requires custom-priced Glew Plus.
  • Data quality depends on upstream setup. If goals or UTMs aren't configured correctly in the source platform, Glew imports that same bad data rather than correcting it.

Pricing

Plans range from $79 to $649/month across tiers, with Pro requiring annual prepay. Glew Plus, unlocking warehouse access and full integrations, is custom-priced.

Reviews

Glew holds 4.5 out of 5 on the Shopify App Store across 68 reviews, mostly five-star, with a smaller cluster citing cancellation friction and upsell pressure toward the Plus tier.

Bottom line: the broadest connector library among these ecommerce analytics tools for multichannel operators, but a reporting layer to feed with clean data, not a tracking or attribution system in its own right.

8.

Google Analytics 4 (GA4)

4.5

Best for: any store that needs a free, universal ecommerce analytics baseline, paired with a dedicated attribution or profit tool once real budget is on the line.

Google Analytics 4 (GA4) website homepage, a free web and ecommerce analytics platform for online stores

Nearly every online store already has GA4 installed, which is the whole reason it's still relevant. It replaced Universal Analytics with an event-based model built around view_item, add_to_cart, begin_checkout and purchase events, each carrying an items array down to SKU and price. On-site behavior and channel-level traffic are where it holds up. Deciding where budget goes next is a different job entirely.

Key features

  • Event-based ecommerce tracking. Product views, cart actions and purchases logged as structured events rather than the old session-and-hit model, giving product-level reporting once configured correctly.
  • Data-Driven Attribution. ML credit-splitting across the customer journey, though Google recommends at least 400 monthly conversions before treating the output as statistically reliable.
  • Native Google Ads integration. Campaign, keyword and audience data flow in without extra configuration, sharpening acquisition reporting inside the Google ecosystem.
  • BigQuery export. Free, unsampled raw event data for teams building their own models on top.

Strengths

  • It's free at essentially any traffic volume. And it has the deepest, lowest-friction integration into Google Ads of any tool here.
  • Data-Driven Attribution beats last-click. A real step forward once conversion volume supports it, included at no cost.
  • BigQuery export is genuinely useful. It gives technical teams a real warehouse-native option without paying for GA4 360.

Limitations

  • Tracking is client-side only. No server-side capture means GA4 revenue commonly reads 20 to 30% under what Shopify or Stripe report, a gap that widens as ad blockers and consent opt-outs grow, and one Admetrics' S2S layer closes.
  • Attribution has four models total. Below the 400-conversion threshold, Data-Driven Attribution quietly falls back toward last-click with little warning in the interface.
  • No profit layer at all. GA4 stops counting the moment a purchase event fires, so COGS, shipping, fees and returns stay invisible and there's no POAS to rank channels by.
  • Nothing here acts on the data. GA4 reports; it doesn't push a budget change, enrich a bidding signal, or execute anything on its own.

Pricing

Standard properties run at no cost, which is the setup most stores use. GA4 360 layers on unsampled reporting, SLAs and dedicated support at custom enterprise pricing.

Reviews

GA4 holds 4.5 out of 5 on G2 across 6,800+ reviews, the largest base of any tool here by far. Praise centers on being free and deeply integrated; the complaint is the relearning curve from Universal Analytics and numbers that don't reconcile against the backend.

Bottom line: it's worth keeping installed as the free layer everyone already has, just don't hand it the decision about where next month's ad dollars should actually go.

9.

Adobe Analytics

4.2

Best for: large enterprises already inside Adobe Experience Cloud that need complex segmentation and cross-channel attribution more than ecommerce-specific profit reporting.
Adobe Analytics website homepage, an enterprise behavioral and customer journey analytics platform for large retailers

Adobe Analytics grew out of Omniture's SiteCatalyst and remains the enterprise standard for teams doing more than store analytics, sites, apps, content and offline touchpoints stitched into one behavioral model. Analysis Workspace lets analysts drag and drop dimensions and segments into custom reports without writing queries, and its deepest value shows up once a brand already runs Target, Real-Time CDP or Journey Optimizer alongside it.

Key features

  • Analysis Workspace. Drag-and-drop freeform tables, cohorts, segmentation and multi-touch attribution, with real-time streaming collection and no data sampling.
  • Customer Journey Analytics. Cross-device identity stitching merging behavioral and offline data into one person-level view.
  • Advanced Attribution and Predictive Workbench. Multi-touch attribution plus ML forecasting of future behavior, sold as add-ons.
  • Deep Experience Cloud integration. Insights and audiences push directly into Target and Journey Optimizer for activation, not just reporting.

Strengths

  • Analysis Workspace handles genuinely complex queries. Segmentation most tools here can't express, why enterprise analysts keep it even alongside something lighter.
  • Activation is real, not theoretical. Audiences push straight into Target or Journey Optimizer, closing an insight-to-action loop GA4 doesn't have.
  • No sampling, ever. Real-time streaming holds at any data volume, a real technical edge over free-tier tools once traffic scales into enterprise range.

Limitations

  • No profit layer. Adobe Analytics measures behavior and attribution, not COGS, shipping or contribution margin, so there's no POAS the way Admetrics carries through.
  • Nothing feeds back into ad platform bidding. Attribution informs analysis and activation inside Adobe's own suite; it doesn't enrich Meta or Google's algorithms the way server-side platforms do.
  • Cost and complexity are real barriers. Full deployments run $150,000 to $200,000+ annually, implementation partners add $20,000 to $100,000 more, and the platform requires JavaScript and schema expertise most ecommerce teams lack in-house.
  • Not ecommerce-native. Non-Adobe platforms like Shopify need middleware to connect cleanly, unlike tools built around a single ecommerce data model.

Pricing

Fully custom, not published. Tiers scale by data volume, report suites and feature access, with Ultimate deployments reaching six figures annually before implementation.

Reviews

Among ecommerce analytics tools, Adobe Analytics holds 4.2 out of 5 on G2 across 1,217 reviews. Praise centers on analytical depth and flexibility; the recurring complaint is a steep learning curve and setup that assumes dedicated technical staff.

Bottom line: the deepest enterprise behavioral analytics platform among these ecommerce analytics tools, but it's built for organizations already in the Adobe ecosystem, not for a brand looking for ecommerce profit answers.

10.

Mixpanel

4.5

Best for: product and growth teams that want to understand which on-site actions actually drive repeat purchases, not which ad channel deserves credit for them.
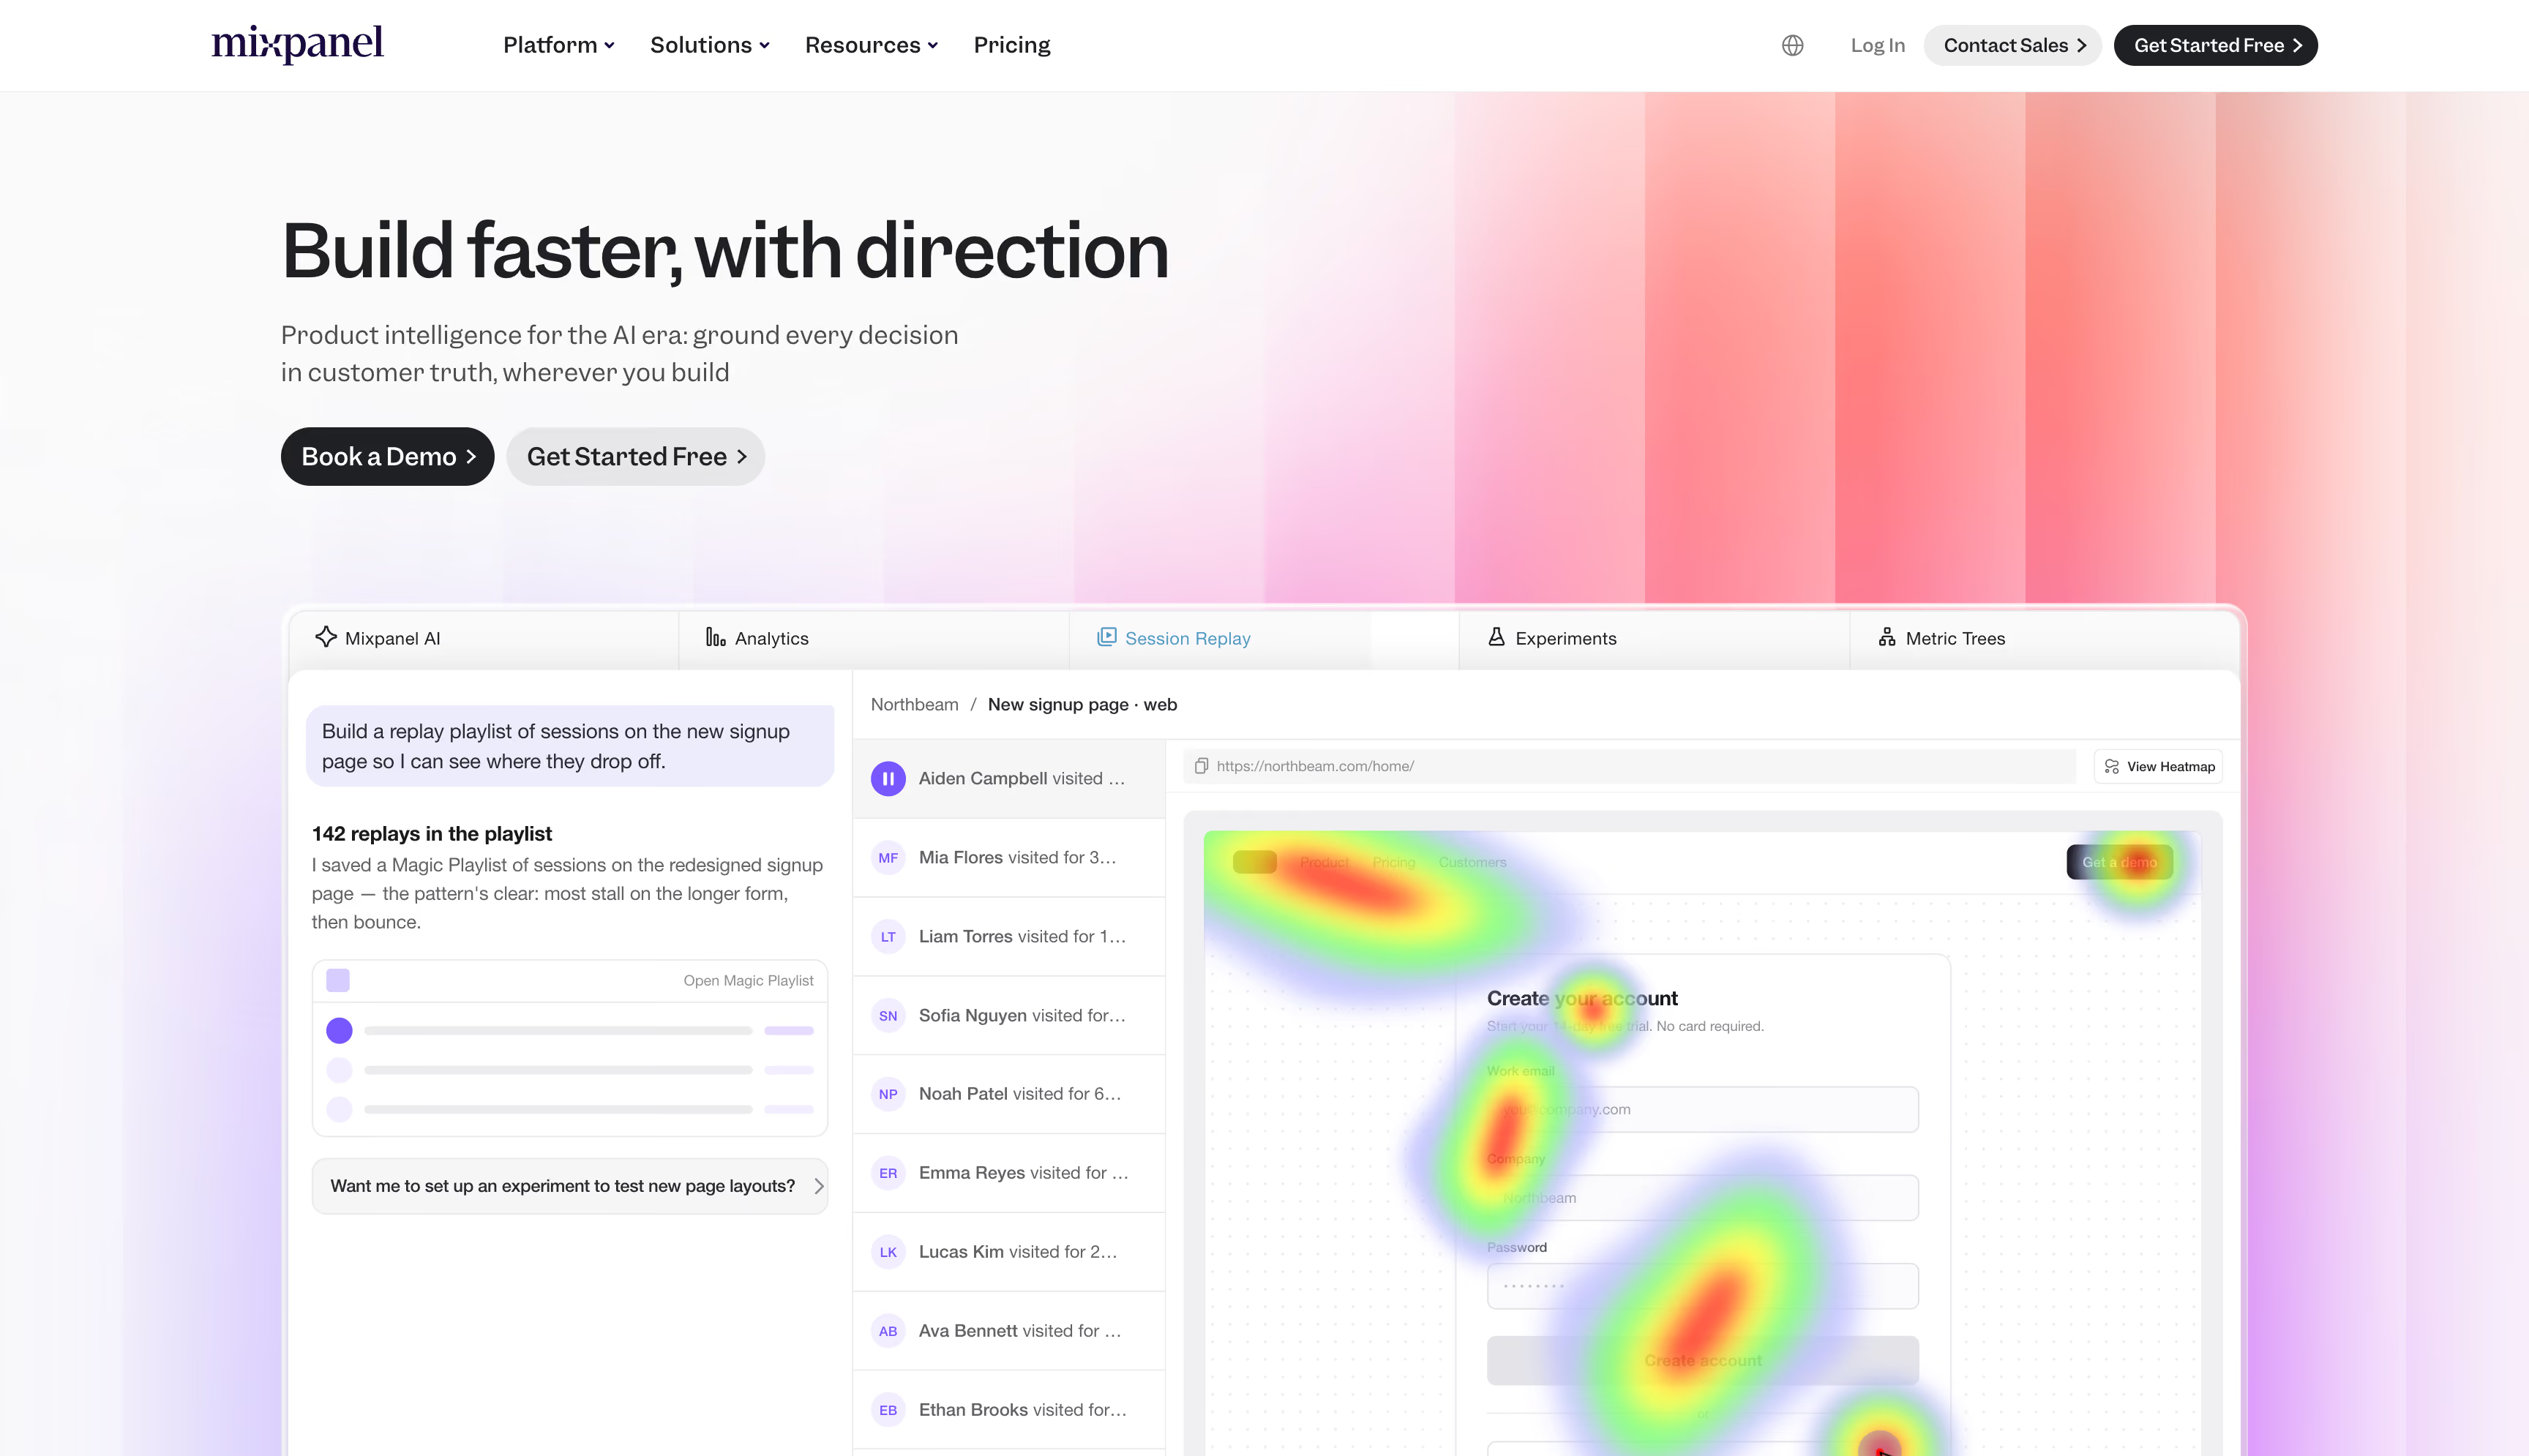
Mixpanel website homepage, an event-based product analytics platform for on-site shopper behavior

Mixpanel is an event-based product analytics platform, one of the few ecommerce analytics tools built around behavior rather than spend, and for ecommerce, that distinction matters. Instead of pageviews and sessions, it tracks specific actions, add-to-cart, checkout step, product filter, and lets a team build funnels and cohorts around them without writing SQL. It answers a different question than most tools here: not which channel brought the customer, but which parts of the buying experience keep them coming back.

Key features

  • Event-based funnel analysis. Track any sequence of actions, from product view to purchase, and see exactly where drop-off happens at each step.
  • Behavioral cohorts. Segment users by what they did, not just who they are, then compare retention across cohorts.
  • Spark AI. Natural-language querying that lets a non-technical team member ask a question and get a chart back.
  • Self-serve interface. Product managers and marketers build their own funnels and retention views without a data analyst for every question.

Strengths

  • The free tier is the most generous in product analytics. 1 million events a month, unlimited seats, and core funnel and retention features at no cost.
  • Event-level tracking answers questions session-based tools can't. Like which on-site actions correlate with a customer becoming a repeat buyer.
  • The self-serve interface removes the SQL bottleneck. Product and growth staff build and iterate on their own.

Limitations

  • No real marketing attribution. Mixpanel tracks what happens on-site, not which ad or channel drove the visit, so it can't replace a dedicated MTA tool.
  • No server-side tracking. Its job is behavioral analytics, not ad signal recovery or conversion enrichment sent back to ad platforms.
  • No profit layer. There's no COGS, contribution margin or POAS anywhere in the platform; revenue and retention are tracked, not what's left after costs.
  • Pricing can spike unpredictably. It scales with event volume past the free tier, a recurring theme in reviews.

Pricing

Free covers up to 1 million events a month with unlimited seats. Growth starts around $20/month and bills roughly $0.28 per 1,000 events beyond the first million. Enterprise pricing is custom.

Reviews

Mixpanel holds 4.5 out of 5 on G2 across roughly 1,365 reviews. Praise centers on ease of use and self-serve event tracking; the recurring complaint is unpredictable cost growth and identity-merge issues across devices.

Bottom line: among ecommerce analytics tools, a genuinely strong lens on what happens after the click, but it has no view of what happened before it, and no profit answer once you're inside the store.

The best ecommerce analytics tools 2026: final verdict

The best ecommerce analytics tools for 2026 split into two categories: platforms that tell you what happened, and platforms that tell you what to do about it. Admetrics tops this list because it doesn't stop at either half, the server-side layer catches what a pixel misses, the attribution runs through nine models instead of one, and the profit math and budget moves happen inside the same product rather than a separate spreadsheet somebody has to maintain.

The rest earn their place for narrower jobs. Northbeam and Triple Whale go deep on attribution and AI-driven creative. Lifetimely and Peel Insights own cohort and LTV math better than anything general-purpose here. Daasity and Glew solve data plumbing for multichannel brands. GA4, Adobe Analytics and Mixpanel remain the free or enterprise starting point most teams already have installed, just not the tool that should be deciding where next month's budget goes.

Pick the ecommerce analytics platform that answers the question you're actually stuck on, not the one with the longest feature list. Most brands end up running two pieces of ecommerce analytics software — one for behavior, one for money — and the expensive mistake is expecting either to do the other's job.

READY TO STOP GUESSING?

See what your ad platforms aren't telling you

Connect Shopify and your ad accounts, and see POAS per channel.
Start free trial →
Easy setup
No code required
21 Day Trial
60%
ROAS increase
+30%
Conversions tracked
4,97
Average review rating
50%
Less "unknown" revenue

Frequently Asked Questions

What's the best ecommerce analytics software?

For ecommerce and DTC brands, Admetrics leads in 2026; it's the one platform here that pairs server-side tracking with real attribution and carries the result through to profit and an actual spend decision. If attribution alone is the need, Northbeam or Triple Whale cover that narrower job well. And if the real question is the best analytics software for ecommerce at zero cost, GA4 stays the fallback — with every limit that comes with it.

What are the best analytics tools for ecommerce in 2026?

Admetrics, Northbeam and Triple Whale lead on attribution and profit; Lifetimely and Peel Insights own retention and LTV; GA4 and Mixpanel cover on-site behavior at no cost. The best analytics for ecommerce depends on the decision you're stuck on — which channel to scale, which customer to win back, or which SKU is quietly losing money once shipping and returns come out.

Is there good predictive analytics for ecommerce?

Yes, though the depth varies by tool. Lifetimely forecasts LTV at 3, 6 and 12 months per cohort, and GA4 offers predictive purchase and churn probability once a property clears its conversion threshold. Neither forecasts what a shift in ad spend would return the way a mix model does.

What's the best ecommerce data analytics software for a multichannel brand?

DaaSity and Glew are purpose-built for that: Daasity for brands reconciling DTC with wholesale and retail, Glew for the widest connector catalog across sales channels. Neither one runs attribution on its own, so pair either with a dedicated attribution platform.

Is GA4 enough for ecommerce analytics?

For a brand just getting off the ground, GA4 covers the basics well enough. It's free, tracks on-site behavior cleanly, and gives channel-level traffic data without any setup cost. What it can't do is carry a real budget decision; tracking stays client-side, attribution tops out at four models, and profit never enters the picture at all. Most stores keep it running for traffic while a dedicated attribution or profit tool handles the spending decisions.

What's the best ecommerce analytics tool for a small business or new store?

For a new or small store, free or low-cost tools make more sense than a full profit stack. GA4 covers traffic and channel reporting at no cost, and Mixpanel's free tier handles on-site behavior up to a million events a month. Once ad spend and order volume climb, moving to a dedicated attribution or profit platform like Admetrics starts paying for itself.

What's the difference between ecommerce attribution and ecommerce analytics?

Ecommerce analytics is the broader category, tracking and reporting on how a store performs. Attribution is one job inside that category: deciding which marketing touchpoint gets credit for a sale. GA4 and Mixpanel are analytics without real attribution; Northbeam and Admetrics are built around solving attribution first, then layering profit or BI on top.